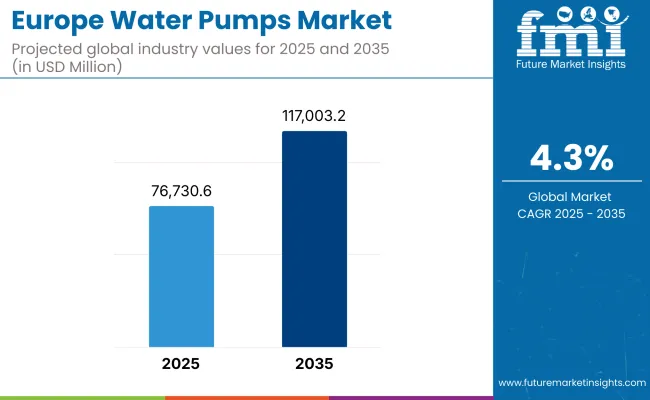
The European water pumps market is growing rapidly, driven by growing investments in requirements of refurbishment of water infrastructure, fluid handling systems of the industries, and building energy efficient technologies. Pumps are the most widely used form of fluid mover across municipal, commercial, and industrial water and wastewater treatment facilities, HVAC systems, and process industries. The market is estimated to reach USD 76,730.6 million in 2025 and is expected to reach USD 117,003.2 million at the end of 2035, with a growth rate of 4.3% (CAGR) during the forecast period.

| Metric | Value |
|---|---|
| Market Size (2025E) | USD 76,730.6 million |
| Market Value (2035F) | USD 117,003.2 million |
| CAGR (2025 to 2035) | 4.3% |
Stringent EU regulations regarding energy efficiency, emissions and water resource management are changing pump design standards and procurement models. The shift to IE4 and IE5 motor technologies, digital control systems and variable frequency drives is helping to create more energy-efficient systems for moving water. The utility sectors in Germany, France, Italy, and the Nordics are replacing aging pump infrastructure, while private sectors are implementing smart pumping solutions to optimize energy consumption and maintenance costs.
Pump manufacturers are focusing on corrosion-resistant materials, noise-reduction designs, and self-priming mechanisms for critical applications. Commercial complexes are demanding multi-stage centrifugal pumps and the municipal water system is demanding vertical turbine pumps. Across Europe’s digital water management landscape, the convergence of cloud-based monitoring, AI-enhanced predictive diagnostics, and real-time pressure optimization is generating momentum.
Boosting in large part by government-led infrastructure modernization, industry automation trends, and green building certifications (BREEAM, LEED, etc.) the adoption of efficient water pumps will be in new constructions and retrofits. The trend towards decentralization of water management systems and flood control infrastructure is also broadening the applications of high-performance water pumps.
High-efficiency water pumps in municipal water supply, wastewater treatment, and district heating are in strong demand in Northern Europe. Countries like Sweden and Finland are retrofitting public infrastructure to meet climate neutrality targets, paving the way for pumps that have low energy consumption and advanced monitoring and control capabilities. Over time, more such smart pumps integrated with IoT platforms are being deployed in both urban water systems along with remote, industrial setups.
The regional market is led by Western Europe, which has a well-developed industrial base, stringent water conservation laws, and the refurbishment of antiquated pumping systems. North America is witnessing high adoption of variable frequency drive (VFD)-enabled pumps in manufacturing, construction, and public utilities, along with Germany, France and Benelux region. Centrifugal and submersible pumps are commonly used for large-scale irrigation, HVAC, flood control, etc., and there is a growing interest in predictive maintenance and integration with digital twins.
In Southern Europe, demand for water pumps is growing at a fast pace in agriculture, tourism and urban water distribution. Countries with dry zones an example is Italy, Spain, or Portugal now need efficient pumps to secure irrigation, from one side, or to upgrade hotel and resort infrastructure, from the other side. Second, pumps based on solar or hybrid technology are gaining traction in rural areas and islands where the balance between renewable integration and water efficiency (and, indeed, compliance with wider EU sustainability targets) is paramount.
The eastern part of Europe is seeing heavy investment in pump infrastructure, primarily in rural access to water, industrial upgrades, and flood control. Countries like Poland, Romania and Bulgaria are taking advantage of EU cohesion funds and are installing solid and inexpensive pump systems throughout wastewater treatment and urban drainage networks. Operating at significant speeds and thus needing little maintenance, energy-efficient solutions are becoming a greater priority for many local governments and utilities.
Challenges
High Initial Costs and Fragmented Regulatory Standards
Energy-efficient pump solutions often are described by higher first cost when sophisticated motors combined with smart control systems are included. Small utilities, municipalities lack budget to adopt In addition, variable standards and slow harmonization between countries regarding pump efficiency classifications make for inefficient procurement processes and adherence efforts.
Opportunities
Demand for Smart Water Management and Renewable Integration
Increasing demand for intelligent water pump systems such as remote control, automatic water pressure adjustment, and fault prediction. European Union (EU) targets to decrease energy consumption in water transportation and the introduction of renewable energy to water infrastructure segments have generated a promising market for the incorporation of solar-powered alongside hybrid equipped pump systems. Urban resilience plans and circular economy principles are also driving demand for modular, service-friendly pump systems with long operational lifespans.
European water pumps market overview included an analysis of major drivers from 2020 to 2024, including rising water security, climate adaptation and the sustainable buildings mandates. Replacement demand increased as power companies were determined to pare down their electricity use and adhere EU Eco-design standards. The need for decentralized water pumping systems that could serve both health and sanitation infrastructure were brought into relief in COVID-19.
By the period of 2025 to 2035, the market will gradually evolve towards wholly connected water infrastructure systems, where water pumps are at the heart of automation for distribution, smart grid integration, and environmental monitoring. Agricultural water handling will be electrified, circular pumping systems will be employed for wastewater reuse, and pumped systems will be powered by microgrids. Complete service models offered by manufacturers, from installation to monitoring and lifecycle optimization.
Market Shifts: A Comparative Analysis 2020 to 2024 vs. 2025 to 2035
| Market Shift | 2020 to 2024 Trends |
|---|---|
| Technology Focus | IE3/IE4 efficiency motors and VFDs |
| Demographic Penetration | Utilities, large industry |
| Treatment Settings | Centralized water treatment |
| Geographical Growth | Germany, UK, France |
| Application Preference | Wastewater and clean water supply |
| Cost Dynamics | High CapEx , energy savings-driven ROI |
| Consumer Behaviour | Energy efficiency compliance |
| Service Model Evolution | Equipment-focused procurement |
| Market Shift | 2025 to 2035 Projections |
|---|---|
| Technology Focus | Smart grid-ready pumps, IoT -connected, and AI-optimized units |
| Demographic Penetration | SMEs, agriculture, and distributed urban systems |
| Treatment Settings | Decentralized pumping and smart water loops |
| Geographical Growth | Eastern Europe, Spain, Scandinavia |
| Application Preference | Multi-use (flood control, greywater reuse, HVAC optimization) |
| Cost Dynamics | Total cost of ownership and lifecycle value as procurement drivers |
| Consumer Behaviour | Preference for digitalized, low-maintenance pump systems |
| Service Model Evolution | Subscription models, remote O&M, and predictive analytics platforms |

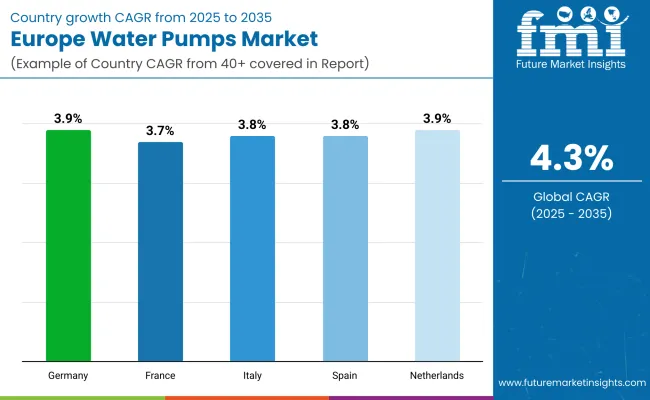
Germany is the leading market for European water pumps as they are used in a variety of municipal water systems, industrial manufacturing applications and building HVAC. Demand for high-performance centrifugal pumps, particularly single-stage and circulator types, is increasing in response to the country’s strict energy efficiency standards. Sales of above 30 HP pumps for continuous operations are also driven by the industrial sector (automotive, chemicals, etc.).
| Country | CAGR (2025 to 2035) |
|---|---|
| Germany | 3.9% |
In France, demand for water pumps is influenced by the modernization of residential infrastructure, agricultural irrigation, and increasing wastewater treatment facilities. Water extraction and distribution projects increasingly use submersible and multi-stage centrifugal pumps this has been driven even more by government funding for sustainable water management, which is further accelerating adoption in both urban and rural communities.
| Country | CAGR (2025 to 2035) |
|---|---|
| France | 3.7% |
Italy’s dependence on water pumps cuts across agriculture, building services and industrial processing. For residential complexes & irrigation systems, pumps of 5-10 HP capacity are predominant. Increasing use of circulators in smart heating and cooling applications is impacting the demand, especially in the northern part with a high number of underfloor heating systems.
| Country | CAGR (2025 to 2035) |
|---|---|
| Italy | 3.8% |
The growing demand for water-efficient irrigation solutions and increased infrastructure for water recycling in Spain support the adoption of centrifugal and submersible pumps. Interest in solar-powered submersible pumps is growing in rural areas. The two-channel approach is still prevalent, where crops cooperatives and municipal contractors procure pump systems in large quantities of different power ranges.
| Country | CAGR (2025 to 2035) |
|---|---|
| Spain | 3.8% |
Groundwater management and flood control are high on The Netherlands' agenda and therefore axial and mixed flow pumps continue to have good demand. Sustainability policies are driving more interest from the commercial sector for HVAC automation and energy-saving circulator pumps. In urban building retrofits, compact, intelligent pump systems using controllers are in frequent use.
| Country | CAGR (2025 to 2035) |
|---|---|
| Netherlands | 3.9% |
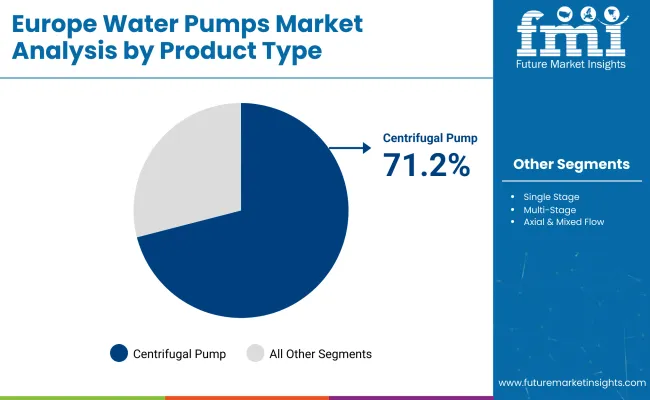
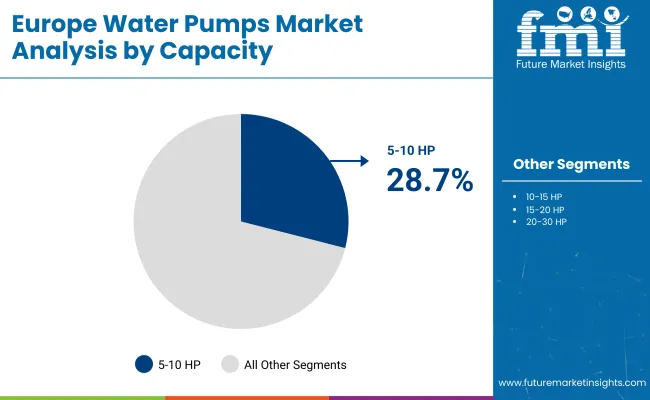
Europe water pumps market is Segmented by Capacity as -Upto 2 HP, 2-5 HP, 5-10 HP, 10-15 HP, 15-20 HP, 20-30 HP, and Above 30 HP and by product type as-centrifugal pump (single stage, multi-stage, axial & mixed flow, submersible, circulator) and positive displacement. Due to their wide operating range, ease of maintenance and applicability to different pressure requirements, centrifugal pumps are still the pump of choice.

| Product Type Segment | Market Share (2025) |
|---|---|
| Centrifugal Pumps | 71.2% |
Centrifugal pumps are expected to hold 71.2% of the market by 2025. Single-stage centrifugal pumps have wide applications in both domestic and agricultural water supply; submersible and circulator variants are important in municipal drainage, water treatment, and HVAC. The growth in adoption of high efficiency pumps to comply with EU Eco-design specifications still influence products.

| Capacity Segment | Market Share (2025) |
|---|---|
| 5-10 HP | 28.7% |
In 2025, 5-10 HP pumps are anticipated to dominate with a share of 28.7%. For these reasons, both a private and commercial solution makes them the most flexible choice as they can potentially provide heating to farms, multi-family housing, and mid-size buildings. Such pumps provide a compromise between energy efficiency and performance and initial purchase cost, which is especially relevant for budget-focussed buyers in southern and Eastern Europe.
The water pumps market in Europe is consolidated moderately with the key players working towards energy efficiency, smart pump systems, and multi-use applications. To make pumping better and lower lifecycle costs, firms are thinking outside the box in motor design, flow dynamics and IoT integration. It also highlights adherence to EU environmental standards. Achieving comprehensive market coverage across residential, municipal and industrial sectors through strategic partnerships with local distributors, real estate developers and government projects.
Market Share Analysis by Key Players
| Company Name | Estimated Market Share (%) |
|---|---|
| Grundfos Holding A/S | 18-21% |
| Wilo SE | 14-17% |
| KSB SE & Co. KGaA | 13-16% |
| Xylem Inc. | 10-13% |
| Others | 33-38% |
| Company Name | Key Offerings/Activities |
|---|---|
| Grundfos Holding A/S | In 2025 , launched Smart Adapt circulator pumps with AI-assisted control for variable load operations in HVAC networks. |
| Wilo SE | In 2024 , introduced Stratos GIGA 2.0 high-efficiency inline pumps targeting district energy and commercial buildings. |
| KSB SE & Co. KGaA | In 2025 , expanded its Etanorm series with IE5 motors, addressing industrial cooling and wastewater demands. |
| Xylem Inc. | In 2024 , enhanced Flygt submersible pumps with smart fault detection and real-time performance monitoring. |
Key Market Insights
Grundfos Holding A/S (18-21%)
Grundfos remains the market leader through its commitment to energy efficiency, smart monitoring, and wide pump compatibility. Its residential and commercial product lines dominate building services, while its sustainable innovation strategy aligns with EU climate goals.
Wilo SE (14-17%)
Wilo excels in the circulator and pressure boosting segment. Its investments in digital twin technology and predictive maintenance solutions give it an edge in commercial and smart city applications across Germany, France, and Benelux countries.
KSB SE & Co. KGaA (13-16%)
KSB's focus on high-efficiency industrial and municipal pumping systems supports its position in water infrastructure and wastewater treatment projects. The company’s advanced motor-pump integration solutions are increasingly in demand across southern and central Europe.
Xylem Inc. (10-13%)
Xylem offers technologically advanced pumps with cloud-based monitoring capabilities. The company is a key supplier for public utilities and has strong participation in climate-resilient water infrastructure projects throughout Western Europe.
Other Key Players (33-38% Combined)
The market size in 2025 was USD 76,730.6 million.
It is projected to reach USD 117,003.2 million by 2035.
The growing investments in requirements of refurbishment of water infrastructure and fluid handling systems will drive the demand for the water pumps market in Europe.
The top contributors contributing to the water pumps market in Europe are Germany, France, Italy, United Kingdom, and Spain.
The centrifugal pumps segment is anticipated to dominate due to its widespread use in municipal water supply, wastewater treatment, and various industrial fluid handling operations.


Our Research Products

The "Full Research Suite" delivers actionable market intel, deep dives on markets or technologies, so clients act faster, cut risk, and unlock growth.

The Leaderboard benchmarks and ranks top vendors, classifying them as Established Leaders, Leading Challengers, or Disruptors & Challengers.

Locates where complements amplify value and substitutes erode it, forecasting net impact by horizon

We deliver granular, decision-grade intel: market sizing, 5-year forecasts, pricing, adoption, usage, revenue, and operational KPIs—plus competitor tracking, regulation, and value chains—across 60 countries broadly.

Spot the shifts before they hit your P&L. We track inflection points, adoption curves, pricing moves, and ecosystem plays to show where demand is heading, why it is changing, and what to do next across high-growth markets and disruptive tech

Real-time reads of user behavior. We track shifting priorities, perceptions of today’s and next-gen services, and provider experience, then pace how fast tech moves from trial to adoption, blending buyer, consumer, and channel inputs with social signals (#WhySwitch, #UX).

Partner with our analyst team to build a custom report designed around your business priorities. From analysing market trends to assessing competitors or crafting bespoke datasets, we tailor insights to your needs.
Supplier Intelligence
Discovery & Profiling
Capacity & Footprint
Performance & Risk
Compliance & Governance
Commercial Readiness
Who Supplies Whom
Scorecards & Shortlists
Playbooks & Docs
Category Intelligence
Definition & Scope
Demand & Use Cases
Cost Drivers
Market Structure
Supply Chain Map
Trade & Policy
Operating Norms
Deliverables
Buyer Intelligence
Account Basics
Spend & Scope
Procurement Model
Vendor Requirements
Terms & Policies
Entry Strategy
Pain Points & Triggers
Outputs
Pricing Analysis
Benchmarks
Trends
Should-Cost
Indexation
Landed Cost
Commercial Terms
Deliverables
Brand Analysis
Positioning & Value Prop
Share & Presence
Customer Evidence
Go-to-Market
Digital & Reputation
Compliance & Trust
KPIs & Gaps
Outputs
Full Research Suite comprises of:
Market outlook & trends analysis
Interviews & case studies
Strategic recommendations
Vendor profiles & capabilities analysis
5-year forecasts
8 regions and 60+ country-level data splits
Market segment data splits
12 months of continuous data updates
DELIVERED AS:
PDF EXCEL ONLINE
Sea Water Pumps Market Growth - Trends & Forecast 2025 to 2035
Solar Water Pumps Market Size and Share Forecast Outlook 2025 to 2035
UK Sea Water Pumps Market Outlook – Share, Growth & Forecast 2025-2035
Seawater Cooling Pumps Market
USA Sea Water Pumps Market Trends – Growth, Demand & Forecast 2025-2035
Sea Water Injection Pumps Market
Japan Sea Water Pumps Market Report – Trends & Innovations 2025-2035
ASEAN Sea Water Pumps Market Analysis - Size, Demand & Forecast 2025-2035
Germany Sea Water Pumps Market Analysis - Size, Share, & Forecast Outlook 2025 to 2035
Agriculture Solar Water Pumps Market Size and Share Forecast Outlook 2025 to 2035
Water Vapor Permeability Analyzers Market Size and Share Forecast Outlook 2025 to 2035
Europe Radiotherapy Patient Positioning Market Size and Share Forecast Outlook 2025 to 2035
Water and Waste Water Treatment Chemical Market Size and Share Forecast Outlook 2025 to 2035
Water-cooled Walk-in Temperature & Humidity Chamber Market Size and Share Forecast Outlook 2025 to 2035
Waterless Bathing Solution Market Size and Share Forecast Outlook 2025 to 2035
Water Treatment System Market Size and Share Forecast Outlook 2025 to 2035
Waterborne UV Curable Resin Market Size and Share Forecast Outlook 2025 to 2035
Water Treatment Chemical Market Size and Share Forecast Outlook 2025 to 2035
Europe Polyvinyl Alcohol Industry Analysis Size and Share Forecast Outlook 2025 to 2035
Water Adventure Tourism Market Forecast and Outlook 2025 to 2035

Thank you!
You will receive an email from our Business Development Manager. Please be sure to check your SPAM/JUNK folder too.
Chat With
MaRIA