Reports

- Global Locations -

Headquarters

Future Market Insights, Inc.

Christiana Corporate, 200
Continental Drive, Suite 401,
Newark, Delaware - 19713,
United States

T: +1-347-918-3531

Americas

Future Market Insights, Inc.

616 Corporate Way, Suite 2-9018,
Valley Cottage, NY 10989, United States

MEA

Future Market Insights

1602-6 Jumeirah Bay X2 Tower, Plot No: JLT-PH2-X2A,
Jumeirah Lakes Towers, Dubai,
United Arab Emirates

Europe

Future Market Insights

3rd Floor, 207 Regent Street,
W1B 3HH London
United Kingdom

T: + 44 (0) 20 8123 9659

Asia Pacific

Future Market Insights

IndiaLand Global Tech Park, Unit UG-1, Behind Grand HighStreet, Phase 1, Hinjawadi, MH, Pune – 411057, India

Explosion-proof Motor Market Outlook from 2024 to 2034

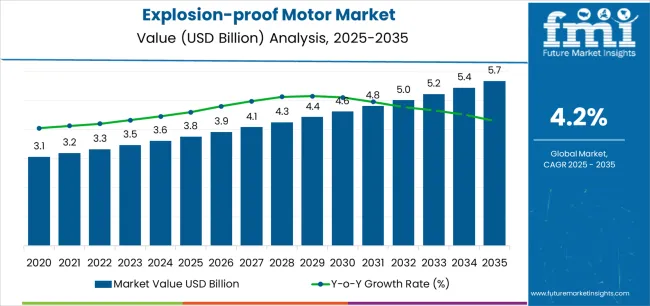
The global explosion-proof motor market size reached US$ 3,450.4 million in 2023. Over the forecast period 2024 to 2034, explosion-proof motor demand is anticipated to rise at 4.4% CAGR. Total market value is predicted to increase from US$ 3,602.2 million in 2024 to US$ 5,540.8 million in 2034.

Demand for explosion-proof motors is projected to remain high in the oil & gas industry. The latest explosion-proof motor market analysis shows that the oil and gas segment is projected to thrive at 4.9% CAGR during the assessment period.

Attributes Key Insights
Explosion-proof Motor Market Anticipated Size (2023A) US$ 3,450.4 million
Estimated Explosion-proof Motor Market Value (2024E) US$ 3,602.2 million
Projected Explosion-proof Motor Market Size (2034F) US$ 5,540.8 million
Value-based Explosion-proof Motor Market CAGR (2024 to 2034) 4.4%

Don't pay for what you don't need

Customize your report by selecting specific countries or regions and save 30%!

Explosion-proof Motor Market Trends

  • Explosion-proof motors are anticipated to be crucial in industries such as oil & gas, chemicals, mining, and manufacturing.
  • Presence of flammable substances in the aforementioned industries requires equipment that ensures operational safety and compliance with stringent safety regulations.
  • One notable trend shaping the explosion-proof motor market is the integration of the Internet of Things (IoT) and cloud-based solutions.
  • The trend involves incorporating smart technologies into explosion-proof pumps, allowing real-time data collection, analysis, and remote monitoring.
  • Integration of IoT enhances the efficiency and accessibility of motor operation data, facilitating predictive maintenance and timely responses to potential issues.
  • The trend aligns with the broad industrial shift toward smart technologies.
  • It provides a holistic approach to safety, efficiency, and data-driven decision-making in hazardous environments.

Key Factors Pushing Explosion-proof Motor Sales

  • Demand for explosion-proof motors is linked to the ever-tightening grip of safety standards and regulations across industries susceptible to hazardous environments.
  • As a response to the imperative of ensuring workplace safety, stringent guidelines are compelling firms to invest in equipment capable of withstanding dangerous conditions.
  • Explosion-proof motors, engineered to operate securely in volatile settings, have emerged as indispensable solutions.
  • Industries navigating hazardous environments, such as petrochemical, pharmaceutical, and chemical sectors, are witnessing a notable uptick in the adoption of explosion-proof motors.
  • Novel motors not only align with regulatory requirements but also provide a proactive approach to safeguarding personnel and assets.
  • Growing nexus between elevated safety expectations and increasing demand for explosion-proof vacuum pumps underscore a pivotal shift toward prioritizing workplace safety in high-risk settings.
Nikhil Kaitwade
Nikhil Kaitwade

Principal Consultant

Talk to Analyst

Find your sweet spots for generating winning opportunities in this market.

Key Explosion-proof Motor Market Highlights

Market to Expand around 1.5X through 2034

  • The global explosion-proof motor market is predicted to expand around 1.5X through 2034, amid a 2.1% increase in expected CAGR compared to the historical one.
  • Driving forces behind this optimistic outlook include increased industrialization, where burgeoning global industrial activities contribute to a heightened demand for explosion-proof motors. Demand is especially high in sectors like oil & gas, chemicals, and mining.
  • Stringent safety regulations, technological advancements, infrastructure development, and awareness of workplace safety contribute to the market's positive trajectory.
  • As industries prioritize safety and regulatory compliance, demand for submersible explosion-proof dewatering pumps is expected to remain robust, fostering a continuous expansion of the market through 2034.
  • Staying abreast of evolving market trends and technological innovations is expected to be crucial for stakeholders navigating this dynamic landscape. By 2034, the total market revenue is set to reach US$ 5,540.8 million.

East Asia Takes the Lead in the Explosion-proof Motor Market

  • East Asia is expected to retain its dominance in the field of explosion-proof motors during the forecast period. It is set to hold around 31.2% of the global explosion-proof motor market share in 2034.
  • East Asia’s dominance can be attributed to a confluence of factors propelling the region's growth, which includes robust industrial expansion.
  • China is the world's second-largest consumer of oil & gas and the sixth-largest producer of oil & gas globally.
  • China’s energy industry is dominated by state-owned oil & gas companies.
  • They are constantly developing the country's domestic reserves, building & operating pipelines, and managing and filling the strategic petroleum reserves (SPR).
  • Ongoing infrastructure development initiatives are likely to fuel demand for explosion-proof motors across sectors such as manufacturing, chemicals, and electronics.
  • East Asia’s commitment to stringent safety regulations and a focus on technological advancements are expected to result in the development of cutting-edge explosion-proof motor solutions.

Explosion-proof AC Motors to Gain Traction Globally

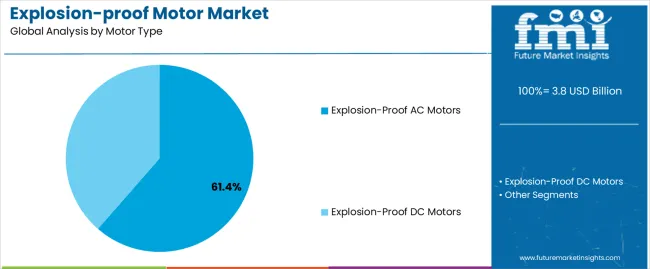
  • Explosion-proof AC motors are expected to dominate the global explosion-proof motor market in 2024. They are anticipated to witness a 5.3% CAGR during the forecast period.
  • AC motors, particularly induction motors, are favored for their robust performance, reliability, and versatility.
  • Their efficient and straightforward design, coupled with ease of maintenance, makes them suitable for several industries requiring explosion-proof solutions.
  • The dominance of AC motors can be attributed to their ability to handle high torque loads, operate seamlessly in diverse environments, and comply with stringent safety regulations.
  • Advancements in AC motor technology have enhanced their energy efficiency, contributing to their widespread adoption.
  • Industries are likely to prioritize safety and seek reliable motor solutions for hazardous environments.
  • Popularity of AC motors to operate explosion-proof electric vertical spindle sump pumps highlights their key role in ensuring operational safety across multiple sectors.

2019 to 2023 Explosion-proof Motor Market Outlook Vs. 2024 to 2034 Forecast

Global sales of explosion-proof submersible sump pumps grew at a CAGR of 2.4% between 2019 and 2023. Total market revenue reached about US$ 3,450.4 million in 2023. In the forecast period, the worldwide explosion-proof motors industry is set to thrive at a CAGR of 4.4%.

Historical CAGR (2019 to 2023) 2.3%
Forecast CAGR (2024 to 2034) 4.4%
  • Between 2019 and 2023, the global explosion-proof motor market faced slow growth due to economic uncertainties and disruptions caused by the COVID-19 pandemic.
  • It impacted industrial activities and investment decisions worldwide.
  • The onset of the COVID-19 pandemic led to several factors contributing to the slow growth of the global explosion-proof motor market between 2019 and 2023.
  • Widespread lockdowns and restrictions disrupted manufacturing & supply chain operations, causing delays and shortages in production.

Future Scope of the Explosion-proof Motor Market

  • Over the forecast period, the global explosion-proof motor market is poised to exhibit healthy growth, totaling a valuation of US$ 5,540.8 million by 2034.
  • Increasing industrialization across diverse sectors, coupled with stringent safety regulations necessitating the use of explosion-proof equipment, propels growth.
  • Growing awareness of workplace safety and rising incorporation of advanced technologies, including IoT and sensor systems, contribute to the surging adoption.
  • As industries continue to embrace automation for enhanced efficiency and productivity, demand for explosion-proof motors is likely to expand.
  • Companies are estimated to adopt innovative motors to ensure safe and secure operations in critical manufacturing processes.

Get the data you need at a Fraction of the cost

Personalize your report by choosing insights you need
and save 40%!

Key Explosion-proof Motor Market Dynamics

  • Oil and Gas Exploration Drives Demand for Explosion-Proof Motors

Stainless steel flame-proof pumps are becoming increasingly popular as a result of the continuous growth of the oil & gas exploration sector. These motors are critical parts that are designed to function safely in dangerous conditions.

Exploration efforts are stepping into more difficult environments as the world's energy needs rise. Hence, specific equipment that can endure harsh circumstances is needed in order to prioritize safety and maintain operational continuity.

In the oil & gas sector, where combustible gases and volatile substances are omnipresent, explosion-proof motors play a pivotal role. These meticulously designed motors are crafted to withstand and prevent the ignition of flammable materials. These can also help in safeguarding operations on offshore platforms and remote onshore sites alike.

Ongoing technological advancements are enhancing the efficiency and durability of these motors, strengthening their essential status across the industry. These motors play a critical role in sustaining global energy exploration efforts. This is mainly due to the symbiotic relationship between the oil & gas exploration sector and escalating demand for explosion-proof motors.

Through innovation and safety-focused engineering, flameproof motors are not only meeting but exceeding the stringent demands of the modern energy landscape. They are expected to help in ensuring the continued progress and safety of exploration endeavors worldwide.

  • Industrial Automation Sparks Sales of Explosion-proof Motors

Explosion-proof motor demand is rising due to the new wave of industrial automation. It is making these motors essential to vital manufacturing processes.

Robust and safety-compliant equipment has become essential as companies adopt automation to improve efficiency and precision. At the forefront of this technological evolution are explosion-proof motors. These are made to function in dangerous conditions and guarantee both the dependability and security of automated processes.

In the landscape of modern manufacturing, where intricate machinery and automated systems dominate, explosion-proof motors play a pivotal role. These motors are tailored to withstand potentially explosive atmospheres. These are likely to offer a secure operational environment in facilities where the risk of combustion is inherent.

As industries strive to optimize their production capabilities through automation, demand for explosion-proof motors continues to soar. The synergy between rising industrial automation and the proliferation of explosion-proof motors extends beyond mere functionality.

It represents a paradigm shift toward a safe and more efficient industrial landscape. These motors, equipped with cutting-edge technologies, help meet the rigorous demands of automated manufacturing. At the same time, these contribute to the overarching goal of creating smarter, safer, and more sustainable industrial processes. Surging explosion-proof motor demand is emblematic of a progressive era where automation and safety converge for the advancement of critical manufacturing operations.

Key Factors Restraining Explosion-proof Motor Market Growth

Evolution of Alternative Technologies Challenges Explosion-proof Motor Adoption

  • Ongoing evolution of alternative technologies, notably non-incendive systems, acts as a significant constraint in the explosion-proof motor market.
  • Industries seeking cost-effective and efficient solutions are increasingly drawn toward alternatives. They are diverting attention and investment away from traditional explosion-proof motor adoption.
  • Non-incendive systems present an attractive proposition, potentially sidelining conventional explosion-proof transfer pumps. These systems can minimize the risk of ignition in hazardous environments without the need for explosion-proof enclosures
  • Shifting preference is fueled by considerations of both cost and operational efficiency.
  • Non-incendive systems often offer a more economical choice, challenging the position of explosion-proof motors that involve high initial investments.
  • Industries are expected to prioritize innovation and explore advanced technologies to meet safety requirements.
  • The competition from evolving alternatives becomes a formidable restraint, impacting the explosion-proof motor market.

Comparative View of Adjacent Explosion-proof Motor Markets

The global explosion-proof motor market is expected to be influenced by related markets in the industrial automation domain, such as the electric motor market and large synchronous motor market. Analyzing these industries can provide valuable insights for developing strategies to drive growth and opportunities in the explosion-proof motor market.

Analysis of these related industries can also provide deeper insights that would help develop unique differentiating strategies to pursue growth and opportunity in the explosion-proof motor market. For instance, high usage of explosion-proof motors in several applications is set to eventually create growth prospects for explosion-proof motor manufacturers.

Explosion-proof Motor Market:

Attributes Explosion-proof Motor Market/ Explosion-proof Equipment Market
CAGR (2024 to 2034) 4.4%
Growth Factor Increasing focus on industrial safety and regulatory compliance is likely to push demand for explosion-proof motors.
Key Trend Advancements in IoT integration and Industry 4.0, coupled with rising adoption of customized solutions, define the evolution of the explosion-proof motor market.

Electric Motor Market:

Attributes Electric Motor Market
CAGR (2024 to 2034) 6.6%
Growth Factor Rising adoption of electric motors in the industrial and automobile sectors is expected to bolster growth.
Key Trend Manufacturers are integrating automation and robotics into their electric motors with rising investments of industries in the development of massive production plants.

Large Synchronous Motor Market:

Attributes Large Synchronous Motor Market
CAGR (2024 to 2034) 5.5%
Growth Factor Growing demand for large synchronous motors in the petrochemical & chemical and water treatment industries is likely to aid sales.
Key Trend Key companies are set to develop energy-efficient large synchronous motors and invest in research & development activities to gain a competitive edge.

Country-wise Insights

The table below highlights explosion-proof motor market revenues of several countries. China, the United States, India, and Germany are expected to remain the key customers of explosion-proof motors, with expected valuations of US$ 888.6 million, US$ 810.8 million, US$ 451.8 million, and US$ 423.2 million, respectively, in 2034.

Countries Explosion-proof Motor Market Revenue (2034)
China US$ 888.6 million
United States US$ 810.8 million
India US$ 451.8 million
Germany US$ 423.2 million
Japan US$ 335.4 million
United Kingdom US$ 228.4 million

The table below shows the estimated growth rates of several countries. India, China, and the United States are set to record considerable CAGRs of 4.1%, 3.4%, and 2.7%, respectively, through 2034.

Countries Projected Explosion-proof Motor Market CAGR (2024 to 2034)
India 4.1%
China 3.4%
United States 2.7%
Japan 2.1%
Germany 1.7%
United Kingdom 1.4%

Exploration Activities in the United States Push Hazardous Location Motor Demand

The United States explosion-proof motor market is projected to soar at a CAGR of around 2.7% during the assessment period. Total valuation in the country is anticipated to reach US$ 810.8 million by 2034.

  • Growing emphasis on industrial automation to enhance operational efficiency and precision fuels the need for explosion-proof motors.
  • Newly developed motors play a crucial role in maintaining a secure operational environment in automated processes.
  • Continuous evolution of the energy landscape amid increased exploration activities in challenging terrains intensifies the reliance on explosion-proof motors. They help to operate reliably in potentially explosive atmospheres.
  • The nation is constantly moving toward modernization and technological innovation.
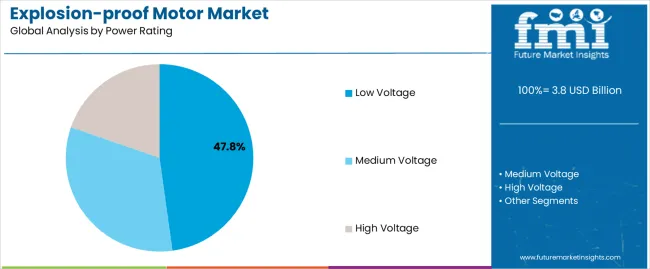
  • Demand for explosion-proof low voltage motors reflects a strategic commitment to safety compliance and seamless integration of advanced technologies across industries.

China Witnesses High Demand for Explosion-proof Blower Motors

China’s explosion-proof motor market size is projected to reach US$ 888.6 million by 2034. Over the forecast period, demand for explosion-proof motors in the country is set to rise at 3.4% CAGR.

  • China's explosion-proof motor market is thriving, propelled by rapid industrialization and a booming manufacturing sector.
  • The nation's relentless drive for economic growth has led to an increasing demand for explosion-proof transfer pumps in diverse industries.
  • As China continues its robust industrial expansion, the need for safety-compliant equipment in hazardous environments becomes paramount.
  • Explosion-proof motors play a significant role in ensuring secure operations amid the dynamic landscape of the country's manufacturing boom.
  • Explosion-proof diaphragm pumps help in aligning with stringent safety standards while facilitating sustained industrial growth.

Safety Concerns in India Fuel Demand for Explosion-proof Enclosures

India’s explosion-proof motor market is poised to exhibit a CAGR of 4.1% during the estimated period. It is expected to attain a market valuation of US$ 451.8 million by 2034.

  • As India undergoes rapid industrialization, there is an escalating need for safety-compliant equipment like explosion-proof exhaust.
  • Explosion-proof motors, designed to operate reliably in potentially explosive atmospheres, are becoming indispensable in ensuring workplace safety.
  • Growing awareness of safety standards and emphasis on workplace well-being are driving demand for explosion-proof motors in India.

Category-wise Insights

The section below shows the explosion-proof AC motor segment dominating based on motor type. It is anticipated to thrive at 5.3% CAGR between 2024 and 2034.

Based on end-use, the oil and gas segment is anticipated to hold a leading share in 2034. It is set to exhibit a CAGR of 4.9% during the forecast period.

Explosion-proof AC Gear Pumps to Showcase High Demand

Top Segment (Motor Type) Explosion-proof AC Motor
Predicted CAGR (2024 to 2034) 5.3%
  • In terms of motor type, the AC motor segment is projected to witness a 5.3% CAGR from 2024 to 2034.
  • Inherent advantages that AC motors offer in hazardous environments are likely to drive their demand.
  • AC motors are renowned for their reliability, efficiency, and adaptability to multiple industrial applications.
  • Their properties are set to make them the preferred choice in sectors susceptible to explosive atmospheres.
  • Versatility of AC explosion-proof centrifugal fans enables them to operate seamlessly across a spectrum of industries, including oil & gas, chemicals, and manufacturing.
  • Their ability to provide consistent performance in diverse conditions positions AC motors as the go-to solution for explosion-proof requirements.
  • As industries prioritize safety and compliance, the dominance of AC motors in the explosion-proof motor market underscores their resilience.

Oil and Gas Industry to Look for Explosion-proof DC Motors

Top Segment (End-use) Oil and Gas
Projected CAGR (2024 to 2034) 4.9%
  • Demand for explosion-proof motors in the oil & gas industry continues to remain high due to several compelling reasons.
  • The nature of oil & gas exploration and production involves operations in potentially explosive atmospheres.
  • It often necessitates the use of equipment specifically designed to mitigate ignition risks.
  • Explosion-proof axial flow fans are engineered with robust features to ensure safe operation in these hazardous environments, making them an essential component.
  • Global reliance on oil & gas as primary energy sources sustains the industry's continuous growth and exploration activities.
  • Need for reliable and safety-compliant equipment like explosion-proof motors becomes paramount.
  • It is attributed to increasing exploration of oil & gas across challenging terrains and offshore locations.

Competitive Landscape

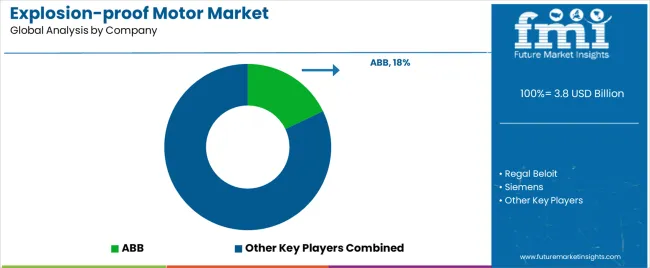
The global explosion-proof motor market is consolidated, with leading players accounting for about 40% to 45% share. ABB Group, Regal Beloit, Siemens, Auma GmbH, Emerson Electric Co., Rotork plc, Exlar Corp., Nidec, and Toshiba are the leading manufacturers and suppliers of explosion-proof motors listed in the report.

Key explosion-proof motor manufacturers are investing huge sums in research & development activities to come up with innovative products. They are also focusing on expanding their production lines by building new hubs in emerging countries. A handful of companies are aiming to strengthen their position by engaging in mergers, collaborations, and acquisitions.

Recent Developments in Explosion-proof Motor Market

  • In August 2022, BEN BUCHELE Elektromotorenwerke its new dKD280. It can be utilized across those industries that have an explosive gas atmosphere. The product can power radial and axial fans for air conditioning & ventilation, hydraulic power units, mooring winches, and pumps.
  • In December 2022, Kollmorgen, a renowned motion control system manufacturer, declared that its explosion-proof Goldline EBH 480 Vac servo motor bagged IECEx/cETLus listing and ATEX certification. The approvals will enable the company to cater to the growing demand from end-users and offer in-motion control features.
  • In August 2021, Bodine Electric Company launched four new motors and 40 innovative BLDC and explosion-proof AC gear motors. These can be used across industries that constantly operate in environments with toxic liquids, flammable vapors, or gases.

Key Coverage in the Explosion-proof Motor Market Report

  • Explosion-proof Motor Classification Chart
  • Explosion-proof Motor Enclosure, IP Rating, Code, and Starter
  • High-Quality Explosion-Proof Motors & Generators Manufacturers like OME Motors, ABB, Gamak, and Crompton
  • Price List of Ex Motors and Electric Motors for Explosive Atmospheres
  • Insights into Explosion Proof Motor Vs. TEFC
  • Explosion-proof Electric Motors Manufacturers in Canada
  • In-depth Information about Adjacent Markets, including Hazardous Location Motors and Flame Proof Induction Motors

Scope of the Explosion-proof Motor Market Research Report

Attribute Details
Estimated Market Size (2024) US$ 3,602.2 million
Projected Market Size (2034) US$ 5,540.8 million
Anticipated Growth Rate (2024 to 2034) 4.4%
Historical Data 2019 to 2023
Forecast Period 2024 to 2034
Quantitative Units Value (US$ million) and Volume (units)
Report Coverage Revenue Forecast, Volume Forecast, Company Ranking, Competitive Landscape, Growth Factors, Trends, and Pricing Analysis
Market Segments Covered
  • Motor Type
  • Power Rating
  • Phase
  • Application
  • End-use
  • Region
Regions Covered
  • North America
  • Latin America
  • Eastern Europe
  • Western Europe
  • East Asia
  • South Asia Pacific
  • Middle East Africa
Key Countries Covered
  • United States
  • Canada
  • Mexico
  • Brazil
  • Germany
  • Italy
  • France
  • United Kingdom
  • Spain
  • BENELUX
  • NORDICS
  • Poland
  • Hungary
  • Balkan and Baltics
  • Russia
  • India
  • Association of Southeast Asian Nations
  • Australia and New Zealand
  • China
  • Japan
  • South Korea
  • Kingdom of Saudi Arabia
  • Other GCC Countries
  • Türkiye
  • Other African Union
  • South Africa
Key Companies Profiled
  • ABB
  • Regal Beloit
  • Siemens
  • Auma Gmbh
  • Emerson Electric Co.
  • Rotork plc
  • Exlar Corp
  • Nidec
  • Toshiba
  • WEG
  • Welco
  • Bernard Controls
  • Schneider Electric
  • Nanyang Explosion Protection
  • Jiamusi Electric Machine
  • Xianda Explosion-proof
  • Dazhong Electric Motor
  • General Electric
  • Rockwell Automation
  • Marathon
  • Leeson

Explosion-proof Motor Market Segmentation

By Motor Type:

  • Explosion-proof AC Motors
  • Explosion-proof DC Motors

By Power Rating:

  • Low Voltage
  • Medium Voltage
  • High Voltage

By Phase:

  • Single Phase
  • Three Phase

By Application:

  • Class I
  • Class II
  • Class III

By End-use:

  • Oil and Gas
  • Chemicals and Petrochemicals
  • Metals and Mining
  • Others

By Region:

  • North America
  • Latin America
  • Eastern Europe
  • Western Europe
  • East Asia
  • South Asia Pacific
  • Middle East Africa

Frequently Asked Questions

What was the global explosion-proof motor market value in 2024?

The global market was valued at US$ 3,602.2 million in 2024.

At what rate will the explosion-proof motor market rise through 2034?

The explosion-proof motor market is anticipated to rise at 4.4% CAGR.

What is the expected explosion-proof motor market size in 2034?

The explosion-proof motor market is set to reach US$ 5,540.8 million by 2034.

Which end-use segment is expected to lead the market?

Oil and gas is expected to lead the market during the forecast period.

Who are the leading players in the explosion-proof motor market?

ABB Group, Regal Beloit, Siemens, Auma GmbH, and Emerson Electric Co.

What class of motors are explosion-proof?

Class 1 and division 1 motors are explosion-proof.

Where are explosion-proof motors used?

Oil & gas, chemicals & petrochemicals, and metals & mining industries.

Table of Content

1. Executive Summary

    1.1. Global Market Outlook

    1.2. Demand Side Trends

    1.3. Supply Side Trends

    1.4. Analysis and Recommendations

2. Market Overview

    2.1. Market Coverage / Taxonomy

    2.2. Market Definition / Scope / Limitations

3. Key Market Trends

    3.1. Key Trends Impacting the Market

    3.2. Product Innovation / Development Trends

4. Key Success Factors

    4.1. Product Adoption / Usage Analysis

    4.2. Product USPs / Features

    4.3. Strategic Promotional Strategies

5. Global Market Demand Analysis 2019 to 2023 and Forecast, 2024 to 2034

    5.1. Historical Market Volume (Units) Analysis, 2019 to 2023

    5.2. Current and Future Market Volume (Units) Projections, 2024 to 2034

    5.3. Y-o-Y Growth Trend Analysis

6. Global Market - Pricing Analysis

    6.1. Regional Pricing Analysis By Motor Type

    6.2. Global Average Pricing Analysis Benchmark

7. Global Market Demand (in Value or Size in US$ million) Analysis 2019 to 2023 and Forecast, 2024 to 2034

    7.1. Historical Market Value (US$ million) Analysis, 2019 to 2023

    7.2. Current and Future Market Value (US$ million) Projections, 2024 to 2034

        7.2.1. Y-o-Y Growth Trend Analysis

        7.2.2. Absolute $ Opportunity Analysis

8. Market Background

    8.1. Macro-Economic Factors

        8.1.1. Global GDP Growth Outlook

        8.1.2. Global Oil & Gas Industry Overview

        8.1.3. Manufacturing Value-Added

        8.1.4. Industry Value Added

        8.1.5. Parent Market Outlook

        8.1.6. Other Macro-Economic Factors

    8.2. Forecast Factors - Relevance & Impact

        8.2.1. Top Companies Historical Growth

        8.2.2. GDP Growth Forecast

        8.2.3. Manufacturing Industry Forecast

        8.2.4. Global Urbanization Growth Outlook

        8.2.5. End-use Industry Growth Outlook

        8.2.6. Other Forecast Factors

    8.3. Value Chain

        8.3.1. Product Manufacturers

        8.3.2. End Users

        8.3.3. Avg. Profitability Margins

    8.4. COVID-19 Crisis – Impact Assessment

        8.4.1. Current Statistics

        8.4.2. Short-Mid-Long Term Outlook

        8.4.3. Likely Rebound

    8.5. Market Dynamics

        8.5.1. Drivers

        8.5.2. Restraints

        8.5.3. Opportunity Analysis

    8.6. Patent Analysis

    8.7. PESTLE Analysis

9. Global Market Analysis 2019 to 2023 and Forecast 2024 to 2034, By Motor Type

    9.1. Introduction / Key Findings

    9.2. Historical Market Size (US$ million) and Volume Analysis By Motor Type, 2019 to 2023

    9.3. Current and Future Market Size (US$ million) and Volume Analysis and Forecast By Motor Type, 2024 to 2034

        9.3.1. Explosion-proof AC Motors

        9.3.2. Explosion-proof DC Motors

    9.4. Market Attractiveness Analysis By Motor Type

10. Global Market Analysis 2019 to 2023 and Forecast 2024 to 2034, By Power Rating

    10.1. Introduction / Key Findings

    10.2. Historical Market Size (US$ million) and Volume Analysis By Power Rating, 2019 to 2023

    10.3. Current and Future Market Size (US$ million) and Volume Analysis and Forecast By Power Rating, 2024 to 2034

        10.3.1. Low Voltage

        10.3.2. Medium Voltage

        10.3.3. High Voltage

    10.4. Market Attractiveness Analysis By Power Rating

11. Global Market Analysis 2019 to 2023 and Forecast 2024 to 2034, By Phase

    11.1. Introduction / Key Findings

    11.2. Historical Market Size (US$ million) and Volume Analysis By Phase, 2019 to 2023

    11.3. Current and Future Market Size (US$ million) and Volume Analysis and Forecast By Phase, 2024 to 2034

        11.3.1. Single Phase

        11.3.2. Three Phase

    11.4. Market Attractiveness Analysis By Phase

12. Global Market Analysis 2019 to 2023 and Forecast 2024 to 2034, By Application

    12.1. Introduction / Key Findings

    12.2. Historical Market Size (US$ million) and Volume Analysis By Application, 2019 to 2023

    12.3. Current and Future Market Size (US$ million) and Volume Analysis and Forecast By Application, 2024 to 2034

        12.3.1. Class I

        12.3.2. Class II

        12.3.3. Class III

    12.4. Market Attractiveness Analysis By Application

13. Global Market Analysis 2019 to 2023 and Forecast 2024 to 2034, By End-use

    13.1. Introduction / Key Findings

    13.2. Historical Market Size (US$ million) and Volume Analysis By End-use, 2019 to 2023

    13.3. Current and Future Market Size (US$ million) and Volume Analysis and Forecast By End-use, 2024 to 2034

        13.3.1. Oil and Gas

        13.3.2. Chemicals and Petrochemicals

        13.3.3. Metals and Mining

        13.3.4. Others

    13.4. Market Attractiveness Analysis By End-use

14. Global Market Analysis 2019 to 2023 and Forecast 2024 to 2034, by Region

    14.1. Introduction

    14.2. Historical Market Size (US$ million) and Volume Analysis By Region, 2019 to 2023

    14.3. Current Market Size (US$ million) and Volume Analysis and Forecast By Region, 2024 to 2034

        14.3.1. North America

        14.3.2. Latin America

        14.3.3. East Asia

        14.3.4. South Asia Pacific

        14.3.5. Western Europe

        14.3.6. Eastern Europe

        14.3.7. Middle East and Africa

    14.4. Market Attractiveness Analysis By Region

15. North America Market Analysis 2019 to 2023 and Forecast 2024 to 2034

    15.1. Introduction

    15.2. Pricing Analysis

    15.3. Historical Market Size (US$ million) and Volume Trend Analysis By Market Taxonomy, 2019 to 2023

    15.4. Market Size (US$ million) and Volume Forecast By Market Taxonomy, 2024 to 2034

        15.4.1. By Country

            15.4.1.1. United States

            15.4.1.2. Canada

            15.4.1.3. Mexico

        15.4.2. By Motor Type

        15.4.3. By Power Rating

        15.4.4. By Phase

        15.4.5. By Application

        15.4.6. By End-use

    15.5. Market Attractiveness Analysis

        15.5.1. By Country

        15.5.2. By Motor Type

        15.5.3. By Power Rating

        15.5.4. By Phase

        15.5.5. By Application

        15.5.6. By End-use

    15.6. Market Trends

    15.7. Key Market Participants - Intensity Mapping

    15.8. Drivers and Restraints - Impact Analysis

16. Latin America Market Analysis 2019 to 2023 and Forecast 2024 to 2034

    16.1. Introduction

    16.2. Pricing Analysis

    16.3. Historical Market Size (US$ million) and Volume Trend Analysis By Market Taxonomy, 2019 to 2023

    16.4. Market Size (US$ million) and Volume Forecast By Market Taxonomy, 2024 to 2034

        16.4.1. By Country

            16.4.1.1. Brazil

            16.4.1.2. Chile

            16.4.1.3. Rest of Latin America

        16.4.2. By Motor Type

        16.4.3. By Power Rating

        16.4.4. By Phase

        16.4.5. By Application

        16.4.6. By End-use

    16.5. Market Attractiveness Analysis

        16.5.1. By Country

        16.5.2. By Motor Type

        16.5.3. By Power Rating

        16.5.4. By Phase

        16.5.5. By Application

        16.5.6. By End-use

    16.6. Market Trends

    16.7. Key Market Participants - Intensity Mapping

    16.8. Drivers and Restraints - Impact Analysis

17. East Asia Market Analysis 2019 to 2023 and Forecast 2024 to 2034

    17.1. Introduction

    17.2. Pricing Analysis

    17.3. Historical Market Size (US$ million) and Volume Trend Analysis By Market Taxonomy, 2019 to 2023

    17.4. Market Size (US$ million) and Volume Forecast By Market Taxonomy, 2024 to 2034

        17.4.1. By Country

            17.4.1.1. China

            17.4.1.2. Japan

            17.4.1.3. South Korea

        17.4.2. By Motor Type

        17.4.3. By Power Rating

        17.4.4. By Phase

        17.4.5. By Application

        17.4.6. By End-use

    17.5. Market Attractiveness Analysis

        17.5.1. By Country

        17.5.2. By Motor Type

        17.5.3. By Power Rating

        17.5.4. By Phase

        17.5.5. By Application

        17.5.6. By End-use

    17.6. Market Trends

    17.7. Key Market Participants - Intensity Mapping

    17.8. Drivers and Restraints - Impact Analysis

18. South Asia Pacific Market Analysis 2019 to 2023 and Forecast 2024 to 2034

    18.1. Introduction

    18.2. Pricing Analysis

    18.3. Historical Market Size (US$ million) and Volume Trend Analysis By Market Taxonomy, 2019 to 2023

    18.4. Market Size (US$ million) and Volume Forecast By Market Taxonomy, 2024 to 2034

        18.4.1. By Country

            18.4.1.1. India

            18.4.1.2. ASEAN

            18.4.1.3. ANZ

            18.4.1.4. Rest of SAP

        18.4.2. By Motor Type

        18.4.3. By Power Rating

        18.4.4. By Phase

        18.4.5. By Application

        18.4.6. By End-use

    18.5. Market Attractiveness Analysis

        18.5.1. By Country

        18.5.2. By Motor Type

        18.5.3. By Power Rating

        18.5.4. By Phase

        18.5.5. By Application

        18.5.6. By End-use

    18.6. Market Trends

    18.7. Key Market Participants - Intensity Mapping

    18.8. Drivers and Restraints - Impact Analysis

19. Western Europe Market Analysis 2019 to 2023 and Forecast 2024 to 2034

    19.1. Introduction

    19.2. Pricing Analysis

    19.3. Historical Market Size (US$ million) and Volume Trend Analysis By Market Taxonomy, 2019 to 2023

    19.4. Market Size (US$ million) and Volume Forecast By Market Taxonomy, 2024 to 2034

        19.4.1. By Country

            19.4.1.1. Germany

            19.4.1.2. Italy

            19.4.1.3. France

            19.4.1.4. United Kingdom

            19.4.1.5. Spain

            19.4.1.6. BENELUX

            19.4.1.7. NORDICS

            19.4.1.8. Rest of W. Europe

        19.4.2. By Motor Type

        19.4.3. By Power Rating

        19.4.4. By Phase

        19.4.5. By Application

        19.4.6. By End-use

    19.5. Market Attractiveness Analysis

        19.5.1. By Country

        19.5.2. By Motor Type

        19.5.3. By Power Rating

        19.5.4. By Phase

        19.5.5. By Application

        19.5.6. By End-use

    19.6. Market Trends

    19.7. Key Market Participants - Intensity Mapping

    19.8. Drivers and Restraints - Impact Analysis

20. Eastern Europe Market Analysis 2019 to 2023 and Forecast 2024 to 2034

    20.1. Introduction

    20.2. Pricing Analysis

    20.3. Historical Market Size (US$ million) and Volume Trend Analysis By Market Taxonomy, 2019 to 2023

    20.4. Market Size (US$ million) and Volume Forecast By Market Taxonomy, 2024 to 2034

        20.4.1. By Country

            20.4.1.1. Russia

            20.4.1.2. Poland

            20.4.1.3. Hungary

            20.4.1.4. Balkan & Baltics

            20.4.1.5. Rest of E. Europe

        20.4.2. By Motor Type

        20.4.3. By Power Rating

        20.4.4. By Phase

        20.4.5. By Application

        20.4.6. By End-use

    20.5. Market Attractiveness Analysis

        20.5.1. By Country

        20.5.2. By Motor Type

        20.5.3. By Power Rating

        20.5.4. By Phase

        20.5.5. By Application

        20.5.6. By End-use

    20.6. Market Trends

    20.7. Key Market Participants - Intensity Mapping

    20.8. Drivers and Restraints - Impact Analysis

21. Middle East and Africa Market Analysis 2019 to 2023 and Forecast 2024 to 2034

    21.1. Introduction

    21.2. Pricing Analysis

    21.3. Historical Market Size (US$ million) and Volume Trend Analysis By Market Taxonomy, 2019 to 2023

    21.4. Market Size (US$ million) and Volume Forecast By Market Taxonomy, 2024 to 2034

        21.4.1. By Country

            21.4.1.1. KSA

            21.4.1.2. Other GCC Countries

            21.4.1.3. Türkiye

            21.4.1.4. South Africa

            21.4.1.5. Other African Union

            21.4.1.6. Rest of Middle East & Africa

        21.4.2. By Motor Type

        21.4.3. By Power Rating

        21.4.4. By Phase

        21.4.5. By Application

        21.4.6. By End-use

    21.5. Market Attractiveness Analysis

        21.5.1. By Country

        21.5.2. By Motor Type

        21.5.3. By Power Rating

        21.5.4. By Phase

        21.5.5. By Application

        21.5.6. By End-use

    21.6. Market Trends

    21.7. Key Market Participants - Intensity Mapping

    21.8. Drivers and Restraints - Impact Analysis

22. Country-wise Market Analysis

    22.1. Introduction

        22.1.1. Market Value Proportion Analysis, By Key Countries

        22.1.2. Global Vs. Country Growth Comparison

    22.2. United States Market Analysis

        22.2.1. By Motor Type

        22.2.2. By Power Rating

        22.2.3. By Phase

        22.2.4. By Application

        22.2.5. By End-use

    22.3. Canada Market Analysis

        22.3.1. By Motor Type

        22.3.2. By Power Rating

        22.3.3. By Phase

        22.3.4. By Application

        22.3.5. By End-use

    22.4. Mexico Market Analysis

        22.4.1. By Motor Type

        22.4.2. By Power Rating

        22.4.3. By Phase

        22.4.4. By Application

        22.4.5. By End-use

    22.5. Brazil Market Analysis

        22.5.1. By Motor Type

        22.5.2. By Power Rating

        22.5.3. By Phase

        22.5.4. By Application

        22.5.5. By End-use

    22.6. Chile Market Analysis

        22.6.1. By Motor Type

        22.6.2. By Power Rating

        22.6.3. By Phase

        22.6.4. By Application

        22.6.5. By End-use

    22.7. China Market Analysis

        22.7.1. By Motor Type

        22.7.2. By Power Rating

        22.7.3. By Phase

        22.7.4. By Application

        22.7.5. By End-use

    22.8. Japan Market Analysis

        22.8.1. By Motor Type

        22.8.2. By Power Rating

        22.8.3. By Phase

        22.8.4. By Application

        22.8.5. By End-use

    22.9. South Korea Market Analysis

        22.9.1. By Motor Type

        22.9.2. By Power Rating

        22.9.3. By Phase

        22.9.4. By Application

        22.9.5. By End-use

    22.10. India Market Analysis

        22.10.1. By Motor Type

        22.10.2. By Power Rating

        22.10.3. By Phase

        22.10.4. By Application

        22.10.5. By End-use

    22.11. ASEAN Market Analysis

        22.11.1. By Motor Type

        22.11.2. By Power Rating

        22.11.3. By Phase

        22.11.4. By Application

        22.11.5. By End-use

    22.12. ANZ Market Analysis

        22.12.1. By Motor Type

        22.12.2. By Power Rating

        22.12.3. By Phase

        22.12.4. By Application

        22.12.5. By End-use

    22.13. Germany Market Analysis

        22.13.1. By Motor Type

        22.13.2. By Power Rating

        22.13.3. By Phase

        22.13.4. By Application

        22.13.5. By End-use

    22.14. Italy Market Analysis

        22.14.1. By Motor Type

        22.14.2. By Power Rating

        22.14.3. By Phase

        22.14.4. By Application

        22.14.5. By End-use

    22.15. France Market Analysis

        22.15.1. By Motor Type

        22.15.2. By Power Rating

        22.15.3. By Phase

        22.15.4. By Application

        22.15.5. By End-use

    22.16. United Kingdom Market Analysis

        22.16.1. By Motor Type

        22.16.2. By Power Rating

        22.16.3. By Phase

        22.16.4. By Application

        22.16.5. By End-use

    22.17. Spain Market Analysis

        22.17.1. By Motor Type

        22.17.2. By Power Rating

        22.17.3. By Phase

        22.17.4. By Application

        22.17.5. By End-use

    22.18. BENELUX Market Analysis

        22.18.1. By Motor Type

        22.18.2. By Power Rating

        22.18.3. By Phase

        22.18.4. By Application

        22.18.5. By End-use

    22.19. NORDICS Market Analysis

        22.19.1. By Motor Type

        22.19.2. By Power Rating

        22.19.3. By Phase

        22.19.4. By Application

        22.19.5. By End-use

    22.20. Russia Market Analysis

        22.20.1. By Motor Type

        22.20.2. By Power Rating

        22.20.3. By Phase

        22.20.4. By Application

        22.20.5. By End-use

    22.21. Poland Market Analysis

        22.21.1. By Motor Type

        22.21.2. By Power Rating

        22.21.3. By Phase

        22.21.4. By Application

        22.21.5. By End-use

    22.22. Hungary Market Analysis

        22.22.1. By Motor Type

        22.22.2. By Power Rating

        22.22.3. By Phase

        22.22.4. By Application

        22.22.5. By End-use

    22.23. Balkan & Baltics Market Analysis

        22.23.1. By Motor Type

        22.23.2. By Power Rating

        22.23.3. By Phase

        22.23.4. By Application

        22.23.5. By End-use

    22.24. KSA Market Analysis

        22.24.1. By Motor Type

        22.24.2. By Power Rating

        22.24.3. By Phase

        22.24.4. By Application

        22.24.5. By End-use

    22.25. Other GCC Countries Market Analysis

        22.25.1. By Motor Type

        22.25.2. By Power Rating

        22.25.3. By Phase

        22.25.4. By Application

        22.25.5. By End-use

    22.26. Türkiye Market Analysis

        22.26.1. By Motor Type

        22.26.2. By Power Rating

        22.26.3. By Phase

        22.26.4. By Application

        22.26.5. By End-use

    22.27. South Africa Market Analysis

        22.27.1. By Motor Type

        22.27.2. By Power Rating

        22.27.3. By Phase

        22.27.4. By Application

        22.27.5. By End-use

    22.28. Other African Union Market Analysis

        22.28.1. By Motor Type

        22.28.2. By Power Rating

        22.28.3. By Phase

        22.28.4. By Application

        22.28.5. By End-use

23. Market Structure Analysis

    23.1. Market Analysis by Tier of Companies

    23.2. Market Concentration

    23.3. Market Share Analysis of Top Players

24. Competition Analysis

    24.1. Competition Dashboard

    24.2. Competition Benchmarking

    24.3. Competition Deep Dive

        24.3.1. ABB

            24.3.1.1. Overview

            24.3.1.2. Product Portfolio

            24.3.1.3. Profitability by Market Segments (Product/Channel/Region)

            24.3.1.4. Sales Footprint

            24.3.1.5. Strategy Overview

        24.3.2. Regal Beloit

        24.3.3. Siemens

        24.3.4. Auma GmbH

        24.3.5. Emerson Electric Co.

        24.3.6. Rotork plc

        24.3.7. Exlar Corp

        24.3.8. Nidec

        24.3.9. Toshiba

        24.3.10. WEG

        24.3.11. Welco

        24.3.12. Bernard Controls

        24.3.13. Schneider Electric

        24.3.14. Nanyang Explosion Protection

        24.3.15. Jiamusi Electric Machine

        24.3.16. Xianda Explosion-proof

        24.3.17. Dazhong Electric Motor

        24.3.18. General Electric

        24.3.19. Rockwell Automation

        24.3.20. Marathon

        24.3.21. Leeson

        24.3.22. Other Key Players

25. Assumptions and Acronyms Used

26. Research Methodology

List of Tables

Table 1: Global Market Value (US$ million) Forecast by Region, 2019 to 2034

Table 2: Global Market Volume (Units) Forecast by Region, 2019 to 2034

Table 3: Global Market Value (US$ million) Forecast by Motor Type, 2019 to 2034

Table 4: Global Market Volume (Units) Forecast by Motor Type, 2019 to 2034

Table 5: Global Market Value (US$ million) Forecast by Power Rating, 2019 to 2034

Table 6: Global Market Volume (Units) Forecast by Power Rating, 2019 to 2034

Table 7: Global Market Value (US$ million) Forecast by Phase, 2019 to 2034

Table 8: Global Market Volume (Units) Forecast by Phase, 2019 to 2034

Table 9: Global Market Value (US$ million) Forecast by Application, 2019 to 2034

Table 10: Global Market Volume (Units) Forecast by Application, 2019 to 2034

Table 11: Global Market Value (US$ million) Forecast by End-use, 2019 to 2034

Table 12: Global Market Volume (Units) Forecast by End-use, 2019 to 2034

Table 13: North America Market Value (US$ million) Forecast by Country, 2019 to 2034

Table 14: North America Market Volume (Units) Forecast by Country, 2019 to 2034

Table 15: North America Market Value (US$ million) Forecast by Motor Type, 2019 to 2034

Table 16: North America Market Volume (Units) Forecast by Motor Type, 2019 to 2034

Table 17: North America Market Value (US$ million) Forecast by Power Rating, 2019 to 2034

Table 18: North America Market Volume (Units) Forecast by Power Rating, 2019 to 2034

Table 19: North America Market Value (US$ million) Forecast by Phase, 2019 to 2034

Table 20: North America Market Volume (Units) Forecast by Phase, 2019 to 2034

Table 21: North America Market Value (US$ million) Forecast by Application, 2019 to 2034

Table 22: North America Market Volume (Units) Forecast by Application, 2019 to 2034

Table 23: North America Market Value (US$ million) Forecast by End-use, 2019 to 2034

Table 24: North America Market Volume (Units) Forecast by End-use, 2019 to 2034

Table 25: Latin America Market Value (US$ million) Forecast by Country, 2019 to 2034

Table 26: Latin America Market Volume (Units) Forecast by Country, 2019 to 2034

Table 27: Latin America Market Value (US$ million) Forecast by Motor Type, 2019 to 2034

Table 28: Latin America Market Volume (Units) Forecast by Motor Type, 2019 to 2034

Table 29: Latin America Market Value (US$ million) Forecast by Power Rating, 2019 to 2034

Table 30: Latin America Market Volume (Units) Forecast by Power Rating, 2019 to 2034

Table 31: Latin America Market Value (US$ million) Forecast by Phase, 2019 to 2034

Table 32: Latin America Market Volume (Units) Forecast by Phase, 2019 to 2034

Table 33: Latin America Market Value (US$ million) Forecast by Application, 2019 to 2034

Table 34: Latin America Market Volume (Units) Forecast by Application, 2019 to 2034

Table 35: Latin America Market Value (US$ million) Forecast by End-use, 2019 to 2034

Table 36: Latin America Market Volume (Units) Forecast by End-use, 2019 to 2034

Table 37: Western Europe Market Value (US$ million) Forecast by Country, 2019 to 2034

Table 38: Western Europe Market Volume (Units) Forecast by Country, 2019 to 2034

Table 39: Western Europe Market Value (US$ million) Forecast by Motor Type, 2019 to 2034

Table 40: Western Europe Market Volume (Units) Forecast by Motor Type, 2019 to 2034

Table 41: Western Europe Market Value (US$ million) Forecast by Power Rating, 2019 to 2034

Table 42: Western Europe Market Volume (Units) Forecast by Power Rating, 2019 to 2034

Table 43: Western Europe Market Value (US$ million) Forecast by Phase, 2019 to 2034

Table 44: Western Europe Market Volume (Units) Forecast by Phase, 2019 to 2034

Table 45: Western Europe Market Value (US$ million) Forecast by Application, 2019 to 2034

Table 46: Western Europe Market Volume (Units) Forecast by Application, 2019 to 2034

Table 47: Western Europe Market Value (US$ million) Forecast by End-use, 2019 to 2034

Table 48: Western Europe Market Volume (Units) Forecast by End-use, 2019 to 2034

Table 49: Eastern Europe Market Value (US$ million) Forecast by Country, 2019 to 2034

Table 50: Eastern Europe Market Volume (Units) Forecast by Country, 2019 to 2034

Table 51: Eastern Europe Market Value (US$ million) Forecast by Motor Type, 2019 to 2034

Table 52: Eastern Europe Market Volume (Units) Forecast by Motor Type, 2019 to 2034

Table 53: Eastern Europe Market Value (US$ million) Forecast by Power Rating, 2019 to 2034

Table 54: Eastern Europe Market Volume (Units) Forecast by Power Rating, 2019 to 2034

Table 55: Eastern Europe Market Value (US$ million) Forecast by Phase, 2019 to 2034

Table 56: Eastern Europe Market Volume (Units) Forecast by Phase, 2019 to 2034

Table 57: Eastern Europe Market Value (US$ million) Forecast by Application, 2019 to 2034

Table 58: Eastern Europe Market Volume (Units) Forecast by Application, 2019 to 2034

Table 59: Eastern Europe Market Value (US$ million) Forecast by End-use, 2019 to 2034

Table 60: Eastern Europe Market Volume (Units) Forecast by End-use, 2019 to 2034

Table 61: East Asia Market Value (US$ million) Forecast by Country, 2019 to 2034

Table 62: East Asia Market Volume (Units) Forecast by Country, 2019 to 2034

Table 63: East Asia Market Value (US$ million) Forecast by Motor Type, 2019 to 2034

Table 64: East Asia Market Volume (Units) Forecast by Motor Type, 2019 to 2034

Table 65: East Asia Market Value (US$ million) Forecast by Power Rating, 2019 to 2034

Table 66: East Asia Market Volume (Units) Forecast by Power Rating, 2019 to 2034

Table 67: East Asia Market Value (US$ million) Forecast by Phase, 2019 to 2034

Table 68: East Asia Market Volume (Units) Forecast by Phase, 2019 to 2034

Table 69: East Asia Market Value (US$ million) Forecast by Application, 2019 to 2034

Table 70: East Asia Market Volume (Units) Forecast by Application, 2019 to 2034

Table 71: East Asia Market Value (US$ million) Forecast by End-use, 2019 to 2034

Table 72: East Asia Market Volume (Units) Forecast by End-use, 2019 to 2034

Table 73: South Asia Pacific Market Value (US$ million) Forecast by Country, 2019 to 2034

Table 74: South Asia Pacific Market Volume (Units) Forecast by Country, 2019 to 2034

Table 75: South Asia Pacific Market Value (US$ million) Forecast by Motor Type, 2019 to 2034

Table 76: South Asia Pacific Market Volume (Units) Forecast by Motor Type, 2019 to 2034

Table 77: South Asia Pacific Market Value (US$ million) Forecast by Power Rating, 2019 to 2034

Table 78: South Asia Pacific Market Volume (Units) Forecast by Power Rating, 2019 to 2034

Table 79: South Asia Pacific Market Value (US$ million) Forecast by Phase, 2019 to 2034

Table 80: South Asia Pacific Market Volume (Units) Forecast by Phase, 2019 to 2034

Table 81: South Asia Pacific Market Value (US$ million) Forecast by Application, 2019 to 2034

Table 82: South Asia Pacific Market Volume (Units) Forecast by Application, 2019 to 2034

Table 83: South Asia Pacific Market Value (US$ million) Forecast by End-use, 2019 to 2034

Table 84: South Asia Pacific Market Volume (Units) Forecast by End-use, 2019 to 2034

Table 85: Middle East & Africa Market Value (US$ million) Forecast by Country, 2019 to 2034

Table 86: Middle East & Africa Market Volume (Units) Forecast by Country, 2019 to 2034

Table 87: Middle East & Africa Market Value (US$ million) Forecast by Motor Type, 2019 to 2034

Table 88: Middle East & Africa Market Volume (Units) Forecast by Motor Type, 2019 to 2034

Table 89: Middle East & Africa Market Value (US$ million) Forecast by Power Rating, 2019 to 2034

Table 90: Middle East & Africa Market Volume (Units) Forecast by Power Rating, 2019 to 2034

Table 91: Middle East & Africa Market Value (US$ million) Forecast by Phase, 2019 to 2034

Table 92: Middle East & Africa Market Volume (Units) Forecast by Phase, 2019 to 2034

Table 93: Middle East & Africa Market Value (US$ million) Forecast by Application, 2019 to 2034

Table 94: Middle East & Africa Market Volume (Units) Forecast by Application, 2019 to 2034

Table 95: Middle East & Africa Market Value (US$ million) Forecast by End-use, 2019 to 2034

Table 96: Middle East & Africa Market Volume (Units) Forecast by End-use, 2019 to 2034

List of Charts

Figure 1: Global Market Value (US$ million) by Motor Type, 2024 to 2034

Figure 2: Global Market Value (US$ million) by Power Rating, 2024 to 2034

Figure 3: Global Market Value (US$ million) by Phase, 2024 to 2034

Figure 4: Global Market Value (US$ million) by Application, 2024 to 2034

Figure 5: Global Market Value (US$ million) by End-use, 2024 to 2034

Figure 6: Global Market Value (US$ million) by Region, 2024 to 2034

Figure 7: Global Market Value (US$ million) Analysis by Region, 2019 to 2034

Figure 8: Global Market Volume (Units) Analysis by Region, 2019 to 2034

Figure 9: Global Market Value Share (%) and BPS Analysis by Region, 2024 to 2034

Figure 10: Global Market Y-o-Y Growth (%) Projections by Region, 2024 to 2034

Figure 11: Global Market Value (US$ million) Analysis by Motor Type, 2019 to 2034

Figure 12: Global Market Volume (Units) Analysis by Motor Type, 2019 to 2034

Figure 13: Global Market Value Share (%) and BPS Analysis by Motor Type, 2024 to 2034

Figure 14: Global Market Y-o-Y Growth (%) Projections by Motor Type, 2024 to 2034

Figure 15: Global Market Value (US$ million) Analysis by Power Rating, 2019 to 2034

Figure 16: Global Market Volume (Units) Analysis by Power Rating, 2019 to 2034

Figure 17: Global Market Value Share (%) and BPS Analysis by Power Rating, 2024 to 2034

Figure 18: Global Market Y-o-Y Growth (%) Projections by Power Rating, 2024 to 2034

Figure 19: Global Market Value (US$ million) Analysis by Phase, 2019 to 2034

Figure 20: Global Market Volume (Units) Analysis by Phase, 2019 to 2034

Figure 21: Global Market Value Share (%) and BPS Analysis by Phase, 2024 to 2034

Figure 22: Global Market Y-o-Y Growth (%) Projections by Phase, 2024 to 2034

Figure 23: Global Market Value (US$ million) Analysis by Application, 2019 to 2034

Figure 24: Global Market Volume (Units) Analysis by Application, 2019 to 2034

Figure 25: Global Market Value Share (%) and BPS Analysis by Application, 2024 to 2034

Figure 26: Global Market Y-o-Y Growth (%) Projections by Application, 2024 to 2034

Figure 27: Global Market Value (US$ million) Analysis by End-use, 2019 to 2034

Figure 28: Global Market Volume (Units) Analysis by End-use, 2019 to 2034

Figure 29: Global Market Value Share (%) and BPS Analysis by End-use, 2024 to 2034

Figure 30: Global Market Y-o-Y Growth (%) Projections by End-use, 2024 to 2034

Figure 31: Global Market Attractiveness by Motor Type, 2024 to 2034

Figure 32: Global Market Attractiveness by Power Rating, 2024 to 2034

Figure 33: Global Market Attractiveness by Phase, 2024 to 2034

Figure 34: Global Market Attractiveness by Application, 2024 to 2034

Figure 35: Global Market Attractiveness by End-use, 2024 to 2034

Figure 36: Global Market Attractiveness by Region, 2024 to 2034

Figure 37: North America Market Value (US$ million) by Motor Type, 2024 to 2034

Figure 38: North America Market Value (US$ million) by Power Rating, 2024 to 2034

Figure 39: North America Market Value (US$ million) by Phase, 2024 to 2034

Figure 40: North America Market Value (US$ million) by Application, 2024 to 2034

Figure 41: North America Market Value (US$ million) by End-use, 2024 to 2034

Figure 42: North America Market Value (US$ million) by Country, 2024 to 2034

Figure 43: North America Market Value (US$ million) Analysis by Country, 2019 to 2034

Figure 44: North America Market Volume (Units) Analysis by Country, 2019 to 2034

Figure 45: North America Market Value Share (%) and BPS Analysis by Country, 2024 to 2034

Figure 46: North America Market Y-o-Y Growth (%) Projections by Country, 2024 to 2034

Figure 47: North America Market Value (US$ million) Analysis by Motor Type, 2019 to 2034

Figure 48: North America Market Volume (Units) Analysis by Motor Type, 2019 to 2034

Figure 49: North America Market Value Share (%) and BPS Analysis by Motor Type, 2024 to 2034

Figure 50: North America Market Y-o-Y Growth (%) Projections by Motor Type, 2024 to 2034

Figure 51: North America Market Value (US$ million) Analysis by Power Rating, 2019 to 2034

Figure 52: North America Market Volume (Units) Analysis by Power Rating, 2019 to 2034

Figure 53: North America Market Value Share (%) and BPS Analysis by Power Rating, 2024 to 2034

Figure 54: North America Market Y-o-Y Growth (%) Projections by Power Rating, 2024 to 2034

Figure 55: North America Market Value (US$ million) Analysis by Phase, 2019 to 2034

Figure 56: North America Market Volume (Units) Analysis by Phase, 2019 to 2034

Figure 57: North America Market Value Share (%) and BPS Analysis by Phase, 2024 to 2034

Figure 58: North America Market Y-o-Y Growth (%) Projections by Phase, 2024 to 2034

Figure 59: North America Market Value (US$ million) Analysis by Application, 2019 to 2034

Figure 60: North America Market Volume (Units) Analysis by Application, 2019 to 2034

Figure 61: North America Market Value Share (%) and BPS Analysis by Application, 2024 to 2034

Figure 62: North America Market Y-o-Y Growth (%) Projections by Application, 2024 to 2034

Figure 63: North America Market Value (US$ million) Analysis by End-use, 2019 to 2034

Figure 64: North America Market Volume (Units) Analysis by End-use, 2019 to 2034

Figure 65: North America Market Value Share (%) and BPS Analysis by End-use, 2024 to 2034

Figure 66: North America Market Y-o-Y Growth (%) Projections by End-use, 2024 to 2034

Figure 67: North America Market Attractiveness by Motor Type, 2024 to 2034

Figure 68: North America Market Attractiveness by Power Rating, 2024 to 2034

Figure 69: North America Market Attractiveness by Phase, 2024 to 2034

Figure 70: North America Market Attractiveness by Application, 2024 to 2034

Figure 71: North America Market Attractiveness by End-use, 2024 to 2034

Figure 72: North America Market Attractiveness by Country, 2024 to 2034

Figure 73: Latin America Market Value (US$ million) by Motor Type, 2024 to 2034

Figure 74: Latin America Market Value (US$ million) by Power Rating, 2024 to 2034

Figure 75: Latin America Market Value (US$ million) by Phase, 2024 to 2034

Figure 76: Latin America Market Value (US$ million) by Application, 2024 to 2034

Figure 77: Latin America Market Value (US$ million) by End-use, 2024 to 2034

Figure 78: Latin America Market Value (US$ million) by Country, 2024 to 2034

Figure 79: Latin America Market Value (US$ million) Analysis by Country, 2019 to 2034

Figure 80: Latin America Market Volume (Units) Analysis by Country, 2019 to 2034

Figure 81: Latin America Market Value Share (%) and BPS Analysis by Country, 2024 to 2034

Figure 82: Latin America Market Y-o-Y Growth (%) Projections by Country, 2024 to 2034

Figure 83: Latin America Market Value (US$ million) Analysis by Motor Type, 2019 to 2034

Figure 84: Latin America Market Volume (Units) Analysis by Motor Type, 2019 to 2034

Figure 85: Latin America Market Value Share (%) and BPS Analysis by Motor Type, 2024 to 2034

Figure 86: Latin America Market Y-o-Y Growth (%) Projections by Motor Type, 2024 to 2034

Figure 87: Latin America Market Value (US$ million) Analysis by Power Rating, 2019 to 2034

Figure 88: Latin America Market Volume (Units) Analysis by Power Rating, 2019 to 2034

Figure 89: Latin America Market Value Share (%) and BPS Analysis by Power Rating, 2024 to 2034

Figure 90: Latin America Market Y-o-Y Growth (%) Projections by Power Rating, 2024 to 2034

Figure 91: Latin America Market Value (US$ million) Analysis by Phase, 2019 to 2034

Figure 92: Latin America Market Volume (Units) Analysis by Phase, 2019 to 2034

Figure 93: Latin America Market Value Share (%) and BPS Analysis by Phase, 2024 to 2034

Figure 94: Latin America Market Y-o-Y Growth (%) Projections by Phase, 2024 to 2034

Figure 95: Latin America Market Value (US$ million) Analysis by Application, 2019 to 2034

Figure 96: Latin America Market Volume (Units) Analysis by Application, 2019 to 2034

Figure 97: Latin America Market Value Share (%) and BPS Analysis by Application, 2024 to 2034

Figure 98: Latin America Market Y-o-Y Growth (%) Projections by Application, 2024 to 2034

Figure 99: Latin America Market Value (US$ million) Analysis by End-use, 2019 to 2034

Figure 100: Latin America Market Volume (Units) Analysis by End-use, 2019 to 2034

Figure 101: Latin America Market Value Share (%) and BPS Analysis by End-use, 2024 to 2034

Figure 102: Latin America Market Y-o-Y Growth (%) Projections by End-use, 2024 to 2034

Figure 103: Latin America Market Attractiveness by Motor Type, 2024 to 2034

Figure 104: Latin America Market Attractiveness by Power Rating, 2024 to 2034

Figure 105: Latin America Market Attractiveness by Phase, 2024 to 2034

Figure 106: Latin America Market Attractiveness by Application, 2024 to 2034

Figure 107: Latin America Market Attractiveness by End-use, 2024 to 2034

Figure 108: Latin America Market Attractiveness by Country, 2024 to 2034

Figure 109: Western Europe Market Value (US$ million) by Motor Type, 2024 to 2034

Figure 110: Western Europe Market Value (US$ million) by Power Rating, 2024 to 2034

Figure 111: Western Europe Market Value (US$ million) by Phase, 2024 to 2034

Figure 112: Western Europe Market Value (US$ million) by Application, 2024 to 2034

Figure 113: Western Europe Market Value (US$ million) by End-use, 2024 to 2034

Figure 114: Western Europe Market Value (US$ million) by Country, 2024 to 2034

Figure 115: Western Europe Market Value (US$ million) Analysis by Country, 2019 to 2034

Figure 116: Western Europe Market Volume (Units) Analysis by Country, 2019 to 2034

Figure 117: Western Europe Market Value Share (%) and BPS Analysis by Country, 2024 to 2034

Figure 118: Western Europe Market Y-o-Y Growth (%) Projections by Country, 2024 to 2034

Figure 119: Western Europe Market Value (US$ million) Analysis by Motor Type, 2019 to 2034

Figure 120: Western Europe Market Volume (Units) Analysis by Motor Type, 2019 to 2034

Figure 121: Western Europe Market Value Share (%) and BPS Analysis by Motor Type, 2024 to 2034

Figure 122: Western Europe Market Y-o-Y Growth (%) Projections by Motor Type, 2024 to 2034

Figure 123: Western Europe Market Value (US$ million) Analysis by Power Rating, 2019 to 2034

Figure 124: Western Europe Market Volume (Units) Analysis by Power Rating, 2019 to 2034

Figure 125: Western Europe Market Value Share (%) and BPS Analysis by Power Rating, 2024 to 2034

Figure 126: Western Europe Market Y-o-Y Growth (%) Projections by Power Rating, 2024 to 2034

Figure 127: Western Europe Market Value (US$ million) Analysis by Phase, 2019 to 2034

Figure 128: Western Europe Market Volume (Units) Analysis by Phase, 2019 to 2034

Figure 129: Western Europe Market Value Share (%) and BPS Analysis by Phase, 2024 to 2034

Figure 130: Western Europe Market Y-o-Y Growth (%) Projections by Phase, 2024 to 2034

Figure 131: Western Europe Market Value (US$ million) Analysis by Application, 2019 to 2034

Figure 132: Western Europe Market Volume (Units) Analysis by Application, 2019 to 2034

Figure 133: Western Europe Market Value Share (%) and BPS Analysis by Application, 2024 to 2034

Figure 134: Western Europe Market Y-o-Y Growth (%) Projections by Application, 2024 to 2034

Figure 135: Western Europe Market Value (US$ million) Analysis by End-use, 2019 to 2034

Figure 136: Western Europe Market Volume (Units) Analysis by End-use, 2019 to 2034

Figure 137: Western Europe Market Value Share (%) and BPS Analysis by End-use, 2024 to 2034

Figure 138: Western Europe Market Y-o-Y Growth (%) Projections by End-use, 2024 to 2034

Figure 139: Western Europe Market Attractiveness by Motor Type, 2024 to 2034

Figure 140: Western Europe Market Attractiveness by Power Rating, 2024 to 2034

Figure 141: Western Europe Market Attractiveness by Phase, 2024 to 2034

Figure 142: Western Europe Market Attractiveness by Application, 2024 to 2034

Figure 143: Western Europe Market Attractiveness by End-use, 2024 to 2034

Figure 144: Western Europe Market Attractiveness by Country, 2024 to 2034

Figure 145: Eastern Europe Market Value (US$ million) by Motor Type, 2024 to 2034

Figure 146: Eastern Europe Market Value (US$ million) by Power Rating, 2024 to 2034

Figure 147: Eastern Europe Market Value (US$ million) by Phase, 2024 to 2034

Figure 148: Eastern Europe Market Value (US$ million) by Application, 2024 to 2034

Figure 149: Eastern Europe Market Value (US$ million) by End-use, 2024 to 2034

Figure 150: Eastern Europe Market Value (US$ million) by Country, 2024 to 2034

Figure 151: Eastern Europe Market Value (US$ million) Analysis by Country, 2019 to 2034

Figure 152: Eastern Europe Market Volume (Units) Analysis by Country, 2019 to 2034

Figure 153: Eastern Europe Market Value Share (%) and BPS Analysis by Country, 2024 to 2034

Figure 154: Eastern Europe Market Y-o-Y Growth (%) Projections by Country, 2024 to 2034

Figure 155: Eastern Europe Market Value (US$ million) Analysis by Motor Type, 2019 to 2034

Figure 156: Eastern Europe Market Volume (Units) Analysis by Motor Type, 2019 to 2034

Figure 157: Eastern Europe Market Value Share (%) and BPS Analysis by Motor Type, 2024 to 2034

Figure 158: Eastern Europe Market Y-o-Y Growth (%) Projections by Motor Type, 2024 to 2034

Figure 159: Eastern Europe Market Value (US$ million) Analysis by Power Rating, 2019 to 2034

Figure 160: Eastern Europe Market Volume (Units) Analysis by Power Rating, 2019 to 2034

Figure 161: Eastern Europe Market Value Share (%) and BPS Analysis by Power Rating, 2024 to 2034

Figure 162: Eastern Europe Market Y-o-Y Growth (%) Projections by Power Rating, 2024 to 2034

Figure 163: Eastern Europe Market Value (US$ million) Analysis by Phase, 2019 to 2034

Figure 164: Eastern Europe Market Volume (Units) Analysis by Phase, 2019 to 2034

Figure 165: Eastern Europe Market Value Share (%) and BPS Analysis by Phase, 2024 to 2034

Figure 166: Eastern Europe Market Y-o-Y Growth (%) Projections by Phase, 2024 to 2034

Figure 167: Eastern Europe Market Value (US$ million) Analysis by Application, 2019 to 2034

Figure 168: Eastern Europe Market Volume (Units) Analysis by Application, 2019 to 2034

Figure 169: Eastern Europe Market Value Share (%) and BPS Analysis by Application, 2024 to 2034

Figure 170: Eastern Europe Market Y-o-Y Growth (%) Projections by Application, 2024 to 2034

Figure 171: Eastern Europe Market Value (US$ million) Analysis by End-use, 2019 to 2034

Figure 172: Eastern Europe Market Volume (Units) Analysis by End-use, 2019 to 2034

Figure 173: Eastern Europe Market Value Share (%) and BPS Analysis by End-use, 2024 to 2034

Figure 174: Eastern Europe Market Y-o-Y Growth (%) Projections by End-use, 2024 to 2034

Figure 175: Eastern Europe Market Attractiveness by Motor Type, 2024 to 2034

Figure 176: Eastern Europe Market Attractiveness by Power Rating, 2024 to 2034

Figure 177: Eastern Europe Market Attractiveness by Phase, 2024 to 2034

Figure 178: Eastern Europe Market Attractiveness by Application, 2024 to 2034

Figure 179: Eastern Europe Market Attractiveness by End-use, 2024 to 2034

Figure 180: Eastern Europe Market Attractiveness by Country, 2024 to 2034

Figure 181: East Asia Market Value (US$ million) by Motor Type, 2024 to 2034

Figure 182: East Asia Market Value (US$ million) by Power Rating, 2024 to 2034

Figure 183: East Asia Market Value (US$ million) by Phase, 2024 to 2034

Figure 184: East Asia Market Value (US$ million) by Application, 2024 to 2034

Figure 185: East Asia Market Value (US$ million) by End-use, 2024 to 2034

Figure 186: East Asia Market Value (US$ million) by Country, 2024 to 2034

Figure 187: East Asia Market Value (US$ million) Analysis by Country, 2019 to 2034

Figure 188: East Asia Market Volume (Units) Analysis by Country, 2019 to 2034

Figure 189: East Asia Market Value Share (%) and BPS Analysis by Country, 2024 to 2034

Figure 190: East Asia Market Y-o-Y Growth (%) Projections by Country, 2024 to 2034

Figure 191: East Asia Market Value (US$ million) Analysis by Motor Type, 2019 to 2034

Figure 192: East Asia Market Volume (Units) Analysis by Motor Type, 2019 to 2034

Figure 193: East Asia Market Value Share (%) and BPS Analysis by Motor Type, 2024 to 2034

Figure 194: East Asia Market Y-o-Y Growth (%) Projections by Motor Type, 2024 to 2034

Figure 195: East Asia Market Value (US$ million) Analysis by Power Rating, 2019 to 2034

Figure 196: East Asia Market Volume (Units) Analysis by Power Rating, 2019 to 2034

Figure 197: East Asia Market Value Share (%) and BPS Analysis by Power Rating, 2024 to 2034

Figure 198: East Asia Market Y-o-Y Growth (%) Projections by Power Rating, 2024 to 2034

Figure 199: East Asia Market Value (US$ million) Analysis by Phase, 2019 to 2034

Figure 200: East Asia Market Volume (Units) Analysis by Phase, 2019 to 2034

Figure 201: East Asia Market Value Share (%) and BPS Analysis by Phase, 2024 to 2034

Figure 202: East Asia Market Y-o-Y Growth (%) Projections by Phase, 2024 to 2034

Figure 203: East Asia Market Value (US$ million) Analysis by Application, 2019 to 2034

Figure 204: East Asia Market Volume (Units) Analysis by Application, 2019 to 2034

Figure 205: East Asia Market Value Share (%) and BPS Analysis by Application, 2024 to 2034

Figure 206: East Asia Market Y-o-Y Growth (%) Projections by Application, 2024 to 2034

Figure 207: East Asia Market Value (US$ million) Analysis by End-use, 2019 to 2034

Figure 208: East Asia Market Volume (Units) Analysis by End-use, 2019 to 2034

Figure 209: East Asia Market Value Share (%) and BPS Analysis by End-use, 2024 to 2034

Figure 210: East Asia Market Y-o-Y Growth (%) Projections by End-use, 2024 to 2034

Figure 211: East Asia Market Attractiveness by Motor Type, 2024 to 2034

Figure 212: East Asia Market Attractiveness by Power Rating, 2024 to 2034

Figure 213: East Asia Market Attractiveness by Phase, 2024 to 2034

Figure 214: East Asia Market Attractiveness by Application, 2024 to 2034

Figure 215: East Asia Market Attractiveness by End-use, 2024 to 2034

Figure 216: East Asia Market Attractiveness by Country, 2024 to 2034

Figure 217: South Asia Pacific Market Value (US$ million) by Motor Type, 2024 to 2034

Figure 218: South Asia Pacific Market Value (US$ million) by Power Rating, 2024 to 2034

Figure 219: South Asia Pacific Market Value (US$ million) by Phase, 2024 to 2034

Figure 220: South Asia Pacific Market Value (US$ million) by Application, 2024 to 2034

Figure 221: South Asia Pacific Market Value (US$ million) by End-use, 2024 to 2034

Figure 222: South Asia Pacific Market Value (US$ million) by Country, 2024 to 2034

Figure 223: South Asia Pacific Market Value (US$ million) Analysis by Country, 2019 to 2034

Figure 224: South Asia Pacific Market Volume (Units) Analysis by Country, 2019 to 2034

Figure 225: South Asia Pacific Market Value Share (%) and BPS Analysis by Country, 2024 to 2034

Figure 226: South Asia Pacific Market Y-o-Y Growth (%) Projections by Country, 2024 to 2034

Figure 227: South Asia Pacific Market Value (US$ million) Analysis by Motor Type, 2019 to 2034

Figure 228: South Asia Pacific Market Volume (Units) Analysis by Motor Type, 2019 to 2034

Figure 229: South Asia Pacific Market Value Share (%) and BPS Analysis by Motor Type, 2024 to 2034

Figure 230: South Asia Pacific Market Y-o-Y Growth (%) Projections by Motor Type, 2024 to 2034

Figure 231: South Asia Pacific Market Value (US$ million) Analysis by Power Rating, 2019 to 2034

Figure 232: South Asia Pacific Market Volume (Units) Analysis by Power Rating, 2019 to 2034

Figure 233: South Asia Pacific Market Value Share (%) and BPS Analysis by Power Rating, 2024 to 2034

Figure 234: South Asia Pacific Market Y-o-Y Growth (%) Projections by Power Rating, 2024 to 2034

Figure 235: South Asia Pacific Market Value (US$ million) Analysis by Phase, 2019 to 2034

Figure 236: South Asia Pacific Market Volume (Units) Analysis by Phase, 2019 to 2034

Figure 237: South Asia Pacific Market Value Share (%) and BPS Analysis by Phase, 2024 to 2034

Figure 238: South Asia Pacific Market Y-o-Y Growth (%) Projections by Phase, 2024 to 2034

Figure 239: South Asia Pacific Market Value (US$ million) Analysis by Application, 2019 to 2034

Figure 240: South Asia Pacific Market Volume (Units) Analysis by Application, 2019 to 2034

Figure 241: South Asia Pacific Market Value Share (%) and BPS Analysis by Application, 2024 to 2034

Figure 242: South Asia Pacific Market Y-o-Y Growth (%) Projections by Application, 2024 to 2034

Figure 243: South Asia Pacific Market Value (US$ million) Analysis by End-use, 2019 to 2034

Figure 244: South Asia Pacific Market Volume (Units) Analysis by End-use, 2019 to 2034

Figure 245: South Asia Pacific Market Value Share (%) and BPS Analysis by End-use, 2024 to 2034

Figure 246: South Asia Pacific Market Y-o-Y Growth (%) Projections by End-use, 2024 to 2034

Figure 247: South Asia Pacific Market Attractiveness by Motor Type, 2024 to 2034

Figure 248: South Asia Pacific Market Attractiveness by Power Rating, 2024 to 2034

Figure 249: South Asia Pacific Market Attractiveness by Phase, 2024 to 2034

Figure 250: South Asia Pacific Market Attractiveness by Application, 2024 to 2034

Figure 251: South Asia Pacific Market Attractiveness by End-use, 2024 to 2034

Figure 252: South Asia Pacific Market Attractiveness by Country, 2024 to 2034

Figure 253: Middle East & Africa Market Value (US$ million) by Motor Type, 2024 to 2034

Figure 254: Middle East & Africa Market Value (US$ million) by Power Rating, 2024 to 2034

Figure 255: Middle East & Africa Market Value (US$ million) by Phase, 2024 to 2034

Figure 256: Middle East & Africa Market Value (US$ million) by Application, 2024 to 2034

Figure 257: Middle East & Africa Market Value (US$ million) by End-use, 2024 to 2034

Figure 258: Middle East & Africa Market Value (US$ million) by Country, 2024 to 2034

Figure 259: Middle East & Africa Market Value (US$ million) Analysis by Country, 2019 to 2034

Figure 260: Middle East & Africa Market Volume (Units) Analysis by Country, 2019 to 2034

Figure 261: Middle East & Africa Market Value Share (%) and BPS Analysis by Country, 2024 to 2034

Figure 262: Middle East & Africa Market Y-o-Y Growth (%) Projections by Country, 2024 to 2034

Figure 263: Middle East & Africa Market Value (US$ million) Analysis by Motor Type, 2019 to 2034

Figure 264: Middle East & Africa Market Volume (Units) Analysis by Motor Type, 2019 to 2034

Figure 265: Middle East & Africa Market Value Share (%) and BPS Analysis by Motor Type, 2024 to 2034

Figure 266: Middle East & Africa Market Y-o-Y Growth (%) Projections by Motor Type, 2024 to 2034

Figure 267: Middle East & Africa Market Value (US$ million) Analysis by Power Rating, 2019 to 2034

Figure 268: Middle East & Africa Market Volume (Units) Analysis by Power Rating, 2019 to 2034

Figure 269: Middle East & Africa Market Value Share (%) and BPS Analysis by Power Rating, 2024 to 2034

Figure 270: Middle East & Africa Market Y-o-Y Growth (%) Projections by Power Rating, 2024 to 2034

Figure 271: Middle East & Africa Market Value (US$ million) Analysis by Phase, 2019 to 2034

Figure 272: Middle East & Africa Market Volume (Units) Analysis by Phase, 2019 to 2034

Figure 273: Middle East & Africa Market Value Share (%) and BPS Analysis by Phase, 2024 to 2034

Figure 274: Middle East & Africa Market Y-o-Y Growth (%) Projections by Phase, 2024 to 2034

Figure 275: Middle East & Africa Market Value (US$ million) Analysis by Application, 2019 to 2034

Figure 276: Middle East & Africa Market Volume (Units) Analysis by Application, 2019 to 2034

Figure 277: Middle East & Africa Market Value Share (%) and BPS Analysis by Application, 2024 to 2034

Figure 278: Middle East & Africa Market Y-o-Y Growth (%) Projections by Application, 2024 to 2034

Figure 279: Middle East & Africa Market Value (US$ million) Analysis by End-use, 2019 to 2034

Figure 280: Middle East & Africa Market Volume (Units) Analysis by End-use, 2019 to 2034

Figure 281: Middle East & Africa Market Value Share (%) and BPS Analysis by End-use, 2024 to 2034

Figure 282: Middle East & Africa Market Y-o-Y Growth (%) Projections by End-use, 2024 to 2034

Figure 283: Middle East & Africa Market Attractiveness by Motor Type, 2024 to 2034

Figure 284: Middle East & Africa Market Attractiveness by Power Rating, 2024 to 2034

Figure 285: Middle East & Africa Market Attractiveness by Phase, 2024 to 2034

Figure 286: Middle East & Africa Market Attractiveness by Application, 2024 to 2034

Figure 287: Middle East & Africa Market Attractiveness by End-use, 2024 to 2034

Figure 288: Middle East & Africa Market Attractiveness by Country, 2024 to 2034

Recommendations

Industrial Automation

Explosion Proof Equipment Market

Published : July 2023

Industrial Automation

Motorized Decoiler Machine Market

Published : July 2023

Industrial Automation

Hazardous Area Equipment Market

Published : May 2023

Industrial Automation

Low Voltage Motor Market

Published : June 2022

Explore Industrial Automation Insights

View Reports

Explosion-proof Motor Market