The global extruder and compounding machines market is valued at USD 79 billion in 2025 and is slated to reach USD 119.2 billion by 2035, recording an absolute increase of USD 40.2 billion over the forecast period. This translates into a total growth of 50.9%, with the market forecast to expand at a compound annual growth rate (CAGR) of 4.2% between 2025 and 2035. The overall market size is expected to grow by nearly 1.5X during the same period, supported by increasing demand for specialty plastics, growing automotive lightweighting initiatives, and rising adoption of advanced polymer processing technologies across diverse industrial applications.
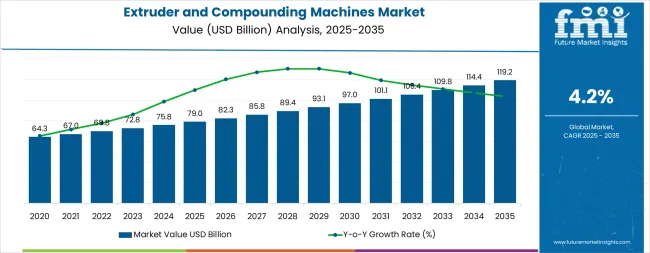
Between 2025 and 2030, the extruder and compounding machines market is projected to expand from USD 79 billion to USD 97 billion, resulting in a value increase of USD 18 billion, which represents 44.8% of the total forecast growth for the decade. This phase of development will be shaped by increasing specialty plastics demand, rising automotive applications, and growing adoption of energy-efficient twin screw technologies in manufacturing applications. Equipment manufacturers are expanding their technological capabilities to address the growing demand for advanced processing solutions and enhanced operational efficiency.
| Metric | Value |
|---|---|
| Estimated Value in (2025E) | USD 79 billion |
| Forecast Value in (2035F) | USD 119.2 billion |
| Forecast CAGR (2025 to 2035) | 4.2% |
From 2030 to 2035, the market is forecast to grow from USD 97 billion to USD 119.2 billion, adding another USD 22.2 billion, which constitutes 55.2% of the overall ten-year expansion. This period is expected to be characterized by the expansion of Industry 4.0 integration, the integration of AI-enabled process control systems, and the development of advanced modular compounding solutions for major automotive and packaging projects. The growing adoption of automation programs and smart manufacturing initiatives will drive demand for extruder and compounding machines with enhanced technological capabilities and reduced operational complexity.
Between 2020 and 2025, the extruder and compounding machines market experienced steady growth, driven by increasing plastic processing demand and growing recognition of advanced extrusion technology as essential equipment for material transformation and product development. The market developed as manufacturing operators recognized the potential for sophisticated extrusion systems to enhance operational efficiency while reducing processing costs and improving product quality. Technological advancement in twin screw designs and automated control systems began emphasizing the critical importance of maintaining processing precision and operational reliability in polymer processing applications.
Market expansion is being supported by the increasing demand for specialty plastics and the corresponding need for advanced processing equipment that can maintain operational precision and material consistency while supporting diverse manufacturing applications across various industrial environments. Modern manufacturing operators are increasingly focused on implementing extrusion solutions that can reduce processing variations, minimize material waste, and provide consistent performance in polymer processing operations. Extruder and compounding machines' proven ability to deliver enhanced processing efficiency, reliable material transformation capabilities, and versatile manufacturing applications make them essential equipment for contemporary polymer processing operations and specialty material production solutions.
The growing emphasis on automotive lightweighting and operational efficiency is driving demand for extruder and compounding machines that can support high-performance material processing, reduce energy consumption, and enable efficient polymer compounding operations across varying manufacturing configurations. Manufacturing operators' preference for equipment that combines precision with processing efficiency and cost-effectiveness is creating opportunities for innovative extrusion implementations. The rising influence of Industry 4.0 technologies and automated process control is also contributing to increased adoption of extruder and compounding machines that can provide advanced operational control without compromising performance or material quality.
The extruder and compounding machines market is poised for steady growth and transformation. As manufacturing operators across both developed and emerging markets seek processing equipment that is efficient, precise, technologically advanced, and operationally effective, extrusion systems are gaining prominence not just as manufacturing equipment but as strategic infrastructure for operational efficiency, product quality enhancement, cost optimization, and competitive positioning.
Rising specialty plastics demand and industrial development in East Asia, South Asia Pacific, and North America amplify demand, while manufacturers are picking up on innovations in twin screw technologies and AI-enabled control systems.
Pathways like specialty plastics processing, automotive applications, and smart manufacturing promise strong margin uplift, especially in developed markets. Geographic expansion and application diversification will capture volume, particularly where manufacturing activities are growing or polymer processing infrastructure requires modernization. Technology pressures around processing precision, energy efficiency, operational automation, and material quality give structural support.
The market is segmented by product type, application, end use industry, and region. By product type, the market is divided into single screw, twin screw, and ram extruders. By application, it covers specialty plastics, PVC cable, master batch production, flooring sheet, and others (adhesives, coatings, and technical compounds). By end use industry, it includes food industry, chemical industry, plastic industry, medical/pharmaceutical, and others. Regionally, the market is divided into North America, Latin America, Western Europe, Eastern Europe, East Asia, South Asia & Pacific, and Middle East & Africa.
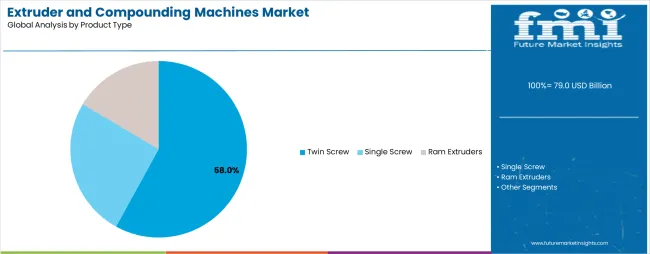
The twin screw segment is projected to account for 58% of the extruder and compounding machines market in 2025, reaffirming its position as the leading product type category. Manufacturing operators and polymer processors increasingly utilize twin screw extruders for their superior mixing capabilities, operational versatility, and reliable performance across specialty plastics, compounding, and advanced material applications. Twin screw technology's established processing procedures and consistent material handling characteristics directly address the manufacturing requirements for reliable processing systems and operational efficiency in diverse polymer processing environments.
This product type segment forms the foundation of current polymer processing operations, as it represents the technology with the greatest operational flexibility and proven application compatibility across multiple materials and processing scenarios. Operator investments in enhanced twin screw systems and processing optimization continue to strengthen adoption among manufacturing companies and material processors. With operators prioritizing processing precision and operational reliability, twin screw extruders align with both performance objectives and cost management requirements, making them the central component of comprehensive polymer processing strategies.
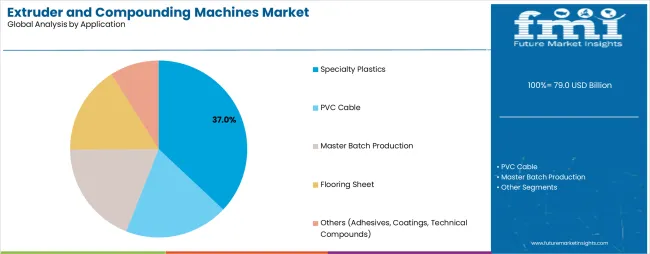
Specialty plastics applications are projected to represent 37% of extruder and compounding machines demand in 2025, underscoring their critical role as the primary application for high-performance polymer processing and advanced material production operations. Manufacturing operators prefer specialty plastics processing for their market value, technical requirements, and ability to support innovative product development while ensuring material performance and application-specific requirements. Positioned as essential applications for modern manufacturing operations, specialty plastics processing offers both technical advantages and commercial benefits.
The segment is supported by continuous innovation in material development and the growing availability of specialized processing configurations that enable efficient specialty plastic production with enhanced performance capabilities. Manufacturing operators are investing in specialty plastics solutions to support high-value operations and advanced material delivery. As automotive and electronics applications become more prevalent and performance requirements increase, specialty plastics will continue to dominate the application market while supporting advanced processing utilization and manufacturing operational strategies.
The extruder and compounding machines market is advancing steadily due to increasing specialty plastics demand and growing adoption of advanced processing technologies that provide enhanced operational efficiency and material consistency across diverse manufacturing applications. However, the market faces challenges, including high capital investment costs, complex technological requirements, and varying material specifications across different processing environments. Innovation in twin screw technologies and automated control systems continues to influence equipment development and market expansion patterns.
The growing demand for specialty plastics and automotive lightweighting initiatives is enabling equipment manufacturers to develop extrusion systems that provide superior processing capability, enhanced material performance, and reliable operation in high-volume manufacturing environments. Advanced extrusion systems provide improved processing efficiency while allowing more effective material transformation and consistent quality delivery across various applications and manufacturing requirements. Manufacturers are increasingly recognizing the competitive advantages of modern extrusion capabilities for operational efficiency and product quality positioning.
Modern extruder and compounding machine manufacturers are incorporating Industry 4.0 technologies and automated control systems to enhance processing precision, reduce operational costs, and ensure consistent performance delivery to manufacturing and polymer processing operators. These technologies improve system reliability while enabling new applications, including predictive maintenance and remote monitoring solutions. Advanced technology integration also allows manufacturers to support premium equipment positioning and operational optimization beyond traditional extrusion equipment supply.
| Country | CAGR (2025-2035) |
|---|---|
| China | 5% |
| India | 4.8% |
| USA | 4.2% |
| Germany | 3.8% |
| Japan | 3.5% |
| South Korea | 3.3% |
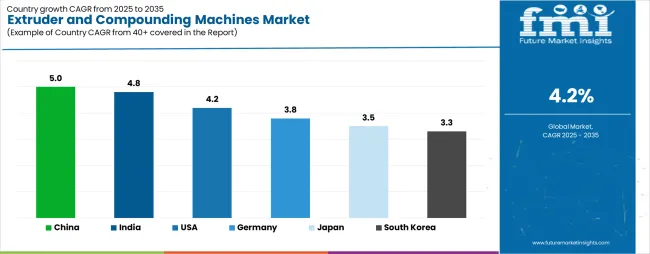
The extruder and compounding machines market is experiencing varied growth globally, with China leading at a 5% CAGR through 2035, driven by extensive industrialization programs, rapid manufacturing expansion, and significant adoption of polymer processing solutions. India follows at 4.8%, supported by growing specialty plastics demand, infrastructure development, and increasing adoption of advanced manufacturing technologies. USA shows growth at 4.2%, emphasizing high-performance polymer applications and automotive lightweighting. Germany records 3.8%, focusing on precision engineering and Industry 4.0 integration. Japan demonstrates 3.5% growth, supported by advanced manufacturing capabilities and technology innovation. South Korea shows 3.3% growth, driven by electronics manufacturing and specialty materials processing.
The report covers an in-depth analysis of 40+ countries; six top-performing countries are highlighted below.
Revenue from extruder and compounding machines in China is projected to exhibit exceptional growth with a CAGR of 5% through 2035, driven by extensive manufacturing expansion programs and rapidly growing adoption of polymer processing solutions supported by industrialization initiatives and infrastructure development requirements. The country's comprehensive manufacturing development strategy and increasing investment in advanced processing technologies are creating substantial demand for sophisticated extrusion equipment. Major manufacturing companies and polymer processors are establishing comprehensive processing systems to serve both domestic production needs and export manufacturing requirements.
Revenue from extruder and compounding machines in India is expanding at a CAGR of 4.8%, supported by the country's growing specialty plastics demand, comprehensive industrial development programs, and increasing adoption of advanced processing systems. The country's established manufacturing infrastructure and growing emphasis on technological advancement are driving sophisticated extrusion capabilities. Manufacturing companies and polymer processors are establishing extensive processing operations to address the growing demand for material processing and production efficiency.
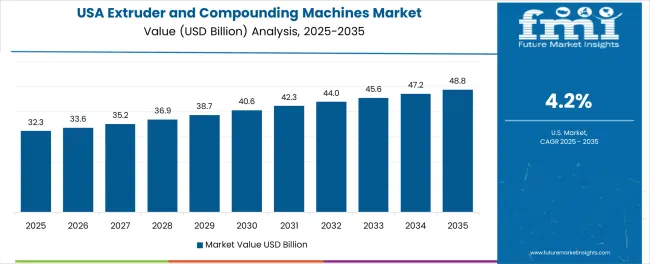
Revenue from extruder and compounding machines in USA is growing at a CAGR of 4.2%, driven by expanding high-performance polymer applications, increasing automotive lightweighting initiatives, and growing investment in advanced manufacturing enhancement. The country's established manufacturing sector and emphasis on technological innovation are supporting demand for advanced extrusion technologies across major industrial markets. Manufacturing operators and automotive companies are establishing comprehensive processing programs to serve both domestic production needs and technological advancement requirements.
Revenue from extruder and compounding machines in Germany is expanding at a CAGR of 3.8%, supported by the country's focus on precision engineering, comprehensive Industry 4.0 integration programs, and strategic investment in advanced manufacturing improvement. Germany's established industrial infrastructure and emphasis on technological excellence are driving demand for specialized extrusion technologies focusing on operational precision and manufacturing innovation. Industrial operators are investing in comprehensive processing modernization to serve both domestic manufacturing requirements and export technology operations.
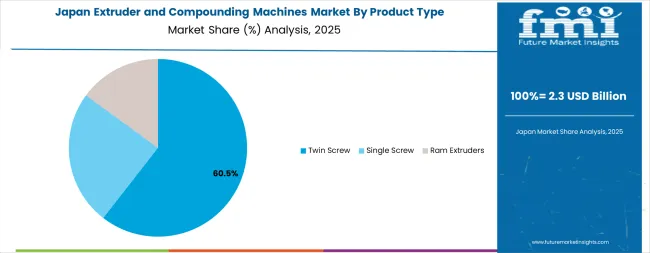
Revenue from extruder and compounding machines in Japan is expanding at a CAGR of 3.5%, supported by the country's focus on manufacturing excellence, comprehensive technology innovation programs, and strategic investment in processing advancement. Japan's established manufacturing sector and emphasis on quality control are driving demand for specialized extrusion technologies focusing on operational reliability and technological advancement. Manufacturing operators are investing in comprehensive processing enhancement to serve both domestic industrial requirements and technology export initiatives.
Revenue from extruder and compounding machines in South Korea is expanding at a CAGR of 3.3%, supported by the country's focus on electronics manufacturing, comprehensive specialty materials processing, and strategic investment in advanced processing improvement. South Korea's established technology sector and emphasis on manufacturing innovation are driving demand for specialized extrusion technologies focusing on operational efficiency and material processing excellence. Manufacturing operators are investing in processing enhancement to serve both domestic technology requirements and manufacturing innovation initiatives.
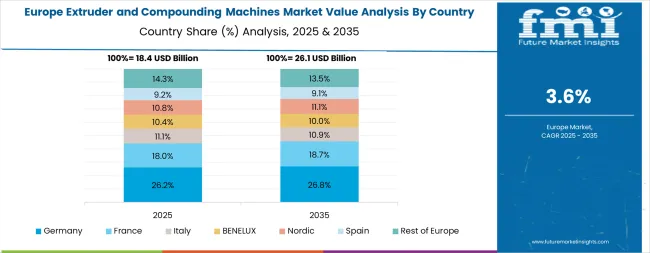
The extruder and compounding machines market in Europe is projected to grow from USD 18.4 billion in 2025 to USD 26.8 billion by 2035, registering a CAGR of 3.8% over the forecast period. Germany is expected to maintain its leadership position with a 34.2% market share in 2025, increasing to 34.7% by 2035, supported by its advanced manufacturing infrastructure, comprehensive precision engineering capabilities, and major automotive facilities serving European and international markets.
Italy follows with a 16.8% share in 2025, projected to reach 16.4% by 2035, driven by manufacturing sector development, automotive industry programs, and established processing capabilities, but facing challenges from competitive pressures and investment constraints. France holds a 14.3% share in 2025, expected to decline to 13.9% by 2035, supported by industrial modernization requirements and technology development but facing challenges from regulatory adjustments and investment uncertainties. United Kingdom commands a 12.7% share in 2025, projected to reach 12.9% by 2035, while Spain accounts for 9.2% in 2025, expected to reach 9.4% by 2035. The Rest of Europe region, including Nordic countries, Eastern European markets, Netherlands, Belgium, and other European countries, is anticipated to gain momentum, expanding its collective share from 12.8% to 13.2% by 2035, attributed to increasing manufacturing development across Nordic countries and growing industrial modernization across various European markets implementing advanced processing upgrade programs.
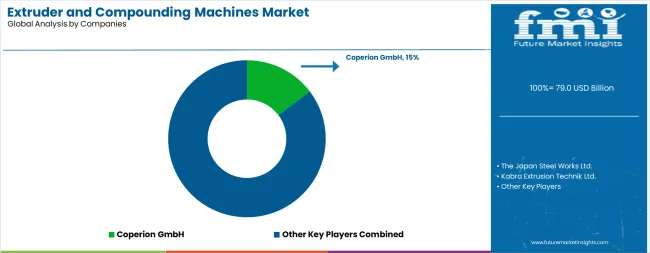
The extruder and compounding machines market is characterized by competition among established industrial machinery manufacturers, specialized extrusion technology providers, and integrated polymer processing service companies. Companies are investing in advanced twin screw research, automation technology development, Industry 4.0 integration, and comprehensive processing portfolios to deliver efficient, precise, and technologically-advanced extrusion solutions. Innovation in processing technology systems, automated control technologies, and specialized application capabilities is central to strengthening market position and competitive advantage.
The Japan Steel Works Ltd. leads the market with a strong presence, offering comprehensive steel processing and extrusion solutions with a focus on advanced engineering and precision manufacturing capabilities for industrial and polymer processing operations. Coperion GmbH provides specialized process engineering portfolios with an emphasis on technological innovation, twin screw expertise, and comprehensive service support. Kabra Extrusion Technik Ltd. delivers integrated extrusion equipment and processing solutions with focus on emerging markets and cost-effective applications. Davis-Standard LLC specializes in extrusion technologies with emphasis on film, sheet, and profile applications. NFM Welding Engineers focuses on compounding solutions with advanced mixing capabilities and technical expertise.
| Items | Values |
|---|---|
| Quantitative Units (2025) | USD 79 Billion |
| Product Type | Single Screw, Twin Screw, Ram Extruders |
| Application | Specialty Plastics, PVC Cable, Master Batch Production, Flooring Sheet, Others (Adhesives, Coatings, Technical Compounds) |
| End Use Industry | Food Industry, Chemical Industry, Plastic Industry, Medical/Pharmaceutical, Others |
| Regions Covered | North America, Latin America, Western Europe, Eastern Europe, East Asia, South Asia & Pacific, Middle East & Africa |
| Countries Covered | United States, Canada, United Kingdom, Germany, France, China, Japan, South Korea, Brazil, Australia, and 40+ countries |
| Key Companies Profiled | The Japan Steel Works Ltd., Coperion GmbH, Kabra Extrusion Technik Ltd., Davis-Standard LLC, NFM Welding Engineers, and others |
| Additional Attributes | Equipment sales by product and application category, regional demand trends, competitive landscape, technological advancements in processing systems, automation development, Industry 4.0 innovation, and operational efficiency optimization |
The global extruder and compounding machines market is estimated to be valued at USD 79.0 billion in 2025.
The market size for the extruder and compounding machines market is projected to reach USD 119.2 billion by 2035.
The extruder and compounding machines market is expected to grow at a 4.2% CAGR between 2025 and 2035.
The key product types in extruder and compounding machines market are twin screw, single screw and ram extruders.
In terms of application, specialty plastics segment to command 37.0% share in the extruder and compounding machines market in 2025.


Our Research Products

The "Full Research Suite" delivers actionable market intel, deep dives on markets or technologies, so clients act faster, cut risk, and unlock growth.

The Leaderboard benchmarks and ranks top vendors, classifying them as Established Leaders, Leading Challengers, or Disruptors & Challengers.

Locates where complements amplify value and substitutes erode it, forecasting net impact by horizon

We deliver granular, decision-grade intel: market sizing, 5-year forecasts, pricing, adoption, usage, revenue, and operational KPIs—plus competitor tracking, regulation, and value chains—across 60 countries broadly.

Spot the shifts before they hit your P&L. We track inflection points, adoption curves, pricing moves, and ecosystem plays to show where demand is heading, why it is changing, and what to do next across high-growth markets and disruptive tech

Real-time reads of user behavior. We track shifting priorities, perceptions of today’s and next-gen services, and provider experience, then pace how fast tech moves from trial to adoption, blending buyer, consumer, and channel inputs with social signals (#WhySwitch, #UX).

Partner with our analyst team to build a custom report designed around your business priorities. From analysing market trends to assessing competitors or crafting bespoke datasets, we tailor insights to your needs.
Supplier Intelligence
Discovery & Profiling
Capacity & Footprint
Performance & Risk
Compliance & Governance
Commercial Readiness
Who Supplies Whom
Scorecards & Shortlists
Playbooks & Docs
Category Intelligence
Definition & Scope
Demand & Use Cases
Cost Drivers
Market Structure
Supply Chain Map
Trade & Policy
Operating Norms
Deliverables
Buyer Intelligence
Account Basics
Spend & Scope
Procurement Model
Vendor Requirements
Terms & Policies
Entry Strategy
Pain Points & Triggers
Outputs
Pricing Analysis
Benchmarks
Trends
Should-Cost
Indexation
Landed Cost
Commercial Terms
Deliverables
Brand Analysis
Positioning & Value Prop
Share & Presence
Customer Evidence
Go-to-Market
Digital & Reputation
Compliance & Trust
KPIs & Gaps
Outputs
Full Research Suite comprises of:
Market outlook & trends analysis
Interviews & case studies
Strategic recommendations
Vendor profiles & capabilities analysis
5-year forecasts
8 regions and 60+ country-level data splits
Market segment data splits
12 months of continuous data updates
DELIVERED AS:
PDF EXCEL ONLINE
Extruder Conditioner Market Size and Share Forecast Outlook 2025 to 2035
Extruder Market Size, Share, Trends & Forecast 2024-2034
Compounding Systems Market
Food Extruder Market Size and Share Forecast Outlook 2025 to 2035
Lathe Machines Market
Sorter Machines Market Size and Share Forecast Outlook 2025 to 2035
Rubber Extruder Market Growth - Trends & Forecast 2025 to 2035
Virtual Machines Market by Type, by Enterprise Size, by Industry & Region Forecast till 2035
Bandsaw Machines Market Growth - Trends & Forecast 2025 to 2035
Plastic Compounding Market Size, Growth, and Forecast 2025 to 2035
Wrapping Machines for Handkerchiefs Market Size and Share Forecast Outlook 2025 to 2035
Sleeving Machines Market Size and Share Forecast Outlook 2025 to 2035
Drilling Machines Market Size and Share Forecast Outlook 2025 to 2035
Spinning Machines Market Size and Share Forecast Outlook 2025 to 2035
Knitting Machines Market Size and Share Forecast Outlook 2025 to 2035
Stamping Machines Market Growth and Outlook 2025 to 2035
Twist Tie Machines Market Size and Share Forecast Outlook 2025 to 2035
Cartoning Machines Market from 2025 to 2035
Flow Wrap Machines Market by Horizontal & Vertical Systems Through 2025 to 2035
Flake Ice Machines Market - Industry Growth & Market Demand 2025 to 2035

Thank you!
You will receive an email from our Business Development Manager. Please be sure to check your SPAM/JUNK folder too.
Chat With
MaRIA