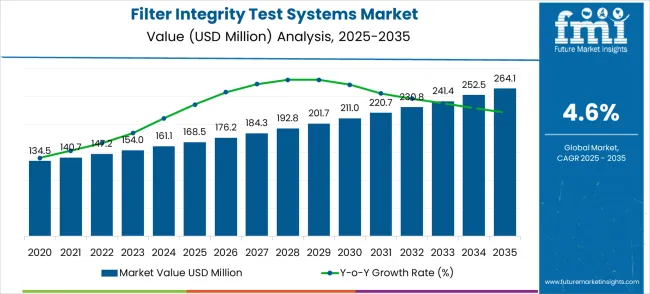
The filter integrity test systems market, valued at USD 168.5 million in 2025 and projected to reach USD 264.1 million by 2035 at a CAGR of 4.6%, demonstrates a steady absolute growth trajectory across the forecast period. From 2025 to 2035, the market is expected to add USD 95.6 million in total revenue, highlighting sustained expansion driven by regulatory compliance in filtration systems, growing biopharmaceutical manufacturing, and increased quality assurance requirements. Early growth from 2025 to 2028 shows incremental increases of roughly USD 7–9 million annually, reflecting moderate adoption. This absolute growth pattern underscores both consistent demand and gradual revenue accumulation, providing market participants with predictable opportunities for strategic planning and investment.
| Filter Integrity Test Systems Market | Value |
|---|---|
| Market Value (2025) | USD 168.5 million |
| Market Forecast Value (2035) | USD 264.1 million |
| Market Forecast CAGR | 4.6% |
The filter integrity test systems market, valued at USD 168.5 million in 2025 and projected to reach USD 264.1 million by 2035 at a CAGR of 4.6%, demonstrates a steady absolute growth trajectory across the forecast period. From 2025 to 2035, the market is expected to add USD 95.6 million in total revenue, highlighting sustained expansion driven by regulatory compliance in filtration systems, growing biopharmaceutical manufacturing, and increased quality assurance requirements. Early growth from 2025 to 2028 shows incremental increases of roughly USD 7–9 million annually, reflecting moderate adoption. This absolute growth pattern underscores both consistent demand and gradual revenue accumulation, providing market participants with predictable opportunities for strategic planning and investment.
From 2031 to 2035, the market expands from USD 220.7 million to USD 264.1 million, representing an absolute growth of USD 43.4 million. Revenue increments continue at a steady pace, though annual increases slightly moderate as the market approaches maturity in developed regions. Sustained demand is supported by ongoing quality control initiatives, replacement cycles for existing systems, and incremental adoption in emerging markets. Market participants are likely to prioritize product differentiation, advanced features, and service-based solutions to capture residual growth. The consistent pattern of absolute growth highlights the market’s reliability, with predictable revenue accumulation enabling long-term strategic planning. The compound absolute growth underscores gradual expansion without sharp fluctuations, offering stability for stakeholders and investors.
The global filter integrity test systems market is poised for steady growth, driven by stringent regulatory requirements, advancements in filtration technologies, and the increasing demand for quality assurance across various industries. By 2030, the market is projected to reach approximately USD 220.7 million, expanding at a CAGR of 5.5% from 2025 to 2030
The biopharmaceutical sector's rapid expansion necessitates rigorous filtration standards to ensure product purity and patient safety. Filter integrity tests are critical in validating sterilizing-grade filters, particularly in the production of biologics and sterile injectables. This segment represents a significant revenue pool, driven by increasing regulatory scrutiny and the complexity of biologic formulations.
In the food and beverage industry, maintaining microbiological safety and product quality is paramount. Filter integrity testing ensures that filtration systems effectively remove contaminants, thereby protecting consumers and adhering to health regulations. This pathway is gaining traction due to heightened consumer awareness and stricter food safety standards.
The growing emphasis on environmental sustainability and safe drinking water has led to increased investments in water and wastewater treatment infrastructure. Filter integrity tests are essential in verifying the performance of filtration systems in removing pathogens and pollutants, supporting public health initiatives and regulatory compliance.
The semiconductor industry relies on ultra-pure water and air to prevent contamination during manufacturing processes. Filter integrity testing ensures that filtration systems meet the stringent requirements for particle and microbial removal, safeguarding the integrity of electronic components and devices.
Research and development laboratories in the pharmaceutical and biotechnology sectors require precise filtration to maintain sterile environments and prevent cross-contamination. Implementing regular filter integrity tests supports experimental accuracy and compliance with Good Laboratory Practices (GLP).
In the oil and gas industry, filtration systems are crucial for removing particulates and contaminants from fluids used in drilling and production processes. Ensuring the integrity of these filters through regular testing prevents equipment damage and operational inefficiencies, contributing to cost savings and environmental protection.
The production of medical devices necessitates a sterile manufacturing environment to prevent product contamination. Filter integrity testing is integral to validating the effectiveness of sterilizing-grade filters, ensuring compliance with regulatory standards and maintaining patient safety.
The integration of digital technologies and automation in quality assurance processes enhances the efficiency and accuracy of filter integrity testing. Implementing smart sensors, data analytics, and real-time monitoring systems facilitates predictive maintenance and compliance reporting, aligning with Industry 4.0 initiatives.
Market expansion is being supported by the rapid increase in pharmaceutical manufacturing activities worldwide and the corresponding need for comprehensive filter validation systems that provide superior quality assurance and regulatory compliance capabilities. Modern pharmaceutical and biotechnology facilities rely on consistent filtration performance and validation quality to ensure optimal product safety including drug manufacturing, biotechnology production, and medical device sterilization applications. Even minor filtration failures can require comprehensive batch recalls to maintain optimal safety standards and regulatory compliance.
The growing complexity of pharmaceutical requirements and increasing demand for automated validation solutions are driving demand for filter integrity test equipment from certified manufacturers with appropriate performance capabilities and technical expertise. Pharmaceutical companies and biotechnology firms are increasingly requiring documented testing efficiency and system reliability to maintain production quality and regulatory compliance. Industry specifications and validation standards are establishing standardized testing procedures that require specialized testing technologies and trained quality control personnel.
The market is segmented by test system type, application, and region. By test system type, the market is divided into Bubble Point Test Systems, Diffusion Test Systems, Pressure Drop Test Systems, Water Intrusion Test (WIT) Systems, and Multipurpose Test Systems. Based on application, the market is categorized into Pharmaceuticals, Biotechnology, Food & Beverage, and Others. Regionally, the market is divided into North America, Europe, East Asia, South Asia & Pacific, Latin America, and Middle East & Africa.
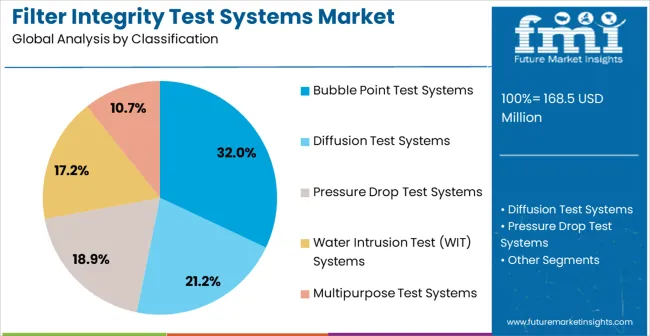
The bubble point test systems segment is projected to account for 32% of the filter integrity test systems market in 2025, maintaining its position as the leading test system type. Its dominance is driven by the widespread adoption of bubble point methodology, which allows quality control teams to accurately assess filter pore size and structural integrity without compromising filter performance. Bubble point test systems are widely accepted across pharmaceutical, biotechnology, and sterile manufacturing industries, providing reliable validation for various filtration applications.
Modern systems integrate advanced pressure control technologies, automated testing protocols, and consistent measurement precision, enabling quality teams to perform continuous validation across multiple filtration points. Demand is further reinforced by regulatory acceptance and industry standards that emphasize non-destructive testing, operational reliability, and production continuity. Pharmaceutical and biotechnology manufacturers increasingly rely on bubble point systems for accurate, reproducible integrity assessments that ensure product safety and process compliance.
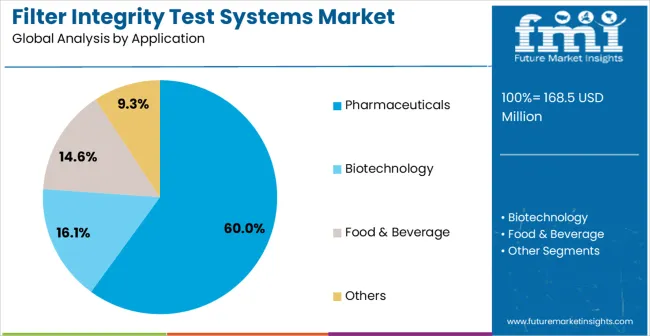
The pharmaceuticals segment is expected to represent 60% of filter integrity test systems demand in 2025, making it the largest application category. This dominance stems from the industry’s requirement for rigorous quality control, sterile filtration validation, and adherence to regulatory standards. Pharmaceutical manufacturers require sophisticated testing solutions to confirm filter performance, prevent contamination, and maintain compliance with FDA, EMA, and other global regulations. Filter integrity systems are critical for ensuring sterile manufacturing safety and validating filtration efficiency during both routine and critical quality control operations.
The segment benefits from the growing biopharmaceutical and sterile drug production markets, emphasizing high reliability, precision, and operational consistency. Adoption is further accelerated by personalized medicine trends, stringent regulatory scrutiny, and the need for efficient, accurate validation throughout complex manufacturing workflows. Advanced test systems enable comprehensive monitoring, reproducible results, and robust quality assurance across multiple production stages.
The filter integrity test systems market is advancing steadily due to increasing pharmaceutical production and growing recognition of automated testing advantages over manual validation methods. However, the market faces challenges including higher initial equipment costs compared to basic testing methods, need for specialized technical training, and varying regulatory requirements across different pharmaceutical applications. Performance optimization efforts and automation technology advancement programs continue to influence testing system development and market adoption patterns.
The growing development of advanced automated testing systems is enabling higher validation efficiency with improved accuracy characteristics and reduced manual intervention requirements. Enhanced automation technologies and optimized testing protocols provide superior validation performance while maintaining regulatory compliance requirements. These technologies are particularly valuable for large pharmaceutical manufacturers who require reliable testing performance that can support extensive validation operations with consistent results.
Modern filter integrity test system manufacturers are incorporating advanced multipurpose testing features and comprehensive validation protocols that enhance testing efficiency and system versatility. Integration of multiple testing methodologies and optimized data management systems enables superior validation results and comprehensive filter assessment capabilities. Advanced testing features support operation in diverse pharmaceutical environments while meeting various regulatory requirements and validation specifications.
| Country | CAGR (2025-2035) |
|---|---|
| China | 6.2% |
| India | 5.8% |
| Germany | 5.3% |
| Brazil | 4.8% |
| United States | 4.4% |
| United Kingdom | 3.9% |
| Japan | 3.5% |
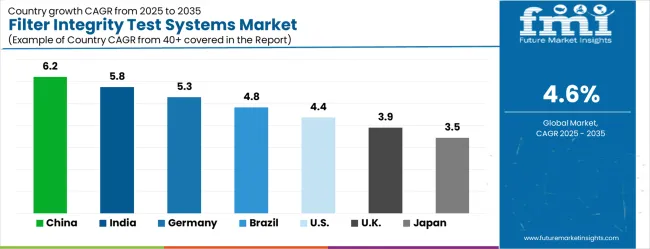
The filter integrity test systems market is growing steadily, with China leading at a 6.2% CAGR through 2035, driven by rapid pharmaceutical manufacturing expansion, biotechnology sector development, and increasing demand for advanced quality control systems. India follows at 5.8%, supported by rising pharmaceutical industry modernization and growing awareness of automated testing technologies in drug manufacturing and biotechnology applications. Germany records strong growth at 5.3%, emphasizing quality standards excellence, advanced pharmaceutical technology adoption, and comprehensive filtration validation infrastructure. Brazil grows steadily at 4.8%, integrating automated testing systems into expanding pharmaceutical manufacturing and modernizing biotechnology operations. The United States shows moderate growth at 4.4%, focusing on regulatory compliance enhancement and advanced testing technology implementation across established pharmaceutical industries. The United Kingdom maintains steady expansion at 3.9%, supported by biotechnology development programs and pharmaceutical quality assurance initiatives. Japan demonstrates stable growth at 3.5%, emphasizing testing technology innovation, precision validation systems, and quality enhancement applications in pharmaceutical manufacturing.
The report covers an in-depth analysis of 40+ countries top-performing countries are highlighted below.
The filter integrity test systems market in China is projected to grow at a CAGR of 6.2% through 2035, driven by rapid pharmaceutical infrastructure expansion and increasing demand for advanced quality control validation solutions. China is exceeding other countries in biotechnology and pharmaceutical manufacturing, with companies investing in automated testing equipment to meet stringent safety and regulatory standards. Leading equipment suppliers are establishing distribution networks to support production facilities across major development zones. Government initiatives for pharmaceutical modernization and research centers are further enhancing technology adoption. Competitive pressure from India and Germany encourages innovation in automated systems, driving improvements in testing efficiency, validation precision, and regulatory compliance across domestic pharmaceutical and biotechnology sectors.
The filter integrity test systems market in India is forecasted to expand at a CAGR of 5.8% through 2035, supported by growing pharmaceutical manufacturing, biotechnology development, and awareness of automated testing benefits. India is emerging as a significant growth market for advanced validation solutions, with companies implementing professional-grade systems to ensure regulatory compliance and production quality. Domestic and international suppliers are competing to deliver high-performance testing systems to meet diverse pharmaceutical applications. Investments in professional training and service programs are enhancing technical expertise among quality control personnel, enabling effective utilization of filter integrity technology. Competitive pressures with China and Germany are driving innovation in precision, reliability, and compliance to optimize operational performance across production networks.
The filter integrity test systems market in Germany is projected to grow at a CAGR of 5.3% through 2035, driven by stringent pharmaceutical quality standards, advanced testing technology adoption, and regulatory compliance requirements. Germany is growing as a European hub for high-performance testing systems, with domestic pharmaceutical and biotechnology companies implementing sophisticated equipment to meet validation precision and performance specifications. Suppliers face competition from India and Japan, encouraging innovation in reliability, automation, and validation accuracy. Investments in professional certification programs are ensuring technical expertise among quality control personnel, enabling specialized validation capabilities. Industrial programs supporting compliance, research, and product safety are further stimulating demand for advanced filter integrity systems across diverse pharmaceutical applications.
The filter integrity test systems market in Brazil is expected to grow at a CAGR of 4.8% through 2035, driven by increasing pharmaceutical production activity, regulatory compliance emphasis, and recognition of automated testing advantages. Brazil is maintaining steady growth, with pharmaceutical and biotechnology facilities integrating modern equipment to enhance validation efficiency and meet evolving quality standards. Suppliers compete with China and India to deliver high-performance solutions for swine, poultry, and general livestock feed applications. Professional development programs are enhancing technical capabilities among quality control personnel, ensuring proper utilization of testing systems. Pharmaceutical modernization initiatives are supporting adoption of automated equipment to improve validation accuracy, efficiency, and regulatory compliance across production networks.
The filter integrity test systems market in the United States is projected to grow at a CAGR of 4.4% through 2035, driven by established pharmaceutical industries, regulatory compliance initiatives, and technology innovation programs. USA pharmaceutical and biotechnology companies are implementing automated testing systems to support diverse validation requirements, operational consistency, and regulatory coverage. Suppliers are competing with Germany and China to deliver cost-effective, high-performance solutions. Professional development and certification programs are enhancing technical expertise among system operators to ensure proper use and regulatory alignment. Ongoing investments in facility upgrades, research, and technology adoption are strengthening demand for standardized filter integrity test workflows across regional pharmaceutical and biotechnology facilities.
The filter integrity test systems market in the United Kingdom is projected to grow at a CAGR of 3.9% through 2035, supported by established pharmaceutical infrastructure, biotechnology expansion, and regulatory compliance awareness. UK pharmaceutical and biotechnology companies are integrating automated testing solutions to meet industry quality standards and validation requirements. Suppliers are competing with Germany and Japan, driving technological improvements and operational efficiency. Professional development initiatives are building quality control expertise to support specialized filter integrity testing. Investments in facility modernization, validation optimization, and regulatory compliance are stimulating adoption of advanced systems across domestic pharmaceutical operations and research centers.
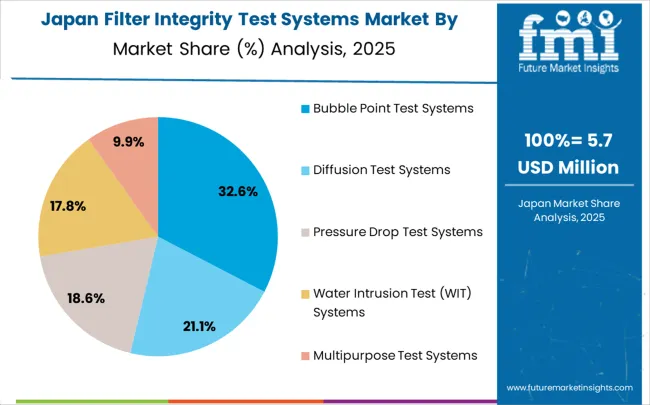
The filter integrity test systems market in Japan is expected to grow at a CAGR of 3.5% through 2035, driven by focus on quality assurance, technological innovation, and specialized pharmaceutical testing applications. Japanese pharmaceutical and biotechnology companies are deploying advanced filter integrity systems to achieve superior reliability, operational efficiency, and regulatory compliance. Suppliers are competing with China and Germany to provide precision-engineered solutions for complex validation needs. Investments in professional certification programs are enhancing operator expertise, enabling specialized testing capabilities. Technology innovation and quality-focused programs support continuous improvement and integration of automated validation systems, ensuring high performance and adherence to domestic and international pharmaceutical standards.
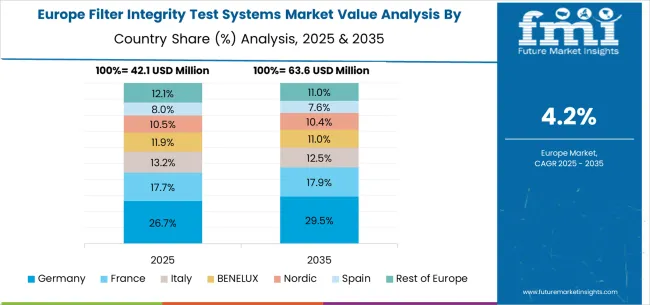
The filter integrity test systems market in Europe is projected to grow from USD 42.1 million in 2025 to USD 63.6 million by 2035, registering a CAGR of 4.2% over the forecast period. Germany is expected to remain the largest national market with 26.7% market share in 2025, rising to 29.5% by 2035, supported by strong pharmaceutical manufacturing infrastructure and advanced biotechnology development. The United Kingdom follows with 17.7% in 2025, inching up to 17.9% by 2035 as biotechnology applications and pharmaceutical quality assurance programs accelerate across diverse manufacturing sectors. France accounts for 13.2% in 2025, easing slightly to 12.5% by 2035 amid growing focus on automated testing adoption and pharmaceutical modernization initiatives.
Italy holds 11.9% in 2025, moderating to 11.0% by 2035 as pharmaceutical manufacturing and biotechnology sectors continue steady testing system adoption. Spain represents 10.5% in 2025, remaining near 10.4% by 2035 with consistent pharmaceutical activity and biotechnology facility development. BENELUX countries contribute 10.5% in 2025, dipping slightly to 10.4% by 2035, while the Nordic region holds 7.6% in 2025, sustaining the same 7.6% by 2035 with stable adoption across mature pharmaceutical sectors. The remainder of Europe (Eastern Europe and other emerging markets) collectively accounts for 12.1% in 2025, easing to 11.0% by 2035, reflecting pharmaceutical modernization in emerging markets versus stable adoption rates in established Western European pharmaceutical sectors.
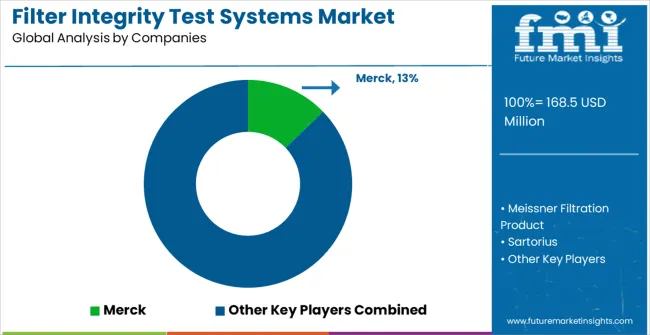
The filter integrity test systems market is defined by competition among specialized testing equipment manufacturers, pharmaceutical technology companies, and filtration solution providers. Companies are investing in advanced testing methodology development, automation technology optimization, regulatory compliance improvements, and comprehensive service capabilities to deliver reliable, efficient, and cost-effective validation solutions.
Merck offers comprehensive filter integrity testing solutions with established pharmaceutical expertise and advanced validation capabilities. Meissner Filtration Product provides specialized testing equipment with focus on performance reliability and operational efficiency. Sartorius delivers comprehensive testing solutions with emphasis on automation and regulatory compliance. Flow Test GmbH specializes in testing technology with advanced system integration capabilities.
Cytiva offers biotechnology testing equipment with comprehensive service support capabilities. Labnics delivers established laboratory testing solutions with advanced integrity testing technologies. iPHASE Technologies provides specialized testing systems with focus on performance optimization. LePure Biotech, 3M, LabLogic, Parker, Shuoboda Instruments Group, Saicheng Electronic, Qingdao Junray intelligent Instrument, Zhejiang Tailin Bioengineering, Cobetter, Shanghai Lepure, Neuronbc, and Hangzhou Darlly Filtration Equipment offer specialized manufacturing expertise, testing reliability, and comprehensive product development across global and regional market segments.
| Items | Values |
|---|---|
| Quantitative Units | USD 168.5 million |
| Test System Type | Bubble Point Test Systems, Diffusion Test Systems, Pressure Drop Test Systems, Water Intrusion Test (WIT) Systems, Multipurpose Test Systems |
| Application | Pharmaceuticals, Biotechnology, Food & Beverage, Others |
| Regions Covered | North America, Europe, East Asia, South Asia & Pacific, Latin America, Middle East & Africa |
| Country Covered | China, India, Germany, Brazil, United States, United Kingdom, Japan, and 40+ countries |
| Key Companies Profiled | Merck, Meissner Filtration Product, Sartorius, Flow Test GmbH, Cytiva, Labnics, iPHASE Technologies, LePure Biotech, 3M, LabLogic, Parker, Shuoboda Instruments Group, Saicheng Electronic, Qingdao Junray intelligent Instrument, Zhejiang Tailin Bioengineering, Cobetter, Shanghai Lepure, Neuronbc, Hangzhou Darlly Filtration Equipment |
| Additional Attributes | Dollar sales by test system type and application segment, regional demand trends across major pharmaceutical markets, competitive landscape with established testing equipment manufacturers and emerging technology providers, customer preferences for different validation capabilities and automation options, integration with pharmaceutical quality control workflows and regulatory compliance protocols, innovations in testing methodology efficiency and automation technology advancements, and adoption of multipurpose testing features with enhanced validation performance capabilities for improved quality assurance workflows. |
The global filter integrity test systems market is estimated to be valued at USD 168.5 million in 2025.
The market size for the filter integrity test systems market is projected to reach USD 264.1 million by 2035.
The filter integrity test systems market is expected to grow at a 4.6% CAGR between 2025 and 2035.
The key product types in filter integrity test systems market are bubble point test systems, diffusion test systems, pressure drop test systems, water intrusion test (wit) systems and multipurpose test systems.
In terms of application, pharmaceuticals segment to command 60.0% share in the filter integrity test systems market in 2025.


Our Research Products

The "Full Research Suite" delivers actionable market intel, deep dives on markets or technologies, so clients act faster, cut risk, and unlock growth.

The Leaderboard benchmarks and ranks top vendors, classifying them as Established Leaders, Leading Challengers, or Disruptors & Challengers.

Locates where complements amplify value and substitutes erode it, forecasting net impact by horizon

We deliver granular, decision-grade intel: market sizing, 5-year forecasts, pricing, adoption, usage, revenue, and operational KPIs—plus competitor tracking, regulation, and value chains—across 60 countries broadly.

Spot the shifts before they hit your P&L. We track inflection points, adoption curves, pricing moves, and ecosystem plays to show where demand is heading, why it is changing, and what to do next across high-growth markets and disruptive tech

Real-time reads of user behavior. We track shifting priorities, perceptions of today’s and next-gen services, and provider experience, then pace how fast tech moves from trial to adoption, blending buyer, consumer, and channel inputs with social signals (#WhySwitch, #UX).

Partner with our analyst team to build a custom report designed around your business priorities. From analysing market trends to assessing competitors or crafting bespoke datasets, we tailor insights to your needs.
Supplier Intelligence
Discovery & Profiling
Capacity & Footprint
Performance & Risk
Compliance & Governance
Commercial Readiness
Who Supplies Whom
Scorecards & Shortlists
Playbooks & Docs
Category Intelligence
Definition & Scope
Demand & Use Cases
Cost Drivers
Market Structure
Supply Chain Map
Trade & Policy
Operating Norms
Deliverables
Buyer Intelligence
Account Basics
Spend & Scope
Procurement Model
Vendor Requirements
Terms & Policies
Entry Strategy
Pain Points & Triggers
Outputs
Pricing Analysis
Benchmarks
Trends
Should-Cost
Indexation
Landed Cost
Commercial Terms
Deliverables
Brand Analysis
Positioning & Value Prop
Share & Presence
Customer Evidence
Go-to-Market
Digital & Reputation
Compliance & Trust
KPIs & Gaps
Outputs
Full Research Suite comprises of:
Market outlook & trends analysis
Interviews & case studies
Strategic recommendations
Vendor profiles & capabilities analysis
5-year forecasts
8 regions and 60+ country-level data splits
Market segment data splits
12 months of continuous data updates
DELIVERED AS:
PDF EXCEL ONLINE
Filter Bag Market Size and Share Forecast Outlook 2025 to 2035
Filter Press Solutions Market Size and Share Forecast Outlook 2025 to 2035
Filter Coatings Market Size and Share Forecast Outlook 2025 to 2035
Industry Share Analysis for Filter Paper Companies
Filter Paper Market Trends – Growth, Demand & Forecast through 2035
RF Filters Market Size and Share Forecast Outlook 2025 to 2035
SAW Filter Market Size and Share Forecast Outlook 2025 to 2035
Air Filters Market Growth - Trends & Forecast 2025 to 2035
Global Tea Filter Paper Market Analysis – Growth & Forecast 2024-2034
Spin Filters Market Size and Share Forecast Outlook 2025 to 2035
Wine Filtering Machine Market Expansion - Filtration & Winemaking Technology 2025 to 2035
Beer Filter System Market insights by Equipment Type, Type, Filtration Process, Application, and Region 2025 to 2035
EMI, Filter Kits Market
ePTFE Filter Film Market Size and Share Forecast Outlook 2025 to 2035
Candle Filter Cartridges Market Size and Share Forecast Outlook 2025 to 2035
Coffee Filter Paper Market Size and Share Forecast Outlook 2025 to 2035
Fabric Filter System Market Size & Forecast 2025 to 2035
Market Share Distribution Among Coffee Filter Paper Manufacturers
TC-SAW Filter Market
Gelatin Filters Market Size and Share Forecast Outlook 2025 to 2035

Thank you!
You will receive an email from our Business Development Manager. Please be sure to check your SPAM/JUNK folder too.
Chat With
MaRIA