Flatback Tapes Market
Market Insights on Flatback Tapes covering sales outlook, demand forecast & up-to-date key trends
Flatback Tapes Market By Adhesive (Acrylic, Silicon, Rubber, and Others), Product (Single Side, and Double Side), Application (Splicing, Packaging, Masking, and Tabbing), Thickness (< 10 Mil, 10 Mil to 15 Mil, and > 15 Mil) & Region - Forecast to 2022 - 2027
Flatback Tapes Market Snapshot
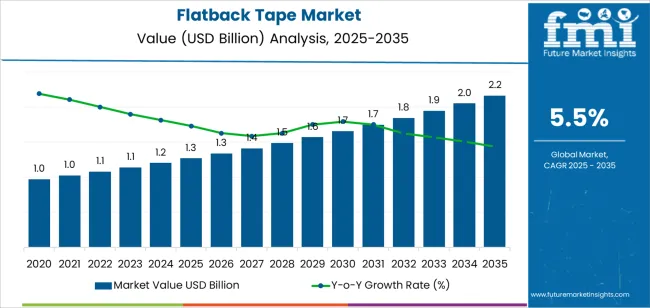
[221 Pages Report] The flatback tapes market is estimated at USD 1.1 billion in 2022 and is projected to reach USD 1.5 billion by 2027, at a CAGR of 5.9% from 2022 to 2027.
Market Size 2022 |
US$ 1.1 Bn |
Market Size 2027 |
US$ 1.5 Bn |
Value CAGR (2022-2027) |
5.9% |
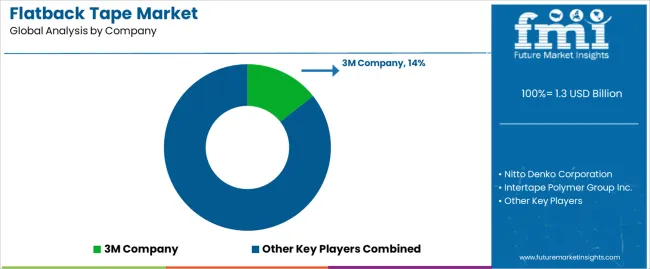
Collective Value Share: Top 5 Companies (2021A) |
30% |
In the flatback tapes market, the silicon and rubber segments are collectively generating revenue of USD 980 million in 2022, according to the Annual Market Analysis conducted by Future Market Insights.
The FMI team also predicts that the China flatback tapes market would grow by 8.5% year over year during the forecast period, defying initial uncertainty about how the market would perform during a global pandemic. Total flatback tapes sales in Asia Pacific excl. Japan is expected to reach USD 517.9 million in 2022.
Flatback Tapes is expected to hold 2.4% share of the overall tapes market of US$ 41.6 Bn in 2021.
Let us know your requirement to get
100% FREE customization
How The Market Progressed Till June 2022?
Particulars |
Details |
H1 2021 |
5.9% |
H1 2022 Projected |
6.0% |
H1 2022 Expected |
6.2% |
BPS Change - H1, 2022 (O) – H1, 2022 (P) |
(+) 20 ↑ |
BPS Change – H1, 2022 (O) – H1, 2021 |
(+) 30 ↑ |
Future Market Insights predict a comparison and review analysis of the dynamics of the flatback tapes market, which is principally subjected to an array of industry factors along with a few definite impacts about the inferior strength compared to welding, brazing, or mechanical fastening.
The advances that have taken place in the market are the use of advanced acrylic adhesives in single-sided and double-sided flatback tapes to maintain integrity and stability of the product. In April 2022, 3M Company announced its collaboration with Innovative Automation Inc. This will help customers to automate key bonding applications with Robotic Tape System in VHB™ Tapes.
The market for flatback tapes is expected to surge by 30 basis share points (BPS) in H1-2022 (O) against comparison with H1-2021, according to an FMI analysis. However, when comparing H1-2022 projected and H1-2022 outlook period, a rise in BPS change by 20 BPS has been noticed.
The flatback tapes market is estimated to experience a rise in market share during the forecast period due to its multipurpose features such as solvent & thinner resistance, high tensile strength, and absolute residue removal.
Flatback tapes are in high demand because they can be used on paper, glass, wood, metal, plastic, and other delicate surfaces. Flatback tapes are becoming more popular for light and heavy-duty applications all around the world, which is propelling the flatback tapes market growth.
Historic And Forecast Market Outlook For Flatback Tapes
The global flatback tapes market is estimated to experience decent growth during to coming years on the back of its exceptional sealing and packaging characteristics and affordable packaging outlook. The flatback tapes market is projected to rise at ~5.9% CAGR during the forecast period in comparison to the 5.2% CAGR during historical period.
Adhesives such as acrylic, silicone, and rubber adhesive used in flatback tapes, makes these tapes a preferred bonding solution among the other alternatives. This advance adhesive technology is replacing the traditional liquid and spray adhesives, mechanical fasteners, and other bonding and fastening systems. It is unlike conventional adhesives, which tend to bleed at the edges.
Advanced acrylic adhesives are used in single-sided and double-sided flatback tapes to maintain stability and integrity during processing.
How The High Preference For Specialty Tapes Due To Superior Durability And Ease Of Applicability Will Bolster Growth For Flatback Tapes Market?
Flatback tapes are predominantly used in industries such as shipping & logistics, building & construction, electrical & electronics, automotive, metalworking, oil & gas for numerous applications such as masking, sealing, splicing, packaging, masking, tabbing, and many more.
These flatback tapes have massive demand in the market as it offers versatile features such as high tensile strength, solvent & thinner resistance, easy curving, and absolute residue removal. Furthermore, these industrial tapes are capable of to sustain in outdoor applications, especially in construction and logistics industries which further raise its popularity and adoption among the end users.
In addition, the demand for flatback tapes is touching new heights as they can be used on paper, glass, wood, metal, plastic, and other sensitive surfaces. Rising adoption of flatback tapes for light and heavy-duty applications across the globe is supporting the flatback tapes market growth. flatback tapes, especially packaging tapes and specialty tapes, has emerged as the most economical and efficient solution for indoor activities.
The usage of flatback tapes has enabled people to continue packaging and paint jobs with the utmost precision even at the sharp edges, due to its availability for extra thin paper. These factors are likely to bolster the market growth of the flatback tapes substantially. Furthermore, striking adoption for flatback tapes for low-temperature ranges applications is anticipated to fuels the growth for flatback tapes market during the forecast period.
Find your sweet spots for generating winning opportunities in this market.
Talk to AnalystWhat Is The Repercussion Of COVID-19 Pandemic On The Global Flatback Tapes Market?
During the COVID-19 pandemic, online delivery platforms gained popularity among consumers due to safe and secure delivery of products. The pandemic has mixed impact on flatback tapes market, as some industries like building & constructions, automotive have seen negative demand, whereas food industry has observed colossal demand flatback tapes in the market.
The flatback tapes are used for packaging of essential products which needs safe and secure packaging due to which the sales of flatback tapes is anticipated to fuel during the forecast period.
Flatback Tapes Market - Country-Wise Insights
How will Germany Drive the Market for Masking Tapes?
Germany will hold market share of around 26% for the Western Europe flatback tapes market in the year 2022. The penetration of the various industrial sector coupled with increased usage of semiconductor equipment in the manufacturing sector, the demand for flatback tapes is anticipated to propel during the forecast period.
The increasing growth of the electrical & electronic industry in Europe augment the sales of flatback tapes. According to the European Adhesive Tape Association (Afrea), the electronic sector holds 16% of the total speciality tape market. This indicated that the growing electrical and electronics industry in European countries increases the demand for flatback tapes.
How will United States Generate Market Growth Opportunity for Flatback Tapes?
The United States market for flatback tapes shall grow at a CAGR of 3.7% during the forecast period. United States holds a major part of the North America flatback tapes market which accounts for second largest share of the market.
The United States is projected to be the most attractive market for flatback tapes due to the growing building & construction industry. According to the Associated General Contractors of America (AGC), in 2019 the contribution of U.S. construction industry was 4.1% of the total U.S. GDP. Also, the construction spending in U.S. is much higher than other American and European countries.
In 2019, the residential construction spending totaled around US$ 551 billion in 2019. This indicates the growth opportunity for the flatback tapes market in North American countries, including the United Sates.

A unified Market Research Subscription Platform, built for today's disparate research needs.
Flatback Tapes Market - Category-Wise Insights
Why the Rubber Adhesive Segment is considered to be the Most Lucrative Segment in Flatback Tapes Market?
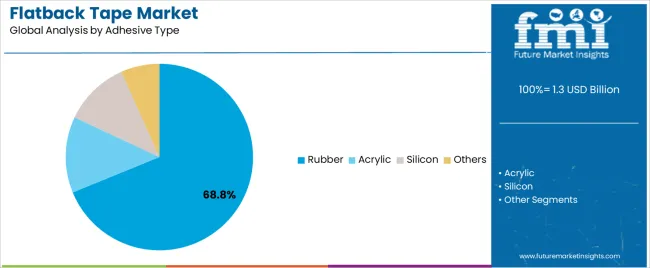
Based on the adhesive, the rubber segment holds the largest share of the market. The targeted segment is anticipated to hold around 68% of the market share in 2022. The reason behind the same is the rubber adhesive costs low compared to all other adhesives. Due to its high tacking strength, low cost and high product life it is extensively used in flatback tapes manufacturing.
Why the Splicing is the Leading Segment based on Application in the Global Flatback Tapes Market?
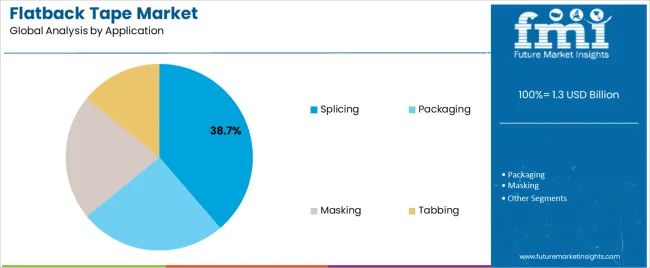
Based on application, the splicing segment is estimated to remain the leading segment among the other segment and shall grow at a CAGR of 6.5% during the forecast period. The same segment is estimated to hold around 38% of the market share in 2022. Moreover, masking segment is estimated to hold around 31% of the market share in North America followed by japan in 2022.
Which is the Most Desired Thickness for Construction Tapes?
By thickness, the 10 Mil to 15 Mil segment is estimated to be the leading segment at a CAGR of 6.0% during the forecast period followed by the < 10 Mil segment and is estimated to hold around 33.2% of the market share in 2022.
Flatback Tapes Market - Competitive Landscape
The key manufacturers operating in flatback tapes market are trying to focus on increasing their production capacity to meet the increasing demand for flatback tapes. Moreover, the key players are increasing their product portfolio to cater for the growing flatback tapes market.
- In March 2021, Intertape Polymer Group Inc. expanded its capstone facility in India to cater to the Indian market.
- In April 2021, Tesa SE Group introduced bio-based materials for their adhesive taps. The company’s new package tapes featuring the EcoLogo: tesapack® Bio & Strong and tesapack® Paper Standard.
- In October 2021, a company named Ahlstrom-Munksjö, launched a dedicated product range MasterTape™ Pack of sustainable backing solutions tape. The tapes are offered in a extensive variety of saturation base papers with different weight and mechanical properties
Scope Of Report
Attribute |
Details |
Forecast Period |
2022-2027 |
Historical Data Available for |
2012-2021 |
Market Analysis |
US$ Million for Value and Mn Sq. m for Volume |
Key Regions Covered |
North America, Latin America, Western Europe, Eastern Europe, the Middle East & Africa, Asia Pacific excl. Japan, and Japan |
Key Countries Covered |
US, Canada, Brazil, Mexico, Germany, Italy, France, U.K., Spain, Russia, GCC Countries, China, India, and Australia & New Zealand, ASEAN |
Key Segments Covered |
Adhesive, Product, Application, Thickness and Region |
Key Companies Profiled |
|
Report Coverage |
Market Forecast, Company Share Analysis, Competition Intelligence, DROT Analysis, Market Dynamics and Challenges, and Strategic Growth Initiatives |
Customization & Pricing |
Available upon Request |
Flatback Tapes Market By Category
By Adhesive :
- Acrylic Flatback Tapes
- Silicon Flatback Tapes
- Rubber Flatback Tapes
- Others Flatback Tapes
By Product :
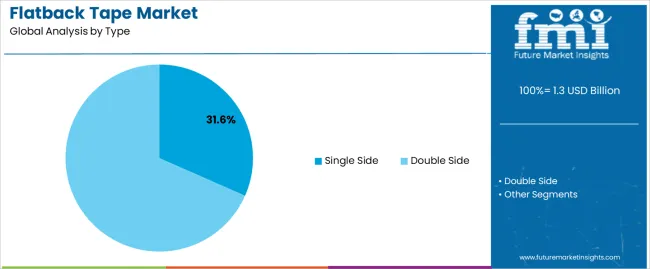
- Single Side Flatback Tapes
- Double Side Flatback Tapes
By Application :
- Splicing
- Packaging
- Masking
- Tabbing
By Thickness :
- < 10 Mil
- 10 Mil to 15 Mil
- > 15 Mil
By Region :
- North America
- Latin America
- Western Europe
- Eastern Europe
- Middle East and Africa (MEA)
- Asia Pacific excl. Japan
- Japan
Frequently Asked Questions
Splicing & masking are the major applications of flatback tapes. Growing paper, core and tube industry is expected to drive these two segments. Recovery in automotive sector and growth in electronics industry is driving the demand for gummed tapes for masking application.
APEJ and North America are the top two regions to focus for the market opportunity of the flatback tapes market. The market in Asia Pacific is expected to expand, led by rapid industrialization and increase in global trade.
Rubber adhesive costs low compared to all other adhesives with 68.2% market share in 2022. Due to its high tacking strength, low cost and high product life it is extensively used in flatback tapes manufacturing.
The global market for flatback tapes indicated a YoY growth of 5.2% in the last nine years from 2012 to 2021.
Flatback tapes are outperforming the substitutive products for splicing & tabbing applications. As these tapes with high strength, thickness and low elongation have low tear strength and are very much suitable for splicing application.
Table of Content
1. Market Overview
1.1. Market Definition
1.2. Market Coverage
2. Key Market Trends
2.1. Key Trends Impacting the Market
2.2. Product Innovation / Development Trends
3. Key Success Factors
3.1. Product Adoption Analysis
3.2. Product USPs / Features
4. Global Flatback Tapes Market Demand Analysis 2012-2021 and Forecast, 2022-2027
4.1. Historical Market Volume (Mn Sq. m) Analysis, 2012-2021
4.2. Current and Future Market Volume (Mn Sq. m) Projections, 2022-2027
4.3. Y-o-Y Growth Trend Analysis
5. Global Flatback Tapes Market - Pricing Analysis
5.1. Regional Pricing Analysis, By Adhesive Type
5.2. Pricing Break-up
5.3. Global Average Pricing Analysis Benchmark
6. Global Flatback Tapes Market Demand (US$ Mn) Analysis 2012-2021 and Forecast, 2022-2027
6.1. Historical Market Value (US$ Mn) Analysis, 2012-2021
6.2. Current and Future Market Value (US$ Mn) Projections, 2022-2027
6.2.1. Y-o-Y Growth Trend Analysis
6.2.2. Absolute $ Opportunity Analysis
7. Market Background
7.1. Global Packaging Market Overview
7.2. Global Flexible Packaging Market Overview
7.3. Macro-Economic Factors & Co-relation Analysis
7.3.1. Manufacturing Value Added
7.3.2. Packaging Industry
7.3.3. Growth of Building & Constructions Industry
7.4. Forecast Factors - Relevance & Impact
7.4.1. Manufacturing Value Added
7.4.2. Segmental Revenue Growth of Key Players
7.4.3. Packaging Industry Growth and Market Assessment
7.4.4. Automotive Industry Growth and Market Assessment
7.4.5. Building & Constructions Industry Growth and Market Assessment
7.5. Value Chain Analysis
7.5.1. Key Participants
7.5.1.1. Raw Material Suppliers
7.5.1.2. Flatback Tapes Manufacturers
7.5.1.3. Distributors
7.5.1.4. End Users
7.5.2. Profitability Margin
7.6. Market Dynamics
7.6.1. Drivers
7.6.2. Restraints
7.6.3. Opportunity Analysis
8. Impact of COVID-19
8.1. Current Statistics and Probable Future Impact
8.2. Impact of COVID-19 on Flatback Tapes Market
9. Global Flatback Tapes Market Analysis 2012-2021 and Forecast 2022-2027, By Adhesive
9.1. Introduction
9.2. Historical Market Size (US$ Mn) and Volume (Mn Sq. m) Analysis, By Adhesive, 2012-2021
9.3. Current and Future Market Size (US$ Mn) and Volume (Mn Sq. m) Analysis and Forecast, By Adhesive, 2022-2027
9.3.1. Acrylic Flatback Tapes
9.3.2. Silicon Flatback Tapes
9.3.3. Rubber Flatback Tapes
9.3.4. Others Flatback Tapes
9.4. Market Attractiveness Analysis, By Adhesive
10. Global Flatback Tapes Market Analysis 2012-2021 and Forecast 2022-2027, By Product
10.1. Introduction
10.2. Historical Market Size (US$ Mn) and Volume (Mn Sq. m) Analysis, By Product, 2012-2021
10.3. Current and Future Market Size (US$ Mn) and Volume (Mn Sq. m) Analysis and Forecast, By Product, 2022-2027
10.3.1. Single Side Flatback Tapes
10.3.2. Double Side Flatback Tapes
10.4. Market Attractiveness Analysis, By Product
11. Global Flatback Tapes Market Analysis 2012-2021 and Forecast 2022-2027, By Application
11.1. Introduction
11.2. Historical Market Size (US$ Mn) and Volume (Mn Sq. m) Analysis, By Application, 2012-2021
11.3. Current and Future Market Size (US$ Mn) and Volume (Mn Sq. m) Analysis and Forecast, By Application, 2022-2027
11.3.1. Splicing
11.3.2. Packaging
11.3.3. Masking
11.3.4. Tabbing
11.4. Market Attractiveness Analysis, By Application
12. Global Flatback Tapes Market Analysis 2012-2021 and Forecast 2022-2027, By Thickness
12.1. Introduction
12.2. Historical Market Size (US$ Mn) and Volume (Mn Sq. m) Analysis, By Thickness, 2012-2021
12.3. Current and Future Market Size (US$ Mn) and Volume (Mn Sq. m) Analysis and Forecast, By Thickness, 2022-2027
12.3.1. < 10 Mil
12.3.2. 10 Mil to 15 Mil
12.3.3. > 15 Mil
12.4. Market Attractiveness Analysis, By Thickness
13. Global Flatback Tapes Market Analysis 2012-2021 and Forecast 2022-2027, by Region
13.1. Introduction
13.2. Historical Market Size (US$ Mn) and Volume (Mn Sq. m) Analysis, by Region, 2012-2021
13.3. Current Market Size (US$ Mn) and Volume (Mn Sq. m) Analysis and Forecast, by Region, 2022-2027
13.3.1. North America
13.3.2. Latin America
13.3.3. Western Europe
13.3.4. Eastern Europe
13.3.5. Middle East and Africa (MEA)
13.3.6. Asia Pacific excl. Japan (APEJ)
13.3.7. Japan
13.4. Market Attractiveness Analysis, by Region
14. North America Flatback Tapes Market Analysis 2012-2021 and Forecast 2022-2027
14.1. Introduction
14.2. Historical Market Size (US$ Mn) and Volume (Mn Sq. m) Trend Analysis, by Market Taxonomy, 2012-2021
14.3. Market Size (US$ Mn) and Volume (Mn Sq. m) Forecast, by Market Taxonomy, 2022-2027
14.3.1. By Country
14.3.1.1. U.S.
14.3.1.2. Canada
14.3.2. By Adhesive
14.3.3. By Product
14.3.4. By Application
14.3.5. By Thickness
14.4. Market Attractiveness Analysis
14.4.1. By Country
14.4.2. By Adhesive
14.4.3. By Product
14.4.4. By Application
14.4.5. By Thickness
14.5. Key Market Participants – Intensity Mapping
15. Latin America Flatback Tapes Market Analysis 2012-2021 and Forecast 2022-2027
15.1. Introduction
15.2. Historical Market Size (US$ Mn) and Volume (Mn Sq. m) Trend Analysis, by Market Taxonomy, 2012-2021
15.3. Market Size (US$ Mn) and Volume (Mn Sq. m) Forecast, by Market Taxonomy, 2022-2027
15.3.1. By Country
15.3.1.1. Brazil
15.3.1.2. Mexico
15.3.1.3. Argentina
15.3.1.4. Rest of Latin America
15.3.2. By Adhesive
15.3.3. By Product
15.3.4. By Application
15.3.5. By Thickness
15.4. Market Attractiveness Analysis
15.4.1. By Country
15.4.2. By Adhesive
15.4.3. By Product
15.4.4. By Application
15.4.5. By Thickness
15.5. Key Market Participants – Intensity Mapping
16. Western Europe Flatback Tapes Market Analysis 2012-2021 and Forecast 2022-2027
16.1. Introduction
16.2. Historical Market Size (US$ Mn) and Volume (Mn Sq. m) Trend Analysis, by Market Taxonomy, 2012-2021
16.3. Market Size (US$ Mn) and Volume (Mn Sq. m) Forecast, by Market Taxonomy, 2022-2027
16.3.1. By Country
16.3.1.1. Germany
16.3.1.2. Italy
16.3.1.3. France
16.3.1.4. U.K.
16.3.1.5. Spain
16.3.1.6. BENELUX
16.3.1.7. Nordic
16.3.1.8. Rest of Western Europe
16.3.2. By Adhesive
16.3.3. By Product
16.3.4. By Application
16.3.5. By Thickness
16.4. Market Attractiveness Analysis
16.4.1. By Country
16.4.2. By Adhesive
16.4.3. By Product
16.4.4. By Application
16.4.5. By Thickness
16.5. Key Market Participants – Intensity Mapping
17. Eastern Europe Flatback Tapes Market Analysis 2012-2021 and Forecast 2022-2027
17.1. Introduction
17.2. Historical Market Size (US$ Mn) and Volume (Mn Sq. m) Trend Analysis, by Market Taxonomy, 2012-2021
17.3. Market Size (US$ Mn) and Volume (Mn Sq. m) Forecast, by Market Taxonomy, 2022-2027
17.3.1. By Country
17.3.1.1. Poland
17.3.1.2. Russia
17.3.1.3. Rest of Eastern Europe
17.3.2. By Adhesive
17.3.3. By Product
17.3.4. By Application
17.3.5. By Thickness
17.4. Market Attractiveness Analysis
17.4.1. By Country
17.4.2. By Adhesive
17.4.3. By Product
17.4.4. By Application
17.4.5. By Thickness
17.5. Key Market Participants – Intensity Mapping
18. Middle East and Africa Flatback Tapes Market Analysis 2012-2021 and Forecast 2022-2027
18.1. Introduction
18.2. Historical Market Size (US$ Mn) and Volume (Mn Sq. m) Trend Analysis, by Market Taxonomy, 2012-2021
18.3. Market Size (US$ Mn) and Volume (Mn Sq. m) Forecast, by Market Taxonomy, 2022-2027
18.3.1. By Country
18.3.1.1. GCC Countries
18.3.1.2. South Africa
18.3.1.3. North Africa
18.3.1.4. Rest of Middle East and Africa
18.3.2. By Adhesive
18.3.3. By Product
18.3.4. By Application
18.3.5. By Thickness
18.4. Market Attractiveness Analysis
18.4.1. By Country
18.4.2. By Adhesive
18.4.3. By Product
18.4.4. By Application
18.4.5. By Thickness
18.5. Key Market Participants – Intensity Mapping
19. Asia Pacific excl. Japan Flatback Tapes Market Analysis 2012-2021 and Forecast 2022-2027
19.1. Introduction
19.2. Historical Market Size (US$ Mn) and Volume (Mn Sq. m) Trend Analysis, by Market Taxonomy, 2012-2021
19.3. Market Size (US$ Mn) and Volume (Mn Sq. m) Forecast, by Market Taxonomy, 2022-2027
19.3.1. By Country
19.3.1.1. China
19.3.1.2. India
19.3.1.3. Australia & New Zealand
19.3.1.4. ASEAN
19.3.1.5. Rest of APEJ
19.3.2. By Adhesive
19.3.3. By Product
19.3.4. By Application
19.3.5. By Thickness
19.4. Market Attractiveness Analysis
19.4.1. By Country
19.4.2. By Adhesive
19.4.3. By Product
19.4.4. By Application
19.4.5. By Thickness
19.5. Key Market Participants – Intensity Mapping
20. Japan Flatback Tapes Market Analysis 2012-2021 and Forecast 2022-2027
20.1. Introduction
20.2. Historical Market Size (US$ Mn) and Volume (Mn Sq. m) Trend Analysis, by Market Taxonomy, 2012-2021
20.3. Market Size (US$ Mn) and Volume (Mn Sq. m) Forecast, by Market Taxonomy, 2022-2027
20.3.1. By Adhesive
20.3.2. By Product
20.3.3. By Application
20.3.4. By Thickness
20.4. Market Attractiveness Analysis
20.4.1. By Adhesive
20.4.2. By Product
20.4.3. By Application
20.4.4. By Thickness
20.5. Key Market Participants – Intensity Mapping
21. Flatback Tapes Market Country wise Analysis 2022 & 2027
21.1. U.S. Flatback Tapes Market Analysis
21.1.1. Introduction
21.1.2. Market Value Proportion Analysis, by Market Taxonomy
21.1.3. Market Volume (Mn Sq. m) and Value (US$ Mn) Analysis and Forecast, by Market Taxonomy
21.1.3.1. By Adhesive
21.1.3.2. By Product
21.1.3.3. By Application
21.1.3.4. By Thickness
21.2. Canada Flatback Tapes Market Analysis
21.2.1. Introduction
21.2.2. Market Value Proportion Analysis, by Market Taxonomy
21.2.3. Market Volume (Mn Sq. m) and Value (US$ Mn) Analysis and Forecast, by Market Taxonomy
21.2.3.1. By Adhesive
21.2.3.2. By Product
21.2.3.3. By Application
21.2.3.4. By Thickness
21.3. Brazil Flatback Tapes Market Analysis
21.3.1. Introduction
21.3.2. Market Value Proportion Analysis, by Market Taxonomy
21.3.3. Market Volume (Mn Sq. m) and Value (US$ Mn) Analysis and Forecast, by Market Taxonomy
21.3.3.1. By Adhesive
21.3.3.2. By Product
21.3.3.3. By Application
21.3.3.4. By Thickness
21.4. Mexico Flatback Tapes Market Analysis
21.4.1. Introduction
21.4.2. Market Value Proportion Analysis, by Market Taxonomy
21.4.3. Market Volume (Mn Sq. m) and Value (US$ Mn) Analysis and Forecast, by Market Taxonomy
21.4.3.1. By Adhesive
21.4.3.2. By Product
21.4.3.3. By Application
21.4.3.4. By Thickness
21.5. Germany Flatback Tapes Market Analysis
21.5.1. Introduction
21.5.2. Market Value Proportion Analysis, by Market Taxonomy
21.5.3. Market Volume (Mn Sq. m) and Value (US$ Mn) Analysis and Forecast, by Market Taxonomy
21.5.3.1. By Adhesive
21.5.3.2. By Product
21.5.3.3. By Application
21.5.3.4. By Thickness
21.6. Italy Flatback Tapes Market Analysis
21.6.1. Introduction
21.6.2. Market Value Proportion Analysis, by Market Taxonomy
21.6.3. Market Volume (Mn Sq. m) and Value (US$ Mn) Analysis and Forecast, by Market Taxonomy
21.6.3.1. By Adhesive
21.6.3.2. By Product
21.6.3.3. By Application
21.6.3.4. By Thickness
21.7. France Flatback Tapes Market Analysis
21.7.1. Introduction
21.7.2. Market Value Proportion Analysis, by Market Taxonomy
21.7.3. Market Volume (Mn Sq. m) and Value (US$ Mn) Analysis and Forecast, by Market Taxonomy
21.7.3.1. By Adhesive
21.7.3.2. By Product
21.7.3.3. By Application
21.7.3.4. By Thickness
21.8. U.K. Flatback Tapes Market Analysis
21.8.1. Introduction
21.8.2. Market Value Proportion Analysis, by Market Taxonomy
21.8.3. Market Volume (Mn Sq. m) and Value (US$ Mn) Analysis and Forecast, by Market Taxonomy
21.8.3.1. By Adhesive
21.8.3.2. By Product
21.8.3.3. By Application
21.8.3.4. By Thickness
21.9. Spain Flatback Tapes Market Analysis
21.9.1. Introduction
21.9.2. Market Value Proportion Analysis, by Market Taxonomy
21.9.3. Market Volume (Mn Sq. m) and Value (US$ Mn) Analysis and Forecast, by Market Taxonomy
21.9.3.1. By Adhesive
21.9.3.2. By Product
21.9.3.3. By Application
21.9.3.4. By Thickness
21.10. Russia Flatback Tapes Market Analysis
21.10.1. Introduction
21.10.2. Market Value Proportion Analysis, by Market Taxonomy
21.10.3. Market Volume (Mn Sq. m) and Value (US$ Mn) Analysis and Forecast, by Market Taxonomy
21.10.3.1. By Adhesive
21.10.3.2. By Product
21.10.3.3. By Application
21.10.3.4. By Thickness
21.11. GCC Countries Flatback Tapes Market Analysis
21.11.1. Introduction
21.11.2. Market Value Proportion Analysis, by Market Taxonomy
21.11.3. Market Volume (Mn Sq. m) and Value (US$ Mn) Analysis and Forecast, by Market Taxonomy
21.11.3.1. By Adhesive
21.11.3.2. By Product
21.11.3.3. By Application
21.11.3.4. By Thickness
21.12. China Flatback Tapes Market Analysis
21.12.1. Introduction
21.12.2. Market Value Proportion Analysis, by Market Taxonomy
21.12.3. Market Volume (Mn Sq. m) and Value (US$ Mn) Analysis and Forecast, by Market Taxonomy
21.12.3.1. By Adhesive
21.12.3.2. By Product
21.12.3.3. By Application
21.12.3.4. By Thickness
21.13. India Flatback Tapes Market Analysis
21.13.1. Introduction
21.13.2. Market Value Proportion Analysis, by Market Taxonomy
21.13.3. Market Volume (Mn Sq. m) and Value (US$ Mn) Analysis and Forecast, by Market Taxonomy
21.13.3.1. By Adhesive
21.13.3.2. By Product
21.13.3.3. By Application
21.13.3.4. By Thickness
21.14. Australia Flatback Tapes Market Analysis
21.14.1. Introduction
21.14.2. Market Value Proportion Analysis, by Market Taxonomy
21.14.3. Market Volume (Mn Sq. m) and Value (US$ Mn) Analysis and Forecast, by Market Taxonomy
21.14.3.1. By Adhesive
21.14.3.2. By Product
21.14.3.3. By Application
21.14.3.4. By Thickness
22. Market Structure Analysis
22.1. Market Analysis, by Tier of Flatback Tapes Companies
22.2. Market Share Analysis of Top Players
22.3. Market Presence Analysis
23. Competition Analysis
23.1. Competition Dashboard
23.2. Competition Benchmarking
23.3. Competition Deep Dive
23.3.1. 3M Company
23.3.1.1. Overview
23.3.1.2. Product Portfolio
23.3.1.3. Profitability by Market Segments
23.3.1.4. Sales Footprint
23.3.1.5. Strategy Overview
23.3.1.5.1. Marketing Strategy
23.3.1.5.2. Product Strategy
23.3.1.5.3. Channel Strategy
23.3.2. Intertape Polymer Group Inc.
23.3.2.1. Overview
23.3.2.2. Product Portfolio
23.3.2.3. Profitability by Market Segments
23.3.2.4. Sales Footprint
23.3.2.5. Strategy Overview
23.3.2.5.1. Marketing Strategy
23.3.2.5.2. Product Strategy
23.3.2.5.3. Channel Strategy
23.3.3. Shurtape Technologies LLC
23.3.3.1. Overview
23.3.3.2. Product Portfolio
23.3.3.3. Profitability by Market Segments
23.3.3.4. Sales Footprint
23.3.3.5. Strategy Overview
23.3.3.5.1. Marketing Strategy
23.3.3.5.2. Product Strategy
23.3.3.5.3. Channel Strategy
23.3.4. tesa SE Group
23.3.4.1. Overview
23.3.4.2. Product Portfolio
23.3.4.3. Profitability by Market Segments
23.3.4.4. Sales Footprint
23.3.4.5. Strategy Overview
23.3.4.5.1. Marketing Strategy
23.3.4.5.2. Product Strategy
23.3.4.5.3. Channel Strategy
23.3.5. Nitto Denko Corp
23.3.5.1. Overview
23.3.5.2. Product Portfolio
23.3.5.3. Profitability by Market Segments
23.3.5.4. Sales Footprint
23.3.5.5. Strategy Overview
23.3.5.5.1. Marketing Strategy
23.3.5.5.2. Product Strategy
23.3.5.5.3. Channel Strategy
23.3.6. Scapa Group plc.
23.3.6.1. Overview
23.3.6.2. Product Portfolio
23.3.6.3. Profitability by Market Segments
23.3.6.4. Sales Footprint
23.3.6.5. Strategy Overview
23.3.6.5.1. Marketing Strategy
23.3.6.5.2. Product Strategy
23.3.6.5.3. Channel Strategy
23.3.7. Pro Tapes & Specialties, Inc.
23.3.7.1. Overview
23.3.7.2. Product Portfolio
23.3.7.3. Profitability by Market Segments
23.3.7.4. Sales Footprint
23.3.7.5. Strategy Overview
23.3.7.5.1. Marketing Strategy
23.3.7.5.2. Product Strategy
23.3.7.5.3. Channel Strategy
23.3.8. Canadian Technical Tape Ltd.
23.3.8.1. Overview
23.3.8.2. Product Portfolio
23.3.8.3. Profitability by Market Segments
23.3.8.4. Sales Footprint
23.3.8.5. Strategy Overview
23.3.8.5.1. Marketing Strategy
23.3.8.5.2. Product Strategy
23.3.8.5.3. Channel Strategy
23.3.9. Kruse Adhesive Tape, Inc.
23.3.9.1. Overview
23.3.9.2. Product Portfolio
23.3.9.3. Profitability by Market Segments
23.3.9.4. Sales Footprint
23.3.9.5. Strategy Overview
23.3.9.5.1. Marketing Strategy
23.3.9.5.2. Product Strategy
23.3.9.5.3. Channel Strategy
23.3.10. SKC Co., Ltd
23.3.10.1. Overview
23.3.10.2. Product Portfolio
23.3.10.3. Profitability by Market Segments
23.3.10.4. Sales Footprint
23.3.10.5. Strategy Overview
23.3.10.5.1. Marketing Strategy
23.3.10.5.2. Product Strategy
23.3.10.5.3. Channel Strategy
24. Assumptions and Acronyms Used
25. Research Methodology
Let us know your requirement to get
100% FREE customization
List of Tables
Table 01: Global Flatback Tapes Market Volume (Mn Sq. m) Analysis, by Adhesive 2012(H)-2027(F)
Table 02: Global Flatback Tapes Market Value (US$ Mn) Analysis, by Adhesive 2012(H)-2027(F)
Table 03: Global Flatback Tapes Market Volume (Mn Sq. m) Analysis, by Product 2012(H)-2027(F)
Table 04: Global Flatback Tapes Market Value (US$ Mn) Analysis, by Product 2012(H)-2027(F)
Table 05: Global Flatback Tapes Market Volume (Mn Sq. m) Analysis, by Application 2012(H)-2027(F)
Table 06: Global Flatback Tapes Market Value (US$ Mn) Analysis, by Application 2012(H)-2027(F)
Table 07: Global Flatback Tapes Market Volume (Mn Sq. m) Analysis, by Thickness 2012(H)-2027(F)
Table 08: Global Flatback Tapes Market Value (US$ Mn) Analysis, by Thickness 2012(H)-2027(F)
Table 09: Global Flatback Tapes Market Volume (Mn Sq. m) Analysis, by Region 2012(H)-2027(F)
Table 10: Global Flatback Tapes Market Value (US$ Mn) Analysis, by Region 2012(H)-2027(F)
Table 11: North America Flatback Tapes Market Volume (Mn Sq. m) Analysis, by Adhesive 2012(H)-2027(F)
Table 12: North America Flatback Tapes Market Value (US$ Mn) Analysis, by Adhesive 2012(H)-2027(F)
Table 13: North America Flatback Tapes Market Volume (Mn Sq. m) Analysis, by Product 2012(H)-2027(F)
Table 14: North America Flatback Tapes Market Value (US$ Mn) Analysis, by Product 2012(H)-2027(F)
Table 15: North America Flatback Tapes Market Volume (Mn Sq. m) Analysis, by Application 2012(H)-2027(F)
Table 16: North America Flatback Tapes Market Value (US$ Mn) Analysis, by Application 2012(H)-2027(F)
Table 17: North America Flatback Tapes Market Volume (Mn Sq. m) Analysis, by Thickness 2012(H)-2027(F)
Table 18: North America Flatback Tapes Market Value (US$ Mn) Analysis, by Thickness 2012(H)-2027(F)
Table 19: North America Flatback Tapes Market Volume (Mn Sq. m) Analysis, by Country 2012(H)-2027(F)
Table 20: North America Flatback Tapes Market Value (US$ Mn) Analysis, by Country 2012(H)-2027(F)
Table 21: Latin America Flatback Tapes Market Volume (Mn Sq. m) Analysis, by Adhesive 2012(H)-2027(F)
Table 22: Latin America Flatback Tapes Market Value (US$ Mn) Analysis, by Adhesive 2012(H)-2027(F)
Table 23: Latin America Flatback Tapes Market Volume (Mn Sq. m) Analysis, by Product 2012(H)-2027(F)
Table 24: Latin America Flatback Tapes Market Value (US$ Mn) Analysis, by Product 2012(H)-2027(F)
Table 25: Latin America Flatback Tapes Market Volume (Mn Sq. m) Analysis, by Application 2012(H)-2027(F)
Table 26: Latin America Flatback Tapes Market Value (US$ Mn) Analysis, by Application 2012(H)-2027(F)
Table 27: Latin America Flatback Tapes Market Volume (Mn Sq. m) Analysis, by Thickness 2012(H)-2027(F)
Table 28: Latin America Flatback Tapes Market Value (US$ Mn) Analysis, by Thickness 2012(H)-2027(F)
Table 29: Latin America Flatback Tapes Market Volume (Mn Sq. m) Analysis, by Country 2012(H)-2027(F)
Table 30: Latin America Flatback Tapes Market Value (US$ Mn) Analysis, by Country 2012(H)-2027(F)
Table 31: Western Europe Flatback Tapes Market Volume (Mn Sq. m) Analysis, by Adhesive 2012(H)-2027(F)
Table 32: Western Europe Flatback Tapes Market Value (US$ Mn) Analysis, by Adhesive 2012(H)-2027(F)
Table 33: Western Europe Flatback Tapes Market Volume (Mn Sq. m) Analysis, by Product 2012(H)-2027(F)
Table 34: Western Europe Flatback Tapes Market Value (US$ Mn) Analysis, by Product 2012(H)-2027(F)
Table 35: Western Europe Flatback Tapes Market Volume (Mn Sq. m) Analysis, by Application 2012(H)-2027(F)
Table 36: Western Europe Flatback Tapes Market Value (US$ Mn) Analysis, by Application 2012(H)-2027(F)
Table 37: Western Europe Flatback Tapes Market Volume (Mn Sq. m) Analysis, by Thickness 2012(H)-2027(F)
Table 38: Western Europe Flatback Tapes Market Value (US$ Mn) Analysis, by Thickness 2012(H)-2027(F)
Table 39: Western Europe Flatback Tapes Market Volume (Mn Sq. m) Analysis, by Country 2012(H)-2027(F)
Table 40: Western Europe Flatback Tapes Market Value (US$ Mn) Analysis, by Country 2012(H)-2027(F)
Table 41: Eastern Europe Flatback Tapes Market Volume (Mn Sq. m) Analysis, by Adhesive 2012(H)-2027(F)
Table 42: Eastern Europe Flatback Tapes Market Value (US$ Mn) Analysis, by Adhesive 2012(H)-2027(F)
Table 43: Eastern Europe Flatback Tapes Market Volume (Mn Sq. m) Analysis, by Product 2012(H)-2027(F)
Table 44: Eastern Europe Flatback Tapes Market Value (US$ Mn) Analysis, by Product 2012(H)-2027(F)
Table 45: Eastern Europe Flatback Tapes Market Volume (Mn Sq. m) Analysis, by Application 2012(H)-2027(F)
Table 46: Eastern Europe Flatback Tapes Market Value (US$ Mn) Analysis, by Application 2012(H)-2027(F)
Table 47: Eastern Europe Flatback Tapes Market Volume (Mn Sq. m) Analysis, by Thickness 2012(H)-2027(F)
Table 48: Eastern Europe Flatback Tapes Market Value (US$ Mn) Analysis, by Thickness 2012(H)-2027(F)
Table 49: Eastern Europe Flatback Tapes Market Volume (Mn Sq. m) Analysis, by Country 2012(H)-2027(F)
Table 50: Eastern Europe Flatback Tapes Market Value (US$ Mn) Analysis, by Country 2012(H)-2027(F)
Table 51: MEA Flatback Tapes Market Volume (Mn Sq. m) Analysis, by Adhesive 2012(H)-2027(F)
Table 52: MEA Flatback Tapes Market Value (US$ Mn) Analysis, by Adhesive 2012(H)-2027(F)
Table 53: MEA Flatback Tapes Market Volume (Mn Sq. m) Analysis, by Product 2012(H)-2027(F)
Table 54: MEA Flatback Tapes Market Value (US$ Mn) Analysis, by Product 2012(H)-2027(F)
Table 55: MEA Flatback Tapes Market Volume (Mn Sq. m) Analysis, by Application 2012(H)-2027(F)
Table 56: MEA Flatback Tapes Market Value (US$ Mn) Analysis, by Application 2012(H)-2027(F)
Table 57: MEA Flatback Tapes Market Volume (Mn Sq. m) Analysis, by Thickness 2012(H)-2027(F)
Table 58: MEA Flatback Tapes Market Value (US$ Mn) Analysis, by Applications 2012(H)-2027(F)
Table 59: MEA Flatback Tapes Market Volume (Mn Sq. m) Analysis, by Country 2012(H)-2027(F)
Table 60: MEA Flatback Tapes Market Value (US$ Mn) Analysis, by Country 2012(H)-2027(F)
Table 61: APEJ Flatback Tapes Market Volume (Mn Sq. m) Analysis, by Adhesive 2012(H)-2027(F)
Table 62: APEJ Flatback Tapes Market Value (US$ Mn) Analysis, by Adhesive 2012(H)-2027(F)
Table 63: APEJ Flatback Tapes Market Volume (Mn Sq. m) Analysis, by Product 2012(H)-2027(F)
Table 64: APEJ Flatback Tapes Market Value (US$ Mn) Analysis, by Product 2012(H)-2027(F)
Table 65: APEJ Flatback Tapes Market Volume (Mn Sq. m) Analysis, by Application 2012(H)-2027(F)
Table 66: APEJ Flatback Tapes Market Value (US$ Mn) Analysis, by Application 2012(H)-2027(F)
Table 67: APEJ Flatback Tapes Market Volume (Mn Sq. m) Analysis, by Thickness 2012(H)-2027(F)
Table 68: APEJ Flatback Tapes Market Value (US$ Mn) Analysis, by Thickness 2012(H)-2027(F)
Table 69: APEJ Flatback Tapes Market Volume (Mn Sq. m) Analysis, by Country 2012(H)-2027(F)
Table 70: APEJ Flatback Tapes Market Value (US$ Mn) Analysis, by Country 2012(H)-2027(F)
Table 71: Japan Flatback Tapes Market Volume (Mn Sq. m) Analysis, by Adhesive 2012(H)-2027(F)
Table 72: Japan Flatback Tapes Market Value (US$ Mn) Analysis, by Adhesive 2012(H)-2027(F)
Table 73: Japan Flatback Tapes Market Volume (Mn Sq. m) Analysis, by Product 2012(H)-2027(F)
Table 74: Japan Flatback Tapes Market Value (US$ Mn) Analysis, by Product 2012(H)-2027(F)
Table 75: Japan Flatback Tapes Market Volume (Mn Sq. m) Analysis, by Application 2012(H)-2027(F)
Table 76: Japan Flatback Tapes Market Value (US$ Mn) Analysis, by Application 2012(H)-2027(F)
Table 77: Japan Flatback Tapes Market Volume (Mn Sq. m) Analysis, by Thickness 2012(H)-2027(F)
Table 78: Japan Flatback Tapes Market Value (US$ Mn) Analysis, by Thickness 2012(H)-2027(F)
Find your sweet spots for generating winning opportunities in this market.
Talk to AnalystList of Charts
Figure 01: Global Flatback Tapes Market Attractiveness Analysis, by Adhesive, 2022(E)-2027(F)
Figure 02: Global Flatback Tapes Market Share Analysis, by Adhesive, 2022(E)-2027(F)
Figure 03: Global Flatback Tapes Market Y-o-Y Growth Analysis, by Adhesive, 2019(H)-2027(F)
Figure 04: Global Flatback Tapes Market Attractiveness Analysis, by Product, 2022(E)-2027(F)
Figure 05: Global Flatback Tapes Market Share Analysis, by Product, 2022(E)-2027(F)
Figure 06: Global Flatback Tapes Market Y-o-Y Growth Analysis, by Product, 2019(H)-2027(F)
Figure 07: Global Flatback Tapes Market Share Analysis, by Application, 2022(E)-2027(F)
Figure 08: Global Flatback Tapes Market Attractiveness Analysis, by Application, 2022(E)-2027(F)
Figure 09: Global Flatback Tapes Market Y-o-Y Growth Analysis, by Application, 2019(H)-2027(F)
Figure 10: Global Flatback Tapes Market Share Analysis, by Thickness, 2022(E)-2027(F)
Figure 11: Global Flatback Tapes Market Attractiveness Analysis, by Thickness, 2022(E)-2027(F)
Figure 12: Global Flatback Tapes Market Y-o-Y Growth Analysis, by Thickness, 2019(H)-2027(F)
Figure 13: Global Flatback Tapes Market Share Analysis, by Region, 2022(E)-2027(F)
Figure 14: Global Flatback Tapes Market Attractiveness Analysis, by Region, 2022(E)-2027(F)
Figure 15: Global Flatback Tapes Market Y-o-Y Growth Analysis, by Region, 2019(H)-2027(F)
Figure 16: North America Flatback Tapes Market Value Share Analysis by Application, 2022E-2027F
Figure 17: North America Flatback Tapes Market Y-o-Y Growth Analysis by Adhesive, 2019H-2027F
Figure 18: North America Flatback Tapes Market Share Analysis by Country, 2022E
Figure 19: North America Flatback Tapes Market Attractiveness Analysis by Thickness, 2022E-2027F
Figure 20: North America Flatback Tapes Market Share Analysis by Product, 2022E
Figure 21: Latin America Flatback Tapes Market Value Share Analysis by Application, 2022E-2027F
Figure 22: Latin America Flatback Tapes Market Y-o-Y Growth Analysis by Adhesive, 2019H-2027F
Figure 23: Latin America Flatback Tapes Market Share Analysis by Country, 2022E
Figure 24: Latin America Flatback Tapes Market Attractiveness Analysis by Thickness, 2022E-2027F
Figure 25: Latin America Flatback Tapes Market Share Analysis by Product, 2022E
Figure 26: Western Europe Flatback Tapes Market Value Share Analysis by Application, 2022E-2027F
Figure 27: Western Europe Flatback Tapes Market Y-o-Y Growth Analysis by Adhesive, 2019H-2027F
Figure 28: Western Europe Flatback Tapes Market Share Analysis by Country, 2022E
Figure 29: Western Europe Flatback Tapes Market Attractiveness Analysis by Thickness, 2022E-2027F
Figure 30: Western Europe Flatback Tapes Market Share Analysis by Product, 2022E
Figure 31: Eastern Europe Flatback Tapes Market Value Share Analysis by Application, 2022E-2027F
Figure 32: Eastern Europe Flatback Tapes Market Y-o-Y Growth Analysis by Adhesive, 2019H-2027F
Figure 33: Eastern Europe Flatback Tapes Market Share Analysis by Country, 2022E
Figure 34: Eastern Europe Flatback Tapes Market Attractiveness Analysis by Thickness, 2022E-2027F
Figure 35: Eastern Europe Flatback Tapes Market Share Analysis by Product, 2022E
Figure 36: MEA Flatback Tapes Market Value Share Analysis by Application, 2022E-2027F
Figure 37: MEA Flatback Tapes Market Y-o-Y Growth Analysis by Adhesive, 2019H-2027F
Figure 38: MEA Flatback Tapes Market Share Analysis by Country, 2022E
Figure 39: MEA Flatback Tapes Market Attractiveness Analysis by Thickness, 2022E-2027F
Figure 40: MEA Flatback Tapes Market Share Analysis by Product, 2022E
Figure 41: APEJ Flatback Tapes Market Value Share Analysis by Application, 2022E-2027F
Figure 42: APEJ Flatback Tapes Market Y-o-Y Growth Analysis by Adhesive, 2019H-2027F
Figure 43: APEJ Flatback Tapes Market Share Analysis by Country, 2022E
Figure 44: APEJ Flatback Tapes Market Attractiveness Analysis by Thickness, 2022E-2027F
Figure 45: APEJ Flatback Tapes Market Share Analysis by Product, 2022E
Figure 46: Japan Flatback Tapes Market Value Share Analysis by Application, 2022E-2027F
Figure 47: Japan Flatback Tapes Market Y-o-Y Growth Analysis by Adhesive, 2019H-2027F
Figure 48: Japan Flatback Tapes Market Attractiveness Analysis by Thickness, 2022E-2027F
Figure 49: Japan Flatback Tapes Market Share Analysis by Product, 2022
Figure 50: U.S. Flatback Tapes Market Value Share Analysis, by Adhesive, 2022E & 2027F
Figure 51: U.S. Flatback Tapes Market Value Share Analysis, by Application, 2022E & 2027F
Figure 52: U.S. Flatback Tapes Market Value Share Analysis, by Thickness, 2022E & 2027F
Figure 53: U.S. Flatback Tapes Market Value Share Analysis, by Product, 2022E & 2027F
Figure 54: Canada Flatback Tapes Market Value Share Analysis, by Adhesive, 2022E & 2027F
Figure 55: Canada Flatback Tapes Market Value Share Analysis, by Application, 2022E & 2027F
Figure 56: Canada Flatback Tapes Market Value Share Analysis, by Thickness, 2022E & 2027F
Figure 57: Canada Flatback Tapes Market Value Share Analysis, by Product, 2022E & 2027F
Figure 58: Brazil Flatback Tapes Market Value Share Analysis, by Adhesive, 2022E & 2027F
Figure 59: Brazil Flatback Tapes Market Value Share Analysis, by Application, 2022E & 2027F
Figure 60: Brazil Flatback Tapes Market Value Share Analysis, by Thickness, 2022E & 2027F
Figure 61: Brazil Flatback Tapes Market Value Share Analysis, by Product, 2022E & 2027F
Figure 62: Mexico Flatback Tapes Market Value Share Analysis, by Adhesive, 2022E & 2027F
Figure 63: Mexico Flatback Tapes Market Value Share Analysis, by Application, 2022E & 2027F
Figure 64: Mexico Flatback Tapes Market Value Share Analysis, by Thickness, 2022E & 2027F
Figure 65: Mexico Flatback Tapes Market Value Share Analysis, by Product, 2022E & 2027F
Figure 66: China Flatback Tapes Market Value Share Analysis, by Adhesive, 2022E & 2027F
Figure 67: China Flatback Tapes Market Value Share Analysis, by Application, 2022E & 2027F
Figure 68: China Flatback Tapes Market Value Share Analysis, by Thickness, 2022E & 2027F
Figure 69: China Flatback Tapes Market Value Share Analysis, by Product, 2022E & 2027F
Figure 70: India Flatback Tapes Market Value Share Analysis, by Adhesive, 2022E & 2027F
Figure 71: India Flatback Tapes Market Value Share Analysis, by Application, 2022E & 2027F
Figure 72: India Flatback Tapes Market Value Share Analysis, by Thickness, 2022E & 2027F
Figure 73: India Flatback Tapes Market Value Share Analysis, by Product, 2022E & 2027F
Figure 74: Australia & New Zealand Flatback Tapes Market Value Share Analysis, by Adhesive, 2022E & 2027F
Figure 75: Australia & New Zealand Flatback Tapes Market Value Share Analysis, by Application, 2022E & 2027F
Figure 76: Australia & New Zealand Flatback Tapes Market Value Share Analysis, by Thickness, 2022E & 2027F
Figure 77: Australia & New Zealand Flatback Tapes Market Value Share Analysis, by Product, 2022E & 2027F
Figure 78: Germany Flatback Tapes Market Value Share Analysis, by Adhesive, 2022E & 2027F
Figure 79: Germany Flatback Tapes Market Value Share Analysis, by Application, 2022E & 2027F
Figure 80: Germany Flatback Tapes Market Value Share Analysis, by Thickness, 2022E & 2027F
Figure 81: Germany Flatback Tapes Market Value Share Analysis, by Product, 2022E & 2027F
Figure 82: Italy Flatback Tapes Market Value Share Analysis, by Adhesive, 2022E & 2027F
Figure 83: Italy Flatback Tapes Market Value Share Analysis, by Application, 2022E & 2027F
Figure 84: Italy Flatback Tapes Market Value Share Analysis, by Thickness, 2022E & 2027F
Figure 85: Italy Flatback Tapes Market Value Share Analysis, by Product, 2022E & 2027F
Figure 86: France Flatback Tapes Market Value Share Analysis, by Adhesive, 2022E & 2027F
Figure 87: France Flatback Tapes Market Value Share Analysis, by Application, 2022E & 2027F
Figure 88: France Flatback Tapes Market Value Share Analysis, by Thickness, 2022E & 2027F
Figure 89: France Flatback Tapes Market Value Share Analysis, by Product, 2022E & 2027F
Figure 90: U.K. Flatback Tapes Market Value Share Analysis, by Adhesive, 2022E & 2027F
Figure 91: U.K. Flatback Tapes Market Value Share Analysis, by Application, 2022E & 2027F
Figure 92: U.K. Flatback Tapes Market Value Share Analysis, by Thickness, 2022E & 2027F
Figure 93: U.K. Flatback Tapes Market Value Share Analysis, by Product, 2022E & 2027F
Figure 94: Spain Flatback Tapes Market Value Share Analysis, by Adhesive, 2022E & 2027F
Figure 95: Spain Flatback Tapes Market Value Share Analysis, by Application, 2022E & 2027F
Figure 96: Spain Flatback Tapes Market Value Share Analysis, by Thickness, 2022E & 2027F
Figure 97: Spain Flatback Tapes Market Value Share Analysis, by Product, 2022E & 2027F
Figure 98: Russia Flatback Tapes Market Value Share Analysis, by Adhesive, 2022E & 2027F
Figure 99: Russia Flatback Tapes Market Value Share Analysis, by Application, 2022E & 2027F
Figure 100: Russia Flatback Tapes Market Value Share Analysis, by Thickness, 2022E & 2027F
Figure 101: Russia Flatback Tapes Market Value Share Analysis, by Product, 2022E & 2027F
Figure 102: Poland Flatback Tapes Market Value Share Analysis, by Adhesive, 2022E & 2027F
Figure 103: Poland Flatback Tapes Market Value Share Analysis, by Application, 2022E & 2027F
Figure 104: Poland Flatback Tapes Market Value Share Analysis, by Thickness, 2022E & 2027F
Figure 105: Poland Flatback Tapes Market Value Share Analysis, by Product, 2022E & 2027F
Figure 106: GCC Flatback Tapes Market Value Share Analysis, by Adhesive, 2022E & 2027F
Figure 107: GCC Flatback Tapes Market Value Share Analysis, by Application, 2022E & 2027F
Figure 108: GCC Flatback Tapes Market Value Share Analysis, by Thickness, 2022E & 2027F
Figure 109: GCC Flatback Tapes Market Value Share Analysis, by Product, 2022E & 2027F
Figure 110: South Africa Flatback Tapes Market Value Share Analysis, by Adhesive, 2022E & 2027F
Figure 111: South Africa Flatback Tapes Market Value Share Analysis, by Application, 2022E & 2027F
Figure 112: South Africa Flatback Tapes Market Value Share Analysis, by Thickness, 2022E & 2027F
Figure 113: South Africa Flatback Tapes Market Value Share Analysis, by Product, 2022E & 2027F
Figure 114: North Africa Flatback Tapes Market Value Share Analysis, by Adhesive, 2022E & 2027F
Figure 115: North Africa Flatback Tapes Market Value Share Analysis, by Application, 2022E & 2027F
Figure 116: North Africa Flatback Tapes Market Value Share Analysis, by Thickness, 2022E & 2027F
Figure 117: North Africa Flatback Tapes Market Value Share Analysis, by Product, 2022E & 2027F
Need specific information?
Request CustomizationExplore Packaging Insights
View Reports