Flavored Syrup Market Outlook and Forecast 2025 to 2035

The global flavored syrup market is projected to grow from USD 59.5 billion in 2025 to USD 84.4 billion by 2035, registering a CAGR of 3.5%. The market expansion is driven by rising demand for premium, customizable flavor experiences across food and beverage segments. Innovations in syrup formulation featuring organic ingredients, reduced sugar content, and novel flavor profiles are further fueling demand across cafes, restaurants, home kitchens, and food manufacturing sectors.
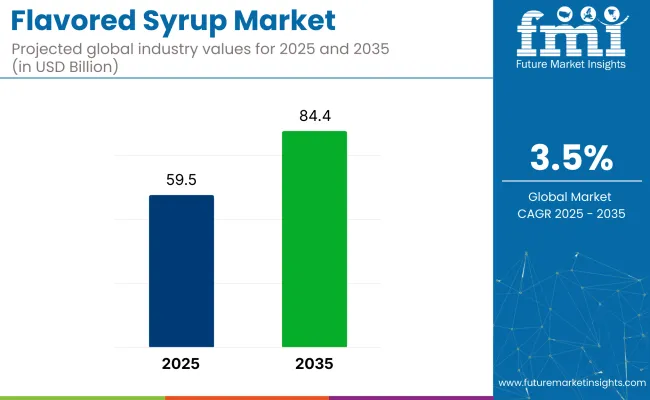
Quick Stats Of Flavored Syrup Market

  • Market Value (2025): USD 59.5 billion
  • Forecast Value (2035): USD 84.4 billion
  • Forecast CAGR: 3.5%
  • Flavor Type Leader in 2025: Sweet syrups (60% share)
  • Top Application Segment: Beverages (42% market share)
  • Key Growth Region: Western Europe (Germany is the fastest-growing market with a 6.5% CAGR)
Metric Value
Industry Size (2025E) USD 59.5 billion
Industry Value (2035F) USD 84.4 billion
CAGR (2025 to 2035) 3.5%

The market holds a 100% share within the specialty syrup segment. It accounts for approximately 29% of the global flavor and sweetener market, around 6% of the beverage ingredients segment, and nearly 4% of the broader food additives market. Within the expansive food and beverage industry, its presence is relatively modest, estimated at below 0.5%. Despite this, its role in product differentiation keeps it strategically important.

Government regulations impacting the market focus on food safety, labeling transparency, and nutritional content. Agencies such as the USA Food and Drug Administration (FDA) and the European Food Safety Authority (EFSA) enforce standards regarding additive usage, allergen disclosure, and sugar labeling.

Regulations like the Nutrition Labeling and Education Act (NLEA) in the USA and Regulation (EU) No 1169/2011 in Europe mandate clarity on nutritional profiles and encourage clean-label practices. These frameworks are driving the reformulation of syrups to meet consumer preferences for natural, organic, and sugar-reduced options, thus accelerating the adoption of premium syrup lines that align with health-conscious purchasing behavior.

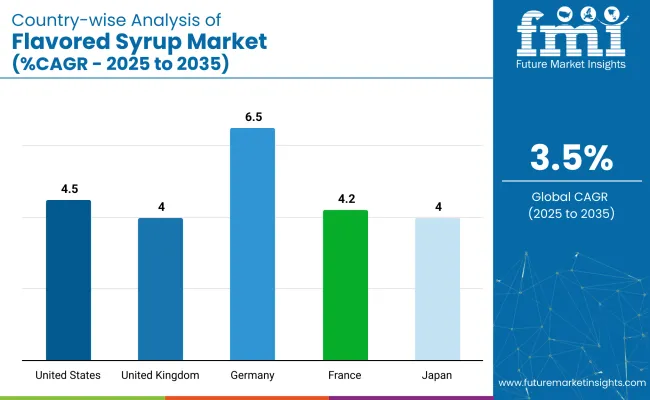
Germany is projected to be the fastest-growing market, expanding at a CAGR of 6.5% from 2025 to 2035. Coffee-flavored syrups will lead the flavor segment with a 13% share, while natural syrups will dominate the sourcing segment with a 66% share. The USA and France markets are also expected to grow steadily at CAGRs of 4.5% and 4.2%, respectively.

Flavored Syrup Market Analysis by Top Investment Segments

The flavored syrup market is segmented by flavor, application, flavor type, product type, and region. By flavor, the market is divided into fruit, chocolate, vanilla, coffee, and herbs & seasonings. Based on application, the market includes beverages, dairy & frozen desserts, confectionery, and bakery.

By flavor type, the market is segmented into sweet, salty, sour, savoury, and mint. In terms of product type, the market is bifurcated into natural and synthetic. Regionally, the market covers North America, Latin America, Western Europe, Eastern Europe, South Asia & Pacific, East Asia, and Middle East & Africa.

Coffee to Lead the Flavor Segment with 13% Market Share

Coffee is expected to dominate the flavor segment, capturing 13% of the market share by 2025. This trend is driven by the global coffee culture boom and increased demand for barista-style beverages.

  • Coffee-flavored syrups are versatile and widely used in both hot and cold drinks.
  • Their growing use in artisanal beverages, flavored lattes, and home-brewing kits makes them a staple in both retail and HORECA channels.

Beverages to Dominate the Application Segment with 42% Market Share

The beverage is expected to capture 42% of the market share in 2025. These syrups enhance taste, color, and aroma, and are key to customization trends in cafes, restaurants, and ready-to-drink beverage products.
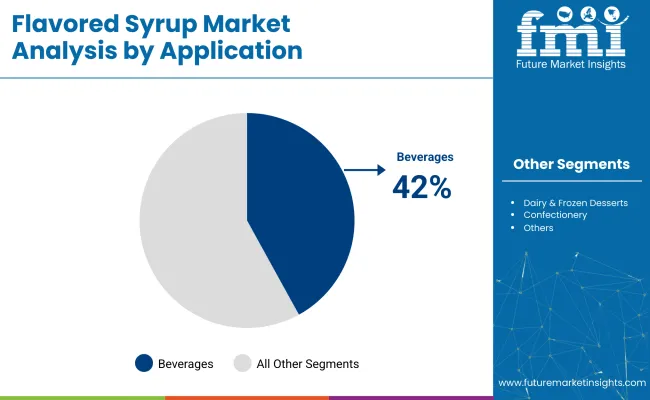
  • Flavored syrups are essential in the preparation of cocktails, mocktails, milkshakes, sodas, and specialty coffees.
  • The rise of experiential dining and custom drink creation in cafes is a major driver of this segment.

Sweet to Lead the Flavor Type Segment with 60% Market Share

Sweet are expected to capture 60% share in 2025.These syrups are extensively used across multiple food and beverage products.
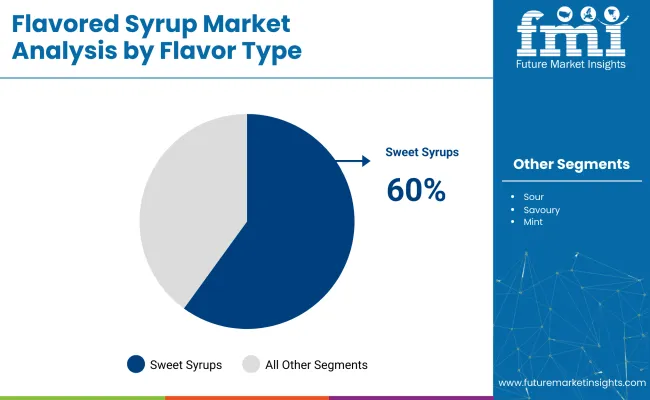
  • Sweet flavors such as vanilla, caramel, and fruit remain staples in global cuisine.
  • Their compatibility with dairy, desserts, and hot beverages keeps demand consistently high.

Natural to Lead Product Type Segment with 66% Share

Natural products are expected to capture 66% of the market in 2025. These syrups are primarily used for their organic nature.

  • These syrups offer health-conscious people various options in taste.
  • These syrups appeal to people with allergies.

Top Flavored Syrup Market Dynamics

The global flavored syrup market is experiencing steady growth, driven by increasing demand for flavor customization, rising disposable incomes, and evolving cafe culture across emerging economies.

Recent Trends in the Flavored Syrup Market

  • Natural and sugar-free formulations are gaining popularity, driven by the health-conscious consumer base.
  • Syrup manufacturers are incorporating ethnic and seasonal flavors to appeal to global palates.

Challenges in the Flavored Syrup Market
  • Health concerns around high sugar content continue to restrict demand for traditional syrups.
  • The rise of clean-label expectations puts pressure on manufacturers to remove artificial additives.

Top Countries Manufacturing, Regulating, and Generating Demand for Flavored Syrup

Germany leads with the highest projected CAGR of 6.5% from 2025 to 2035, fueled by rising demand for organic, non-GMO, and clean-label syrups, particularly in beverages and dairy applications. The USA remains a dominant force, with a steady CAGR of 4.5% over the forecast period. It serves as a major manufacturing and innovation hub, supported by advance food processing infrastructure, favorable food safety regulations, and a strong presence of major syrup producers like The Hershey Company and Monin.

USA consumers continue to drive demand for premium, functional, and customizable syrup options, especially in the booming cafe, quick-service restaurant (QSR), and craft beverage sectors. There is increasing focus on health-conscious formulations, such as low-calorie, sugar-free, and natural flavor blends. France, Japan, and the UK also contribute significantly, each growing at 4% to 4.2%, driven by changing dietary habits, growing cafe culture, and preference for specialty and seasonal flavors.

This report includes in-depth data from over 40+ countries. Below is a focused analysis of five top-performing OECD nations.

Growth Outlook for Flavored Syrup in Japan

The sales of flavored syrup in Japan are projected to grow at a CAGR of 4% from 2025 to 2035. Growth is supported by hybrid beverage formats such as matcha lattes and regional tea infusions. Convenience stores, vending outlets, and fast-casual restaurants account for a large share of syrup sales.

  • High demand in traditional tea blends and fusion drinks
  • Fast-moving product formats suitable for modern Japanese retail

Expansion Trends in Flavored Syrup Market in Germany

The flavored syrup market in Germany is expected to grow at a CAGR of 6.5% during the forecast period. Growth is driven by EU sugar-reduction policies, rising organic product adoption, and increasing demand from beverage innovators.

  • Strong growth in organic and clean-label syrup segments
  • High demand across hospitality and fast-casual service formats

Demand Analysis of Flavored Syrup in France

The French flavored syrup market is forecast to expand at a CAGR of 4.2% during the forecast period. Growth is supported by strong demand for gourmet desserts, seasonal beverages, and culinary innovation.

  • Culinary syrup applications are widely used in pastries and desserts
  • Strong alignment with EU funding for health-focused food innovation

Steady Expansion of Flavored Syrup in the USA

The USA flavored syrup revenue is projected to grow at a CAGR of 4.5% from 2025 to 2035. Growth is driven by the rise of specialty coffee shops, personalized beverage culture, and sugar-free lifestyle products.

  • Innovation in keto, vegan, and sugar-free syrup options
  • Steady demand from both institutional and home consumption segments

UK Flavored Syrup Market Analysis

The demand for flavored syrup in the UK is expected to grow at a CAGR of 4% from 2025 to 2035. Growth is driven by public health campaigns targeting sugar reduction and a growing preference for premium beverages at home.

  • Growth in mid-scale, wellness-focused beverage segments
  • Retailers adopting clean-label standards in flavored syrup offerings

Leading Flavored Syrup Suppliers and Manufacturers

The market is moderately consolidated, with leading players like Monin Inc., Sensient Technologies, The Hershey Company, Tate & Lyle, and Kerry Group dominating the industry. These companies offer a diverse portfolio of high-quality flavored syrups catering to sectors such as beverages, bakery, confectionery, dairy, and foodservice.

Many of these manufacturers are investing heavily in R&D to develop health-oriented formulations, including sugar-free, organic, and plant-based syrups. Additionally, global expansion through strategic partnerships and acquisitions is helping these players strengthen their footprint across emerging markets in Asia-Pacific and Latin America.

Other key players like Fuerst Day Lawson, Toschi Vignola, R. Torre & Company, Concord Foods, and Sensory Effects contribute significantly by offering specialized, regionally inspired, and functional syrups across a wide array of end-use applications.

Recent Flavored Syrup Industry News

  • In April 2025, The Hershey Company announced its acquisition of LesserEvil, expanding its snacking portfolio with organic, better-for-you snacks alongside brands like SkinnyPop, Dot's, and Pirate's Booty.
  • In March 2025, Monin expanded its product range with 100% sugar-free syrups and concentrates targeting health-conscious consumers. It also boosted operational capacity by opening a new manufacturing facility in Hyderabad, India, enhancing innovation and supply chain efficiency.

Flavored Syrup Market Report Scope

Report Attributes Details
Market Size (2025) USD 59.5 billion
Projected Market Size (2035) USD 84.4 billion
CAGR (2025 to 2035) 3.5%
Base Year for Estimation 2024
Historical Period 2020 to 2024
Projections Period 2025 to 2035
Report Parameter USD billion for value / volume in million liters
Flavor Analyzed Fruit, Chocolate, Vanilla, Coffee, and Herbs & Seasonings
Application Analyzed Beverages, Dairy & Frozen Desserts, Confectionery, and Bakery
Flavor Type Analyzed Sweet, Salty, Sour, Savoury, and Mint
Product Type Analyzed Natural and Synthetic
Regions Covered North America, Latin America, Western Europe, Eastern Europe, South Asia & Pacific, East Asia, and Middle East & Africa
Countries Covered United States, Canada, United Kingdom, Germany, France, China, Japan, South Korea, Brazil, Australia
Key Players Influencing the Market Monin Inc., Sensient Technologies, The Hershey Company, Tate & Lyle, Kerry Group, Fuerst Day Lawson, Toschi Vignola, R. Torre & Company, Concord Foods, Sensory Effects
Additional Attributes Market share analysis by source and grade, country-wise CAGR analysis, and brand positioning

Market Segmentation

By Flavor:

  • Fruit
  • Chocolate
  • Vanilla
  • Coffee
  • Herbs & Seasonings

By Application:

  • Beverages
  • Diary & Frozen Desserts
  • Confectionery
  • Bakery

By Flavor Type:

  • Sweet
  • Salty
  • Sour
  • Savory
  • Mint

By Product type:

  • Natural
  • Synthetic

By Region:

  • North America
  • Latin America
  • Europe
  • Asia Pacific
  • MEA

Table of Content

  1. Executive Summary
    • Global Market Outlook
    • Demand-side Trends
    • Supply-side Trends
    • Technology Roadmap Analysis
    • Analysis and Recommendations
  2. Market Overview
    • Market Coverage / Taxonomy
    • Market Definition / Scope / Limitations
  3. Market Background
    • Market Dynamics
      • Drivers
      • Restraints
      • Opportunity
      • Trends
    • Scenario Forecast
      • Demand in Optimistic Scenario
      • Demand in Likely Scenario
      • Demand in Conservative Scenario
    • Opportunity Map Analysis
    • Product Life Cycle Analysis
    • Supply Chain Analysis
      • Supply Side Participants and their Roles
        • Producers
        • Mid-Level Participants (Traders/ Agents/ Brokers)
        • Wholesalers and Distributors
      • Value Added and Value Created at Node in the Supply Chain
      • List of Raw Material Suppliers
      • List of Existing and Potential Buyer’s
    • Investment Feasibility Matrix
    • Value Chain Analysis
      • Profit Margin Analysis
      • Wholesalers and Distributors
      • Retailers
    • PESTLE and Porter’s Analysis
    • Regulatory Landscape
      • By Key Regions
      • By Key Countries
    • Regional Parent Market Outlook
    • Production and Consumption Statistics
    • Import and Export Statistics
  4. Global Market Analysis 2020 to 2024 and Forecast, 2025 to 2035
    • Historical Market Size Value (USD Billion) & Volume (Million Liters) Analysis, 2020 to 2024
    • Current and Future Market Size Value (USD Billion) & Volume (Million Liters) Projections, 2025 to 2035
      • Y-o-Y Growth Trend Analysis
      • Absolute $ Opportunity Analysis
  5. Global Market Pricing Analysis 2020 to 2024 and Forecast 2025 to 2035
  6. Global Market Analysis 2020 to 2024 and Forecast 2025 to 2035, By Flavor
    • Introduction / Key Findings
    • Historical Market Size Value (USD Billion) & Volume (Million Liters) Analysis By Flavor, 2020 to 2024
    • Current and Future Market Size Value (USD Billion) & Volume (Million Liters) Analysis and Forecast By Flavor, 2025 to 2035
      • Fruit
      • Chocolate
      • Vanilla
      • Coffee
      • Herbs & Seasonings
    • Y-o-Y Growth Trend Analysis By Flavor, 2020 to 2024
    • Absolute $ Opportunity Analysis By Flavor, 2025 to 2035
  7. Global Market Analysis 2020 to 2024 and Forecast 2025 to 2035, By Application
    • Introduction / Key Findings
    • Historical Market Size Value (USD Billion) & Volume (Million Liters) Analysis By Application , 2020 to 2024
    • Current and Future Market Size Value (USD Billion) & Volume (Million Liters) Analysis and Forecast By Application , 2025 to 2035
      • Beverages
      • Dairy & Frozen Desserts
      • Confectionery
      • Bakery
    • Y-o-Y Growth Trend Analysis By Application , 2020 to 2024
    • Absolute $ Opportunity Analysis By Application , 2025 to 2035
  8. Global Market Analysis 2020 to 2024 and Forecast 2025 to 2035, By Flavor Type
    • Introduction / Key Findings
    • Historical Market Size Value (USD Billion) & Volume (Million Liters) Analysis By Flavor Type, 2020 to 2024
    • Current and Future Market Size Value (USD Billion) & Volume (Million Liters) Analysis and Forecast By Flavor Type, 2025 to 2035
      • Sweet
      • Salty
      • Sour
      • Savory
      • Mint
    • Y-o-Y Growth Trend Analysis By Flavor Type, 2020 to 2024
    • Absolute $ Opportunity Analysis By Flavor Type, 2025 to 2035
  9. Global Market Analysis 2020 to 2024 and Forecast 2025 to 2035, By Product Type
    • Introduction / Key Findings
    • Historical Market Size Value (USD Billion) & Volume (Million Liters) Analysis By Product Type, 2020 to 2024
    • Current and Future Market Size Value (USD Billion) & Volume (Million Liters) Analysis and Forecast By Product Type, 2025 to 2035
      • Natural
      • Synthetic
    • Y-o-Y Growth Trend Analysis By Product Type, 2020 to 2024
    • Absolute $ Opportunity Analysis By Product Type, 2025 to 2035
  10. Global Market Analysis 2020 to 2024 and Forecast 2025 to 2035, By Region
    • Introduction
    • Historical Market Size Value (USD Billion) & Volume (Million Liters) Analysis By Region, 2020 to 2024
    • Current Market Size Value (USD Billion) & Volume (Million Liters) Analysis and Forecast By Region, 2025 to 2035
      • North America
      • Latin America
      • Western Europe
      • Eastern Europe
      • East Asia
      • South Asia & Pacific
      • Middle East and Africa
    • Market Attractiveness Analysis By Region
  11. North America Market Analysis 2020 to 2024 and Forecast 2025 to 2035, By Country
    • Historical Market Size Value (USD Billion) & Volume (Million Liters) Trend Analysis By Market Taxonomy, 2020 to 2024
    • Market Size Value (USD Billion) & Volume (Million Liters) Forecast By Market Taxonomy, 2025 to 2035
      • By Country
        • USA
        • Canada
        • Mexico
      • By Flavor
      • By Application
      • By Flavor Type
      • By Product Type
    • Market Attractiveness Analysis
      • By Country
      • By Flavor
      • By Application
      • By Flavor Type
      • By Product Type
    • Key Takeaways
  12. Latin America Market Analysis 2020 to 2024 and Forecast 2025 to 2035, By Country
    • Historical Market Size Value (USD Billion) & Volume (Million Liters) Trend Analysis By Market Taxonomy, 2020 to 2024
    • Market Size Value (USD Billion) & Volume (Million Liters) Forecast By Market Taxonomy, 2025 to 2035
      • By Country
        • Brazil
        • Argentina
        • Rest of LATAM
      • By Flavor
      • By Application
      • By Flavor Type
      • By Product Type
    • Market Attractiveness Analysis
      • By Country
      • By Flavor
      • By Application
      • By Flavor Type
      • By Product Type
    • Key Takeaways
  13. Western Europe Market Analysis 2020 to 2024 and Forecast 2025 to 2035, By Country
    • Historical Market Size Value (USD Billion) & Volume (Million Liters) Trend Analysis By Market Taxonomy, 2020 to 2024
    • Market Size Value (USD Billion) & Volume (Million Liters) Forecast By Market Taxonomy, 2025 to 2035
      • By Country
        • Germany
        • Italy
        • France
        • UK
        • Spain
        • BENELUX
        • Nordic
        • Rest of W.Europe
      • By Flavor
      • By Application
      • By Flavor Type
      • By Product Type
    • Market Attractiveness Analysis
      • By Country
      • By Flavor
      • By Application
      • By Flavor Type
      • By Product Type
    • Key Takeaways
  14. Eastern Europe Market Analysis 2020 to 2024 and Forecast 2025 to 2035, By Country
    • Historical Market Size Value (USD Billion) & Volume (Million Liters) Trend Analysis By Market Taxonomy, 2020 to 2024
    • Market Size Value (USD Billion) & Volume (Million Liters) Forecast By Market Taxonomy, 2025 to 2035
      • By Country
        • Russia
        • Hungary
        • Poland
        • Balkan & Baltics
        • Rest of E. Europe
      • By Flavor
      • By Application
      • By Flavor Type
      • By Product Type
    • Market Attractiveness Analysis
      • By Country
      • By Flavor
      • By Application
      • By Flavor Type
      • By Product Type
    • Key Takeaways
  15. East Asia Market Analysis 2020 to 2024 and Forecast 2025 to 2035, By Country
    • Historical Market Size Value (USD Billion) & Volume (Million Liters) Trend Analysis By Market Taxonomy, 2020 to 2024
    • Market Size Value (USD Billion) & Volume (Million Liters) Forecast By Market Taxonomy, 2025 to 2035
      • By Country
        • China
        • Japan
        • South Korea
      • By Flavor
      • By Application
      • By Flavor Type
      • By Product Type
    • Market Attractiveness Analysis
      • By Country
      • By Flavor
      • By Application
      • By Flavor Type
      • By Product Type
    • Key Takeaways
  16. South Asia & Pacific Market Analysis 2020 to 2024 and Forecast 2025 to 2035, By Country
    • Historical Market Size Value (USD Billion) & Volume (Million Liters) Trend Analysis By Market Taxonomy, 2020 to 2024
    • Market Size Value (USD Billion) & Volume (Million Liters) Forecast By Market Taxonomy, 2025 to 2035
      • By Country
        • India
        • Australia & New Zealand
        • ASEAN
        • Rest of SAP
      • By Flavor
      • By Application
      • By Flavor Type
      • By Product Type
    • Market Attractiveness Analysis
      • By Country
      • By Flavor
      • By Application
      • By Flavor Type
      • By Product Type
    • Key Takeaways
  17. Middle East and Africa Market Analysis 2020 to 2024 and Forecast 2025 to 2035, By Country
    • Historical Market Size Value (USD Billion) & Volume (Million Liters) Trend Analysis By Market Taxonomy, 2020 to 2024
    • Market Size Value (USD Billion) & Volume (Million Liters) Forecast By Market Taxonomy, 2025 to 2035
      • By Country
        • GCC Countries
        • Northern Africa
        • South Africa
        • Turkiye
        • Rest of MEA
      • By Flavor
      • By Application
      • By Flavor Type
      • By Product Type
    • Market Attractiveness Analysis
      • By Country
      • By Flavor
      • By Application
      • By Flavor Type
      • By Product Type
    • Key Takeaways
  18. Key Countries Market Analysis
    • USA
      • Pricing Analysis
      • Market Share Analysis, 2024
        • By Flavor
        • By Application
        • By Flavor Type
        • By Product Type
    • Canada
      • Pricing Analysis
      • Market Share Analysis, 2024
        • By Flavor
        • By Application
        • By Flavor Type
        • By Product Type
    • Brazil
      • Pricing Analysis
      • Market Share Analysis, 2024
        • By Flavor
        • By Application
        • By Flavor Type
        • By Product Type
    • Mexico
      • Pricing Analysis
      • Market Share Analysis, 2024
        • By Flavor
        • By Application
        • By Flavor Type
        • By Product Type
    • Argentina
      • Pricing Analysis
      • Market Share Analysis, 2024
        • By Flavor
        • By Application
        • By Flavor Type
        • By Product Type
  19. Market Structure Analysis
    • Competition Dashboard
    • Competition Benchmarking
    • Market Share Analysis of Top Players
      • By Regional
      • By Flavor
      • By Application
      • By Flavor Type
      • By Product Type
  20. Competition Analysis
    • Competition Deep Dive
      • Monin Inc.
        • Overview
        • Product Portfolio
        • Profitability by Market Segments (Product/Age /Sales Channel/Region)
        • Sales Footprint
        • Strategy Overview
          • Marketing Strategy
          • Product Strategy
          • Channel Strategy
      • Sensient Technologies
        • Overview
        • Product Portfolio
        • Profitability by Market Segments (Product/Age /Sales Channel/Region)
        • Sales Footprint
        • Strategy Overview
          • Marketing Strategy
          • Product Strategy
          • Channel Strategy
      • The Hershey Company
        • Overview
        • Product Portfolio
        • Profitability by Market Segments (Product/Age /Sales Channel/Region)
        • Sales Footprint
        • Strategy Overview
          • Marketing Strategy
          • Product Strategy
          • Channel Strategy
      • Tate & Lyle
        • Overview
        • Product Portfolio
        • Profitability by Market Segments (Product/Age /Sales Channel/Region)
        • Sales Footprint
        • Strategy Overview
          • Marketing Strategy
          • Product Strategy
          • Channel Strategy
      • Kerry Group
        • Overview
        • Product Portfolio
        • Profitability by Market Segments (Product/Age /Sales Channel/Region)
        • Sales Footprint
        • Strategy Overview
          • Marketing Strategy
          • Product Strategy
          • Channel Strategy
      • Fuerst Day Lawson
        • Overview
        • Product Portfolio
        • Profitability by Market Segments (Product/Age /Sales Channel/Region)
        • Sales Footprint
        • Strategy Overview
          • Marketing Strategy
          • Product Strategy
          • Channel Strategy
      • Toschi Vignola
        • Overview
        • Product Portfolio
        • Profitability by Market Segments (Product/Age /Sales Channel/Region)
        • Sales Footprint
        • Strategy Overview
          • Marketing Strategy
          • Product Strategy
          • Channel Strategy
      • R. Torre & Company
        • Overview
        • Product Portfolio
        • Profitability by Market Segments (Product/Age /Sales Channel/Region)
        • Sales Footprint
        • Strategy Overview
          • Marketing Strategy
          • Product Strategy
          • Channel Strategy
      • Concord Foods
        • Overview
        • Product Portfolio
        • Profitability by Market Segments (Product/Age /Sales Channel/Region)
        • Sales Footprint
        • Strategy Overview
          • Marketing Strategy
          • Product Strategy
          • Channel Strategy
      • Sensory Effects
        • Overview
        • Product Portfolio
        • Profitability by Market Segments (Product/Age /Sales Channel/Region)
        • Sales Footprint
        • Strategy Overview
          • Marketing Strategy
          • Product Strategy
          • Channel Strategy
  21. Assumptions & Acronyms Used
  22. Research Methodology

List of Tables

  • Table 1: Global Market Value (USD Billion) Forecast by Region, 2020 to 2035
  • Table 2: Global Market Volume (Million Liters) Forecast by Region, 2020 to 2035
  • Table 3: Global Market Value (USD Billion) Forecast by Flavor, 2020 to 2035
  • Table 4: Global Market Volume (Million Liters) Forecast by Flavor, 2020 to 2035
  • Table 5: Global Market Value (USD Billion) Forecast by Application , 2020 to 2035
  • Table 6: Global Market Volume (Million Liters) Forecast by Application , 2020 to 2035
  • Table 7: Global Market Value (USD Billion) Forecast by Flavor Type, 2020 to 2035
  • Table 8: Global Market Volume (Million Liters) Forecast by Flavor Type, 2020 to 2035
  • Table 9: Global Market Value (USD Billion) Forecast by Product Type, 2020 to 2035
  • Table 10: Global Market Volume (Million Liters) Forecast by Product Type, 2020 to 2035
  • Table 11: North America Market Value (USD Billion) Forecast by Country, 2020 to 2035
  • Table 12: North America Market Volume (Million Liters) Forecast by Country, 2020 to 2035
  • Table 13: North America Market Value (USD Billion) Forecast by Flavor, 2020 to 2035
  • Table 14: North America Market Volume (Million Liters) Forecast by Flavor, 2020 to 2035
  • Table 15: North America Market Value (USD Billion) Forecast by Application , 2020 to 2035
  • Table 16: North America Market Volume (Million Liters) Forecast by Application , 2020 to 2035
  • Table 17: North America Market Value (USD Billion) Forecast by Flavor Type, 2020 to 2035
  • Table 18: North America Market Volume (Million Liters) Forecast by Flavor Type, 2020 to 2035
  • Table 19: North America Market Value (USD Billion) Forecast by Product Type, 2020 to 2035
  • Table 20: North America Market Volume (Million Liters) Forecast by Product Type, 2020 to 2035
  • Table 21: Latin America Market Value (USD Billion) Forecast by Country, 2020 to 2035
  • Table 22: Latin America Market Volume (Million Liters) Forecast by Country, 2020 to 2035
  • Table 23: Latin America Market Value (USD Billion) Forecast by Flavor, 2020 to 2035
  • Table 24: Latin America Market Volume (Million Liters) Forecast by Flavor, 2020 to 2035
  • Table 25: Latin America Market Value (USD Billion) Forecast by Application , 2020 to 2035
  • Table 26: Latin America Market Volume (Million Liters) Forecast by Application , 2020 to 2035
  • Table 27: Latin America Market Value (USD Billion) Forecast by Flavor Type, 2020 to 2035
  • Table 28: Latin America Market Volume (Million Liters) Forecast by Flavor Type, 2020 to 2035
  • Table 29: Latin America Market Value (USD Billion) Forecast by Product Type, 2020 to 2035
  • Table 30: Latin America Market Volume (Million Liters) Forecast by Product Type, 2020 to 2035
  • Table 31: Western Europe Market Value (USD Billion) Forecast by Country, 2020 to 2035
  • Table 32: Western Europe Market Volume (Million Liters) Forecast by Country, 2020 to 2035
  • Table 33: Western Europe Market Value (USD Billion) Forecast by Flavor, 2020 to 2035
  • Table 34: Western Europe Market Volume (Million Liters) Forecast by Flavor, 2020 to 2035
  • Table 35: Western Europe Market Value (USD Billion) Forecast by Application , 2020 to 2035
  • Table 36: Western Europe Market Volume (Million Liters) Forecast by Application , 2020 to 2035
  • Table 37: Western Europe Market Value (USD Billion) Forecast by Flavor Type, 2020 to 2035
  • Table 38: Western Europe Market Volume (Million Liters) Forecast by Flavor Type, 2020 to 2035
  • Table 39: Western Europe Market Value (USD Billion) Forecast by Product Type, 2020 to 2035
  • Table 40: Western Europe Market Volume (Million Liters) Forecast by Product Type, 2020 to 2035
  • Table 41: Eastern Europe Market Value (USD Billion) Forecast by Country, 2020 to 2035
  • Table 42: Eastern Europe Market Volume (Million Liters) Forecast by Country, 2020 to 2035
  • Table 43: Eastern Europe Market Value (USD Billion) Forecast by Flavor, 2020 to 2035
  • Table 44: Eastern Europe Market Volume (Million Liters) Forecast by Flavor, 2020 to 2035
  • Table 45: Eastern Europe Market Value (USD Billion) Forecast by Application , 2020 to 2035
  • Table 46: Eastern Europe Market Volume (Million Liters) Forecast by Application , 2020 to 2035
  • Table 47: Eastern Europe Market Value (USD Billion) Forecast by Flavor Type, 2020 to 2035
  • Table 48: Eastern Europe Market Volume (Million Liters) Forecast by Flavor Type, 2020 to 2035
  • Table 49: Eastern Europe Market Value (USD Billion) Forecast by Product Type, 2020 to 2035
  • Table 50: Eastern Europe Market Volume (Million Liters) Forecast by Product Type, 2020 to 2035
  • Table 51: East Asia Market Value (USD Billion) Forecast by Country, 2020 to 2035
  • Table 52: East Asia Market Volume (Million Liters) Forecast by Country, 2020 to 2035
  • Table 53: East Asia Market Value (USD Billion) Forecast by Flavor, 2020 to 2035
  • Table 54: East Asia Market Volume (Million Liters) Forecast by Flavor, 2020 to 2035
  • Table 55: East Asia Market Value (USD Billion) Forecast by Application , 2020 to 2035
  • Table 56: East Asia Market Volume (Million Liters) Forecast by Application , 2020 to 2035
  • Table 57: East Asia Market Value (USD Billion) Forecast by Flavor Type, 2020 to 2035
  • Table 58: East Asia Market Volume (Million Liters) Forecast by Flavor Type, 2020 to 2035
  • Table 59: East Asia Market Value (USD Billion) Forecast by Product Type, 2020 to 2035
  • Table 60: East Asia Market Volume (Million Liters) Forecast by Product Type, 2020 to 2035
  • Table 61: South Asia & Pacific Market Value (USD Billion) Forecast by Country, 2020 to 2035
  • Table 62: South Asia & Pacific Market Volume (Million Liters) Forecast by Country, 2020 to 2035
  • Table 63: South Asia & Pacific Market Value (USD Billion) Forecast by Flavor, 2020 to 2035
  • Table 64: South Asia & Pacific Market Volume (Million Liters) Forecast by Flavor, 2020 to 2035
  • Table 65: South Asia & Pacific Market Value (USD Billion) Forecast by Application , 2020 to 2035
  • Table 66: South Asia & Pacific Market Volume (Million Liters) Forecast by Application , 2020 to 2035
  • Table 67: South Asia & Pacific Market Value (USD Billion) Forecast by Flavor Type, 2020 to 2035
  • Table 68: South Asia & Pacific Market Volume (Million Liters) Forecast by Flavor Type, 2020 to 2035
  • Table 69: South Asia & Pacific Market Value (USD Billion) Forecast by Product Type, 2020 to 2035
  • Table 70: South Asia & Pacific Market Volume (Million Liters) Forecast by Product Type, 2020 to 2035
  • Table 71: Middle East and Africa Market Value (USD Billion) Forecast by Country, 2020 to 2035
  • Table 72: Middle East and Africa Market Volume (Million Liters) Forecast by Country, 2020 to 2035
  • Table 73: Middle East and Africa Market Value (USD Billion) Forecast by Flavor, 2020 to 2035
  • Table 74: Middle East and Africa Market Volume (Million Liters) Forecast by Flavor, 2020 to 2035
  • Table 75: Middle East and Africa Market Value (USD Billion) Forecast by Application , 2020 to 2035
  • Table 76: Middle East and Africa Market Volume (Million Liters) Forecast by Application , 2020 to 2035
  • Table 77: Middle East and Africa Market Value (USD Billion) Forecast by Flavor Type, 2020 to 2035
  • Table 78: Middle East and Africa Market Volume (Million Liters) Forecast by Flavor Type, 2020 to 2035
  • Table 79: Middle East and Africa Market Value (USD Billion) Forecast by Product Type, 2020 to 2035
  • Table 80: Middle East and Africa Market Volume (Million Liters) Forecast by Product Type, 2020 to 2035

List of Figures

  • Figure 1: Global Market Volume (Million Liters) Forecast 2020 to 2035
  • Figure 2: Global Market Pricing Analysis
  • Figure 3: Global Market Value (USD Billion) Forecast 2020 to 2035
  • Figure 4: Global Market Value Share and BPS Analysis by Flavor, 2025 and 2035
  • Figure 5: Global Market Y-o-Y Growth Comparison by Flavor, 2025 to 2035
  • Figure 6: Global Market Attractiveness Analysis by Flavor
  • Figure 7: Global Market Value Share and BPS Analysis by Application , 2025 and 2035
  • Figure 8: Global Market Y-o-Y Growth Comparison by Application , 2025 to 2035
  • Figure 9: Global Market Attractiveness Analysis by Application
  • Figure 10: Global Market Value Share and BPS Analysis by Flavor Type, 2025 and 2035
  • Figure 11: Global Market Y-o-Y Growth Comparison by Flavor Type, 2025 to 2035
  • Figure 12: Global Market Attractiveness Analysis by Flavor Type
  • Figure 13: Global Market Value Share and BPS Analysis by Product Type, 2025 and 2035
  • Figure 14: Global Market Y-o-Y Growth Comparison by Product Type, 2025 to 2035
  • Figure 15: Global Market Attractiveness Analysis by Product Type
  • Figure 16: Global Market Value (USD Billion) Share and BPS Analysis by Region, 2025 and 2035
  • Figure 17: Global Market Y-o-Y Growth Comparison by Region, 2025 to 2035
  • Figure 18: Global Market Attractiveness Analysis by Region
  • Figure 19: North America Market Incremental $ Opportunity, 2025 to 2035
  • Figure 20: Latin America Market Incremental $ Opportunity, 2025 to 2035
  • Figure 21: Western Europe Market Incremental $ Opportunity, 2025 to 2035
  • Figure 22: Eastern Europe Market Incremental $ Opportunity, 2025 to 2035
  • Figure 23: East Asia Market Incremental $ Opportunity, 2025 to 2035
  • Figure 24: South Asia & Pacific Market Incremental $ Opportunity, 2025 to 2035
  • Figure 25: Middle East and Africa Market Incremental $ Opportunity, 2025 to 2035
  • Figure 26: North America Market Value Share and BPS Analysis by Country, 2025 and 2035
  • Figure 27: North America Market Value Share and BPS Analysis by Flavor, 2025 and 2035
  • Figure 28: North America Market Y-o-Y Growth Comparison by Flavor, 2025 to 2035
  • Figure 29: North America Market Attractiveness Analysis by Flavor
  • Figure 30: North America Market Value Share and BPS Analysis by Application , 2025 and 2035
  • Figure 31: North America Market Y-o-Y Growth Comparison by Application , 2025 to 2035
  • Figure 32: North America Market Attractiveness Analysis by Application
  • Figure 33: North America Market Value Share and BPS Analysis by Flavor Type, 2025 and 2035
  • Figure 34: North America Market Y-o-Y Growth Comparison by Flavor Type, 2025 to 2035
  • Figure 35: North America Market Attractiveness Analysis by Flavor Type
  • Figure 36: North America Market Value Share and BPS Analysis by Product Type, 2025 and 2035
  • Figure 37: North America Market Y-o-Y Growth Comparison by Product Type, 2025 to 2035
  • Figure 38: North America Market Attractiveness Analysis by Product Type
  • Figure 39: Latin America Market Value Share and BPS Analysis by Country, 2025 and 2035
  • Figure 40: Latin America Market Value Share and BPS Analysis by Flavor, 2025 and 2035
  • Figure 41: Latin America Market Y-o-Y Growth Comparison by Flavor, 2025 to 2035
  • Figure 42: Latin America Market Attractiveness Analysis by Flavor
  • Figure 43: Latin America Market Value Share and BPS Analysis by Application , 2025 and 2035
  • Figure 44: Latin America Market Y-o-Y Growth Comparison by Application , 2025 to 2035
  • Figure 45: Latin America Market Attractiveness Analysis by Application
  • Figure 46: Latin America Market Value Share and BPS Analysis by Flavor Type, 2025 and 2035
  • Figure 47: Latin America Market Y-o-Y Growth Comparison by Flavor Type, 2025 to 2035
  • Figure 48: Latin America Market Attractiveness Analysis by Flavor Type
  • Figure 49: Latin America Market Value Share and BPS Analysis by Product Type, 2025 and 2035
  • Figure 50: Latin America Market Y-o-Y Growth Comparison by Product Type, 2025 to 2035
  • Figure 51: Latin America Market Attractiveness Analysis by Product Type
  • Figure 52: Western Europe Market Value Share and BPS Analysis by Country, 2025 and 2035
  • Figure 53: Western Europe Market Value Share and BPS Analysis by Flavor, 2025 and 2035
  • Figure 54: Western Europe Market Y-o-Y Growth Comparison by Flavor, 2025 to 2035
  • Figure 55: Western Europe Market Attractiveness Analysis by Flavor
  • Figure 56: Western Europe Market Value Share and BPS Analysis by Application , 2025 and 2035
  • Figure 57: Western Europe Market Y-o-Y Growth Comparison by Application , 2025 to 2035
  • Figure 58: Western Europe Market Attractiveness Analysis by Application
  • Figure 59: Western Europe Market Value Share and BPS Analysis by Flavor Type, 2025 and 2035
  • Figure 60: Western Europe Market Y-o-Y Growth Comparison by Flavor Type, 2025 to 2035
  • Figure 61: Western Europe Market Attractiveness Analysis by Flavor Type
  • Figure 62: Western Europe Market Value Share and BPS Analysis by Product Type, 2025 and 2035
  • Figure 63: Western Europe Market Y-o-Y Growth Comparison by Product Type, 2025 to 2035
  • Figure 64: Western Europe Market Attractiveness Analysis by Product Type
  • Figure 65: Eastern Europe Market Value Share and BPS Analysis by Country, 2025 and 2035
  • Figure 66: Eastern Europe Market Value Share and BPS Analysis by Flavor, 2025 and 2035
  • Figure 67: Eastern Europe Market Y-o-Y Growth Comparison by Flavor, 2025 to 2035
  • Figure 68: Eastern Europe Market Attractiveness Analysis by Flavor
  • Figure 69: Eastern Europe Market Value Share and BPS Analysis by Application , 2025 and 2035
  • Figure 70: Eastern Europe Market Y-o-Y Growth Comparison by Application , 2025 to 2035
  • Figure 71: Eastern Europe Market Attractiveness Analysis by Application
  • Figure 72: Eastern Europe Market Value Share and BPS Analysis by Flavor Type, 2025 and 2035
  • Figure 73: Eastern Europe Market Y-o-Y Growth Comparison by Flavor Type, 2025 to 2035
  • Figure 74: Eastern Europe Market Attractiveness Analysis by Flavor Type
  • Figure 75: Eastern Europe Market Value Share and BPS Analysis by Product Type, 2025 and 2035
  • Figure 76: Eastern Europe Market Y-o-Y Growth Comparison by Product Type, 2025 to 2035
  • Figure 77: Eastern Europe Market Attractiveness Analysis by Product Type
  • Figure 78: East Asia Market Value Share and BPS Analysis by Country, 2025 and 2035
  • Figure 79: East Asia Market Value Share and BPS Analysis by Flavor, 2025 and 2035
  • Figure 80: East Asia Market Y-o-Y Growth Comparison by Flavor, 2025 to 2035
  • Figure 81: East Asia Market Attractiveness Analysis by Flavor
  • Figure 82: East Asia Market Value Share and BPS Analysis by Application , 2025 and 2035
  • Figure 83: East Asia Market Y-o-Y Growth Comparison by Application , 2025 to 2035
  • Figure 84: East Asia Market Attractiveness Analysis by Application
  • Figure 85: East Asia Market Value Share and BPS Analysis by Flavor Type, 2025 and 2035
  • Figure 86: East Asia Market Y-o-Y Growth Comparison by Flavor Type, 2025 to 2035
  • Figure 87: East Asia Market Attractiveness Analysis by Flavor Type
  • Figure 88: East Asia Market Value Share and BPS Analysis by Product Type, 2025 and 2035
  • Figure 89: East Asia Market Y-o-Y Growth Comparison by Product Type, 2025 to 2035
  • Figure 90: East Asia Market Attractiveness Analysis by Product Type
  • Figure 91: South Asia & Pacific Market Value Share and BPS Analysis by Country, 2025 and 2035
  • Figure 92: South Asia & Pacific Market Value Share and BPS Analysis by Flavor, 2025 and 2035
  • Figure 93: South Asia & Pacific Market Y-o-Y Growth Comparison by Flavor, 2025 to 2035
  • Figure 94: South Asia & Pacific Market Attractiveness Analysis by Flavor
  • Figure 95: South Asia & Pacific Market Value Share and BPS Analysis by Application , 2025 and 2035
  • Figure 96: South Asia & Pacific Market Y-o-Y Growth Comparison by Application , 2025 to 2035
  • Figure 97: South Asia & Pacific Market Attractiveness Analysis by Application
  • Figure 98: South Asia & Pacific Market Value Share and BPS Analysis by Flavor Type, 2025 and 2035
  • Figure 99: South Asia & Pacific Market Y-o-Y Growth Comparison by Flavor Type, 2025 to 2035
  • Figure 100: South Asia & Pacific Market Attractiveness Analysis by Flavor Type
  • Figure 101: South Asia & Pacific Market Value Share and BPS Analysis by Product Type, 2025 and 2035
  • Figure 102: South Asia & Pacific Market Y-o-Y Growth Comparison by Product Type, 2025 to 2035
  • Figure 103: South Asia & Pacific Market Attractiveness Analysis by Product Type
  • Figure 104: Middle East and Africa Market Value Share and BPS Analysis by Country, 2025 and 2035
  • Figure 105: Middle East and Africa Market Value Share and BPS Analysis by Flavor, 2025 and 2035
  • Figure 106: Middle East and Africa Market Y-o-Y Growth Comparison by Flavor, 2025 to 2035
  • Figure 107: Middle East and Africa Market Attractiveness Analysis by Flavor
  • Figure 108: Middle East and Africa Market Value Share and BPS Analysis by Application , 2025 and 2035
  • Figure 109: Middle East and Africa Market Y-o-Y Growth Comparison by Application , 2025 to 2035
  • Figure 110: Middle East and Africa Market Attractiveness Analysis by Application
  • Figure 111: Middle East and Africa Market Value Share and BPS Analysis by Flavor Type, 2025 and 2035
  • Figure 112: Middle East and Africa Market Y-o-Y Growth Comparison by Flavor Type, 2025 to 2035
  • Figure 113: Middle East and Africa Market Attractiveness Analysis by Flavor Type
  • Figure 114: Middle East and Africa Market Value Share and BPS Analysis by Product Type, 2025 and 2035
  • Figure 115: Middle East and Africa Market Y-o-Y Growth Comparison by Product Type, 2025 to 2035
  • Figure 116: Middle East and Africa Market Attractiveness Analysis by Product Type
  • Figure 117: Global Market - Tier Structure Analysis
  • Figure 118: Global Market - Company Share Analysis

Frequently Asked Questions

What is the projected size of the flavored syrup market in 2025?

The market is valued at USD 59.5 billion in 2025.

What is the outlook on flavored syrup demand by 2035?

The market is forecasted to reach USD 84.4 billion by 2035, reflecting a CAGR of 3.5%.

Which segment leads the flavored syrup market by flavor type in 2025?

Sweet-flavored syrups are expected to hold approximately over 60% of the global market share in 2025.

What is the top application sector for the flavored syrup market in 2025?

Beverages will dominate the application segment with a 42% share in 2025.

Which country is projected to have the fastest-growing flavored syrup market?

Germany is anticipated to be the fastest-growing market, with a CAGR of 6.5% from 2025 to 2035.

Explore Similar Insights

Future Market Insights

Flavored Syrup Market