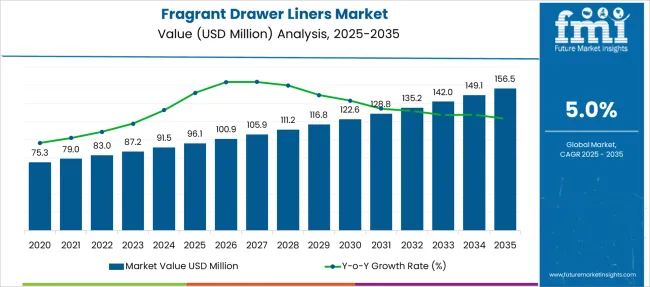
The fragrant drawer liners market is expected to expand its roots at a low CAGR of 5% during the forecast period. The global market holds an estimated revenue of USD 83 Million in 2022 and is likely to cross USD 128.76 Million by the end of 2032.
The fragrant drawer liners market is anticipated to show promising growth prospects during the forecast period.
Attributes | Details |
---|---|
CAGR (2022 to 2032) | 5% |
Value (2022) | USD 83 Million |
Value (2032) | USD 128.76 Million |
Fragrant drawer liners are basically used in protecting the shelves and drawers and keeping them clean and sanitized. Fragrant drawer liners help the drawers in providing a fresh scent without using any room sprays or the same sort of products. Demand for fragrant drawer liners is rising as their used in home cabinets and drawers, bathroom vanity, bedroom wardrobe, and kitchen cabinets.
Demand for fragrant drawer liners rises as new companies/manufacturers are focusing on bleach-free and machine washable drawers that are non-adhesive drawer line as it does not stick to the drawer and leaves no residue, increasing sales of fragrant drawer liners.
Colored and printed fragrant drawer liners are estimated to be a highly attractive choice for end users. The manufacturers are producing both adhesive and non-adhesive both types of fragrant drawer liners that are resistant to chemicals, acids, detergents, and grease.
The boxes contain 6, 12, or 18 sheets in each. The production of fragrant drawer liners comes under Food & Drug Authorities’ (FDA) regulations. This pushes the sales of fragrant drawer liners.
Most of the manufacturers produce machine washable and bleach-free fragrant drawer liners. The availability of fragrant drawer liners is mostly seen in supermarkets/hypermarkets.
Moreover, the availability of fragrant drawer liners on e-commerce has also driven the market. Thus, easy availability and growth in shelf liners also drive the demand for fragrant drawer liners.
In terms of geography, the fragrant drawer liners market can be segmented into North America, Latin America, Europe, South Asia, East Asia, Middle East & Africa, and Oceania.
North America and Europe are expected to dominate the market due to their reusability, protective nature from scratches, and easy use. The fragrant drawer liners market is expected to register healthy growth across all the geographies during the forecast period, increasing the sales of fragrant drawer liners.
A growing number of hotels and laundries increasing awareness of sanitary products are likely to drive the sales of fragrant drawer liners. Emerging countries, such as China and India, are the key markets with immense opportunities for fragrant drawer liners market due to their high presence online or e-commerce. The growth of the market depends upon the standard of living and product awareness among consumers.
North America dominates the fragrant drawer liners market due to the high standard of living of consumers, and the high adoption rate of shelf liners, fueling the demand for fragrant drawer liners. Additionally, other developed regions such as Europe and Oceania are projected to showcase steady growth in the global fragrant drawer liners market due to higher product knowledge, and product availability in physical stores/supermarkets and online.
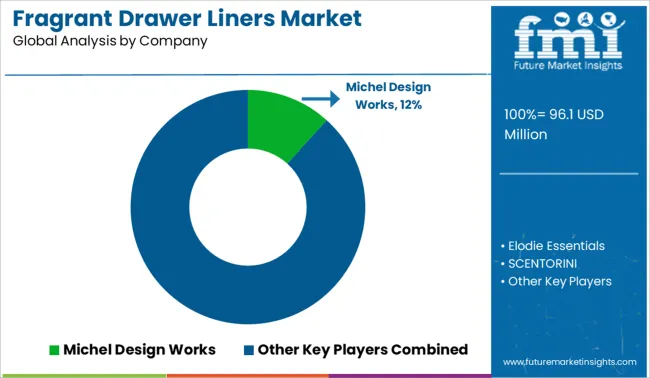
The key players in the fragrant drawer liners market are focusing on reusability, protective nature, and easy implementation of these liners. This drives the sales of fragrant drawer liner products.
Key players in the fragrant drawer liners market include Orlandi, Print Fragrancing, Crabtree & Evelyn.
Recent Market Development:
Report Attribute | Details |
---|---|
Growth Rate | CAGR of 5% from 2022 to 2032 |
The base year for estimation | 2021 |
Historical data | 2015 to 2020 |
Forecast period | 2022 to 2032 |
Quantitative units | Revenue in USD Million, volume in kilotons, and CAGR from 2022 to 2032 |
Report Coverage | Revenue forecast, volume forecast, company ranking, competitive landscape, growth factors, and trends, Pricing Analysis |
Segments Covered | Product type, Price range, Material Type, Application, Sales Channel, Region |
Regional scope | North America; Western Europe; Eastern Europe; Middle East; Africa; ASEAN; South Asia; Rest of Asia; Australia; and New Zealand |
Country scope | USA, Canada, Mexico, Germany, United Kingdom, France, Italy, Spain, Russia, Belgium, Poland, Czech Republic, China, India, Japan, Australia, Brazil, Argentina, Colombia, Saudi Arabia, United Arab Emirates(UAE), Iran, South Africa |
Key companies profiled | Orlandi; Print Fragrancing; Crabtree & Evelyn |
Customization scope | Free report customization (equivalent to up to 8 analysts' working days) with purchase. Addition or alteration to country, regional & segment scope. |
Pricing and purchase options | Avail customized purchase options to meet your exact research needs. |
Table 1: Global Market Value (US$ Million) Forecast by Region, 2017 to 2032
Table 2: Global Market Volume (Million Units) Forecast by Region, 2017 to 2032
Table 3: Global Market Value (US$ Million) Forecast by Material Type, 2017 to 2032
Table 4: Global Market Volume (Million Units) Forecast by Material Type, 2017 to 2032
Table 5: Global Market Value (US$ Million) Forecast by Application, 2017 to 2032
Table 6: Global Market Volume (Million Units) Forecast by Application, 2017 to 2032
Table 7: Global Market Value (US$ Million) Forecast by Price Range, 2017 to 2032
Table 8: Global Market Volume (Million Units) Forecast by Price Range, 2017 to 2032
Table 9: Global Market Value (US$ Million) Forecast by Sales Channels, 2017 to 2032
Table 10: Global Market Volume (Million Units) Forecast by Sales Channels, 2017 to 2032
Table 11: North America Market Value (US$ Million) Forecast by Country, 2017 to 2032
Table 12: North America Market Volume (Million Units) Forecast by Country, 2017 to 2032
Table 13: North America Market Value (US$ Million) Forecast by Material Type, 2017 to 2032
Table 14: North America Market Volume (Million Units) Forecast by Material Type, 2017 to 2032
Table 15: North America Market Value (US$ Million) Forecast by Application, 2017 to 2032
Table 16: North America Market Volume (Million Units) Forecast by Application, 2017 to 2032
Table 17: North America Market Value (US$ Million) Forecast by Price Range, 2017 to 2032
Table 18: North America Market Volume (Million Units) Forecast by Price Range, 2017 to 2032
Table 19: North America Market Value (US$ Million) Forecast by Sales Channels, 2017 to 2032
Table 20: North America Market Volume (Million Units) Forecast by Sales Channels, 2017 to 2032
Table 21: Latin America Market Value (US$ Million) Forecast by Country, 2017 to 2032
Table 22: Latin America Market Volume (Million Units) Forecast by Country, 2017 to 2032
Table 23: Latin America Market Value (US$ Million) Forecast by Material Type, 2017 to 2032
Table 24: Latin America Market Volume (Million Units) Forecast by Material Type, 2017 to 2032
Table 25: Latin America Market Value (US$ Million) Forecast by Application, 2017 to 2032
Table 26: Latin America Market Volume (Million Units) Forecast by Application, 2017 to 2032
Table 27: Latin America Market Value (US$ Million) Forecast by Price Range, 2017 to 2032
Table 28: Latin America Market Volume (Million Units) Forecast by Price Range, 2017 to 2032
Table 29: Latin America Market Value (US$ Million) Forecast by Sales Channels, 2017 to 2032
Table 30: Latin America Market Volume (Million Units) Forecast by Sales Channels, 2017 to 2032
Table 31: Europe Market Value (US$ Million) Forecast by Country, 2017 to 2032
Table 32: Europe Market Volume (Million Units) Forecast by Country, 2017 to 2032
Table 33: Europe Market Value (US$ Million) Forecast by Material Type, 2017 to 2032
Table 34: Europe Market Volume (Million Units) Forecast by Material Type, 2017 to 2032
Table 35: Europe Market Value (US$ Million) Forecast by Application, 2017 to 2032
Table 36: Europe Market Volume (Million Units) Forecast by Application, 2017 to 2032
Table 37: Europe Market Value (US$ Million) Forecast by Price Range, 2017 to 2032
Table 38: Europe Market Volume (Million Units) Forecast by Price Range, 2017 to 2032
Table 39: Europe Market Value (US$ Million) Forecast by Sales Channels, 2017 to 2032
Table 40: Europe Market Volume (Million Units) Forecast by Sales Channels, 2017 to 2032
Table 41: Asia Pacific Market Value (US$ Million) Forecast by Country, 2017 to 2032
Table 42: Asia Pacific Market Volume (Million Units) Forecast by Country, 2017 to 2032
Table 43: Asia Pacific Market Value (US$ Million) Forecast by Material Type, 2017 to 2032
Table 44: Asia Pacific Market Volume (Million Units) Forecast by Material Type, 2017 to 2032
Table 45: Asia Pacific Market Value (US$ Million) Forecast by Application, 2017 to 2032
Table 46: Asia Pacific Market Volume (Million Units) Forecast by Application, 2017 to 2032
Table 47: Asia Pacific Market Value (US$ Million) Forecast by Price Range, 2017 to 2032
Table 48: Asia Pacific Market Volume (Million Units) Forecast by Price Range, 2017 to 2032
Table 49: Asia Pacific Market Value (US$ Million) Forecast by Sales Channels, 2017 to 2032
Table 50: Asia Pacific Market Volume (Million Units) Forecast by Sales Channels, 2017 to 2032
Table 51: MEA Market Value (US$ Million) Forecast by Country, 2017 to 2032
Table 52: MEA Market Volume (Million Units) Forecast by Country, 2017 to 2032
Table 53: MEA Market Value (US$ Million) Forecast by Material Type, 2017 to 2032
Table 54: MEA Market Volume (Million Units) Forecast by Material Type, 2017 to 2032
Table 55: MEA Market Value (US$ Million) Forecast by Application, 2017 to 2032
Table 56: MEA Market Volume (Million Units) Forecast by Application, 2017 to 2032
Table 57: MEA Market Value (US$ Million) Forecast by Price Range, 2017 to 2032
Table 58: MEA Market Volume (Million Units) Forecast by Price Range, 2017 to 2032
Table 59: MEA Market Value (US$ Million) Forecast by Sales Channels, 2017 to 2032
Table 60: MEA Market Volume (Million Units) Forecast by Sales Channels, 2017 to 2032
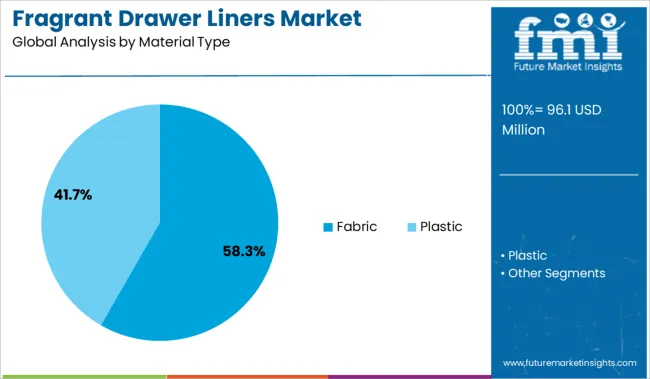
Figure 1: Global Market Value (US$ Million) by Material Type, 2022 to 2032
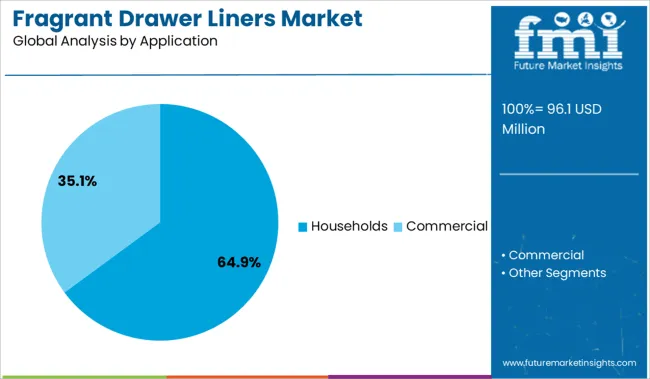
Figure 2: Global Market Value (US$ Million) by Application, 2022 to 2032
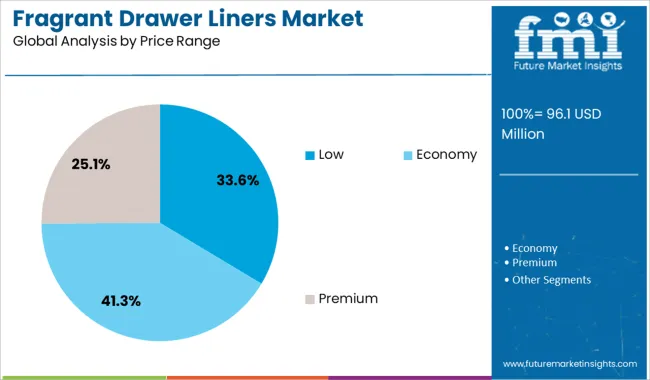
Figure 3: Global Market Value (US$ Million) by Price Range, 2022 to 2032
Figure 4: Global Market Value (US$ Million) by Sales Channels, 2022 to 2032
Figure 5: Global Market Value (US$ Million) by Region, 2022 to 2032
Figure 6: Global Market Value (US$ Million) Analysis by Region, 2017 to 2032
Figure 7: Global Market Volume (Million Units) Analysis by Region, 2017 to 2032
Figure 8: Global Market Value Share (%) and BPS Analysis by Region, 2022 to 2032
Figure 9: Global Market Y-o-Y Growth (%) Projections by Region, 2022 to 2032
Figure 10: Global Market Value (US$ Million) Analysis by Material Type, 2017 to 2032
Figure 11: Global Market Volume (Million Units) Analysis by Material Type, 2017 to 2032
Figure 12: Global Market Value Share (%) and BPS Analysis by Material Type, 2022 to 2032
Figure 13: Global Market Y-o-Y Growth (%) Projections by Material Type, 2022 to 2032
Figure 14: Global Market Value (US$ Million) Analysis by Application, 2017 to 2032
Figure 15: Global Market Volume (Million Units) Analysis by Application, 2017 to 2032
Figure 16: Global Market Value Share (%) and BPS Analysis by Application, 2022 to 2032
Figure 17: Global Market Y-o-Y Growth (%) Projections by Application, 2022 to 2032
Figure 18: Global Market Value (US$ Million) Analysis by Price Range, 2017 to 2032
Figure 19: Global Market Volume (Million Units) Analysis by Price Range, 2017 to 2032
Figure 20: Global Market Value Share (%) and BPS Analysis by Price Range, 2022 to 2032
Figure 21: Global Market Y-o-Y Growth (%) Projections by Price Range, 2022 to 2032
Figure 22: Global Market Value (US$ Million) Analysis by Sales Channels, 2017 to 2032
Figure 23: Global Market Volume (Million Units) Analysis by Sales Channels, 2017 to 2032
Figure 24: Global Market Value Share (%) and BPS Analysis by Sales Channels, 2022 to 2032
Figure 25: Global Market Y-o-Y Growth (%) Projections by Sales Channels, 2022 to 2032
Figure 26: Global Market Attractiveness by Material Type, 2022 to 2032
Figure 27: Global Market Attractiveness by Application, 2022 to 2032
Figure 28: Global Market Attractiveness by Price Range, 2022 to 2032
Figure 29: Global Market Attractiveness by Sales Channels, 2022 to 2032
Figure 30: Global Market Attractiveness by Region, 2022 to 2032
Figure 31: North America Market Value (US$ Million) by Material Type, 2022 to 2032
Figure 32: North America Market Value (US$ Million) by Application, 2022 to 2032
Figure 33: North America Market Value (US$ Million) by Price Range, 2022 to 2032
Figure 34: North America Market Value (US$ Million) by Sales Channels, 2022 to 2032
Figure 35: North America Market Value (US$ Million) by Country, 2022 to 2032
Figure 36: North America Market Value (US$ Million) Analysis by Country, 2017 to 2032
Figure 37: North America Market Volume (Million Units) Analysis by Country, 2017 to 2032
Figure 38: North America Market Value Share (%) and BPS Analysis by Country, 2022 to 2032
Figure 39: North America Market Y-o-Y Growth (%) Projections by Country, 2022 to 2032
Figure 40: North America Market Value (US$ Million) Analysis by Material Type, 2017 to 2032
Figure 41: North America Market Volume (Million Units) Analysis by Material Type, 2017 to 2032
Figure 42: North America Market Value Share (%) and BPS Analysis by Material Type, 2022 to 2032
Figure 43: North America Market Y-o-Y Growth (%) Projections by Material Type, 2022 to 2032
Figure 44: North America Market Value (US$ Million) Analysis by Application, 2017 to 2032
Figure 45: North America Market Volume (Million Units) Analysis by Application, 2017 to 2032
Figure 46: North America Market Value Share (%) and BPS Analysis by Application, 2022 to 2032
Figure 47: North America Market Y-o-Y Growth (%) Projections by Application, 2022 to 2032
Figure 48: North America Market Value (US$ Million) Analysis by Price Range, 2017 to 2032
Figure 49: North America Market Volume (Million Units) Analysis by Price Range, 2017 to 2032
Figure 50: North America Market Value Share (%) and BPS Analysis by Price Range, 2022 to 2032
Figure 51: North America Market Y-o-Y Growth (%) Projections by Price Range, 2022 to 2032
Figure 52: North America Market Value (US$ Million) Analysis by Sales Channels, 2017 to 2032
Figure 53: North America Market Volume (Million Units) Analysis by Sales Channels, 2017 to 2032
Figure 54: North America Market Value Share (%) and BPS Analysis by Sales Channels, 2022 to 2032
Figure 55: North America Market Y-o-Y Growth (%) Projections by Sales Channels, 2022 to 2032
Figure 56: North America Market Attractiveness by Material Type, 2022 to 2032
Figure 57: North America Market Attractiveness by Application, 2022 to 2032
Figure 58: North America Market Attractiveness by Price Range, 2022 to 2032
Figure 59: North America Market Attractiveness by Sales Channels, 2022 to 2032
Figure 60: North America Market Attractiveness by Country, 2022 to 2032
Figure 61: Latin America Market Value (US$ Million) by Material Type, 2022 to 2032
Figure 62: Latin America Market Value (US$ Million) by Application, 2022 to 2032
Figure 63: Latin America Market Value (US$ Million) by Price Range, 2022 to 2032
Figure 64: Latin America Market Value (US$ Million) by Sales Channels, 2022 to 2032
Figure 65: Latin America Market Value (US$ Million) by Country, 2022 to 2032
Figure 66: Latin America Market Value (US$ Million) Analysis by Country, 2017 to 2032
Figure 67: Latin America Market Volume (Million Units) Analysis by Country, 2017 to 2032
Figure 68: Latin America Market Value Share (%) and BPS Analysis by Country, 2022 to 2032
Figure 69: Latin America Market Y-o-Y Growth (%) Projections by Country, 2022 to 2032
Figure 70: Latin America Market Value (US$ Million) Analysis by Material Type, 2017 to 2032
Figure 71: Latin America Market Volume (Million Units) Analysis by Material Type, 2017 to 2032
Figure 72: Latin America Market Value Share (%) and BPS Analysis by Material Type, 2022 to 2032
Figure 73: Latin America Market Y-o-Y Growth (%) Projections by Material Type, 2022 to 2032
Figure 74: Latin America Market Value (US$ Million) Analysis by Application, 2017 to 2032
Figure 75: Latin America Market Volume (Million Units) Analysis by Application, 2017 to 2032
Figure 76: Latin America Market Value Share (%) and BPS Analysis by Application, 2022 to 2032
Figure 77: Latin America Market Y-o-Y Growth (%) Projections by Application, 2022 to 2032
Figure 78: Latin America Market Value (US$ Million) Analysis by Price Range, 2017 to 2032
Figure 79: Latin America Market Volume (Million Units) Analysis by Price Range, 2017 to 2032
Figure 80: Latin America Market Value Share (%) and BPS Analysis by Price Range, 2022 to 2032
Figure 81: Latin America Market Y-o-Y Growth (%) Projections by Price Range, 2022 to 2032
Figure 82: Latin America Market Value (US$ Million) Analysis by Sales Channels, 2017 to 2032
Figure 83: Latin America Market Volume (Million Units) Analysis by Sales Channels, 2017 to 2032
Figure 84: Latin America Market Value Share (%) and BPS Analysis by Sales Channels, 2022 to 2032
Figure 85: Latin America Market Y-o-Y Growth (%) Projections by Sales Channels, 2022 to 2032
Figure 86: Latin America Market Attractiveness by Material Type, 2022 to 2032
Figure 87: Latin America Market Attractiveness by Application, 2022 to 2032
Figure 88: Latin America Market Attractiveness by Price Range, 2022 to 2032
Figure 89: Latin America Market Attractiveness by Sales Channels, 2022 to 2032
Figure 90: Latin America Market Attractiveness by Country, 2022 to 2032
Figure 91: Europe Market Value (US$ Million) by Material Type, 2022 to 2032
Figure 92: Europe Market Value (US$ Million) by Application, 2022 to 2032
Figure 93: Europe Market Value (US$ Million) by Price Range, 2022 to 2032
Figure 94: Europe Market Value (US$ Million) by Sales Channels, 2022 to 2032
Figure 95: Europe Market Value (US$ Million) by Country, 2022 to 2032
Figure 96: Europe Market Value (US$ Million) Analysis by Country, 2017 to 2032
Figure 97: Europe Market Volume (Million Units) Analysis by Country, 2017 to 2032
Figure 98: Europe Market Value Share (%) and BPS Analysis by Country, 2022 to 2032
Figure 99: Europe Market Y-o-Y Growth (%) Projections by Country, 2022 to 2032
Figure 100: Europe Market Value (US$ Million) Analysis by Material Type, 2017 to 2032
Figure 101: Europe Market Volume (Million Units) Analysis by Material Type, 2017 to 2032
Figure 102: Europe Market Value Share (%) and BPS Analysis by Material Type, 2022 to 2032
Figure 103: Europe Market Y-o-Y Growth (%) Projections by Material Type, 2022 to 2032
Figure 104: Europe Market Value (US$ Million) Analysis by Application, 2017 to 2032
Figure 105: Europe Market Volume (Million Units) Analysis by Application, 2017 to 2032
Figure 106: Europe Market Value Share (%) and BPS Analysis by Application, 2022 to 2032
Figure 107: Europe Market Y-o-Y Growth (%) Projections by Application, 2022 to 2032
Figure 108: Europe Market Value (US$ Million) Analysis by Price Range, 2017 to 2032
Figure 109: Europe Market Volume (Million Units) Analysis by Price Range, 2017 to 2032
Figure 110: Europe Market Value Share (%) and BPS Analysis by Price Range, 2022 to 2032
Figure 111: Europe Market Y-o-Y Growth (%) Projections by Price Range, 2022 to 2032
Figure 112: Europe Market Value (US$ Million) Analysis by Sales Channels, 2017 to 2032
Figure 113: Europe Market Volume (Million Units) Analysis by Sales Channels, 2017 to 2032
Figure 114: Europe Market Value Share (%) and BPS Analysis by Sales Channels, 2022 to 2032
Figure 115: Europe Market Y-o-Y Growth (%) Projections by Sales Channels, 2022 to 2032
Figure 116: Europe Market Attractiveness by Material Type, 2022 to 2032
Figure 117: Europe Market Attractiveness by Application, 2022 to 2032
Figure 118: Europe Market Attractiveness by Price Range, 2022 to 2032
Figure 119: Europe Market Attractiveness by Sales Channels, 2022 to 2032
Figure 120: Europe Market Attractiveness by Country, 2022 to 2032
Figure 121: Asia Pacific Market Value (US$ Million) by Material Type, 2022 to 2032
Figure 122: Asia Pacific Market Value (US$ Million) by Application, 2022 to 2032
Figure 123: Asia Pacific Market Value (US$ Million) by Price Range, 2022 to 2032
Figure 124: Asia Pacific Market Value (US$ Million) by Sales Channels, 2022 to 2032
Figure 125: Asia Pacific Market Value (US$ Million) by Country, 2022 to 2032
Figure 126: Asia Pacific Market Value (US$ Million) Analysis by Country, 2017 to 2032
Figure 127: Asia Pacific Market Volume (Million Units) Analysis by Country, 2017 to 2032
Figure 128: Asia Pacific Market Value Share (%) and BPS Analysis by Country, 2022 to 2032
Figure 129: Asia Pacific Market Y-o-Y Growth (%) Projections by Country, 2022 to 2032
Figure 130: Asia Pacific Market Value (US$ Million) Analysis by Material Type, 2017 to 2032
Figure 131: Asia Pacific Market Volume (Million Units) Analysis by Material Type, 2017 to 2032
Figure 132: Asia Pacific Market Value Share (%) and BPS Analysis by Material Type, 2022 to 2032
Figure 133: Asia Pacific Market Y-o-Y Growth (%) Projections by Material Type, 2022 to 2032
Figure 134: Asia Pacific Market Value (US$ Million) Analysis by Application, 2017 to 2032
Figure 135: Asia Pacific Market Volume (Million Units) Analysis by Application, 2017 to 2032
Figure 136: Asia Pacific Market Value Share (%) and BPS Analysis by Application, 2022 to 2032
Figure 137: Asia Pacific Market Y-o-Y Growth (%) Projections by Application, 2022 to 2032
Figure 138: Asia Pacific Market Value (US$ Million) Analysis by Price Range, 2017 to 2032
Figure 139: Asia Pacific Market Volume (Million Units) Analysis by Price Range, 2017 to 2032
Figure 140: Asia Pacific Market Value Share (%) and BPS Analysis by Price Range, 2022 to 2032
Figure 141: Asia Pacific Market Y-o-Y Growth (%) Projections by Price Range, 2022 to 2032
Figure 142: Asia Pacific Market Value (US$ Million) Analysis by Sales Channels, 2017 to 2032
Figure 143: Asia Pacific Market Volume (Million Units) Analysis by Sales Channels, 2017 to 2032
Figure 144: Asia Pacific Market Value Share (%) and BPS Analysis by Sales Channels, 2022 to 2032
Figure 145: Asia Pacific Market Y-o-Y Growth (%) Projections by Sales Channels, 2022 to 2032
Figure 146: Asia Pacific Market Attractiveness by Material Type, 2022 to 2032
Figure 147: Asia Pacific Market Attractiveness by Application, 2022 to 2032
Figure 148: Asia Pacific Market Attractiveness by Price Range, 2022 to 2032
Figure 149: Asia Pacific Market Attractiveness by Sales Channels, 2022 to 2032
Figure 150: Asia Pacific Market Attractiveness by Country, 2022 to 2032
Figure 151: MEA Market Value (US$ Million) by Material Type, 2022 to 2032
Figure 152: MEA Market Value (US$ Million) by Application, 2022 to 2032
Figure 153: MEA Market Value (US$ Million) by Price Range, 2022 to 2032
Figure 154: MEA Market Value (US$ Million) by Sales Channels, 2022 to 2032
Figure 155: MEA Market Value (US$ Million) by Country, 2022 to 2032
Figure 156: MEA Market Value (US$ Million) Analysis by Country, 2017 to 2032
Figure 157: MEA Market Volume (Million Units) Analysis by Country, 2017 to 2032
Figure 158: MEA Market Value Share (%) and BPS Analysis by Country, 2022 to 2032
Figure 159: MEA Market Y-o-Y Growth (%) Projections by Country, 2022 to 2032
Figure 160: MEA Market Value (US$ Million) Analysis by Material Type, 2017 to 2032
Figure 161: MEA Market Volume (Million Units) Analysis by Material Type, 2017 to 2032
Figure 162: MEA Market Value Share (%) and BPS Analysis by Material Type, 2022 to 2032
Figure 163: MEA Market Y-o-Y Growth (%) Projections by Material Type, 2022 to 2032
Figure 164: MEA Market Value (US$ Million) Analysis by Application, 2017 to 2032
Figure 165: MEA Market Volume (Million Units) Analysis by Application, 2017 to 2032
Figure 166: MEA Market Value Share (%) and BPS Analysis by Application, 2022 to 2032
Figure 167: MEA Market Y-o-Y Growth (%) Projections by Application, 2022 to 2032
Figure 168: MEA Market Value (US$ Million) Analysis by Price Range, 2017 to 2032
Figure 169: MEA Market Volume (Million Units) Analysis by Price Range, 2017 to 2032
Figure 170: MEA Market Value Share (%) and BPS Analysis by Price Range, 2022 to 2032
Figure 171: MEA Market Y-o-Y Growth (%) Projections by Price Range, 2022 to 2032
Figure 172: MEA Market Value (US$ Million) Analysis by Sales Channels, 2017 to 2032
Figure 173: MEA Market Volume (Million Units) Analysis by Sales Channels, 2017 to 2032
Figure 174: MEA Market Value Share (%) and BPS Analysis by Sales Channels, 2022 to 2032
Figure 175: MEA Market Y-o-Y Growth (%) Projections by Sales Channels, 2022 to 2032
Figure 176: MEA Market Attractiveness by Material Type, 2022 to 2032
Figure 177: MEA Market Attractiveness by Application, 2022 to 2032
Figure 178: MEA Market Attractiveness by Price Range, 2022 to 2032
Figure 179: MEA Market Attractiveness by Sales Channels, 2022 to 2032
Figure 180: MEA Market Attractiveness by Country, 2022 to 2032
The supermarket is the biggest sales channel in the fragrant drawer liners market. The factors that lead to the high growth through this channel are easy availability, convenience, customers’ offline shopping behavior in supermarkets, and discounts. This leads to the high demand for fragrant drawer liners in developed countries like USA and Canada.
Key competitors holding substantial fragrant drawer liners market share include Orlandi, Print Fragrancing, Crabtree & Evelyn.
Demand for Fragrant drawer liners is likely to increase with the high demand from hotels, residential, and hospitality industry are driving the sales of fragrant drawer liners.
Explore Similar Insights
Thank you!
You will receive an email from our Business Development Manager. Please be sure to check your SPAM/JUNK folder too.