Reports

- Global Locations -

Headquarters

Future Market Insights, Inc.

Christiana Corporate, 200
Continental Drive, Suite 401,
Newark, Delaware - 19713,
United States

T: +1-347-918-3531

Americas

Future Market Insights, Inc.

616 Corporate Way, Suite 2-9018,
Valley Cottage, NY 10989, United States

MEA

Future Market Insights

1602-6 Jumeirah Bay X2 Tower, Plot No: JLT-PH2-X2A,
Jumeirah Lakes Towers, Dubai,
United Arab Emirates

Europe

Future Market Insights

3rd Floor, 207 Regent Street,
W1B 3HH London
United Kingdom

T: + 44 (0) 20 8123 9659

Asia Pacific

Future Market Insights

IndiaLand Global Tech Park, Unit UG-1, Behind Grand HighStreet, Phase 1, Hinjawadi, MH, Pune – 411057, India

Pond Liners Market Outlook (2023 to 2033)

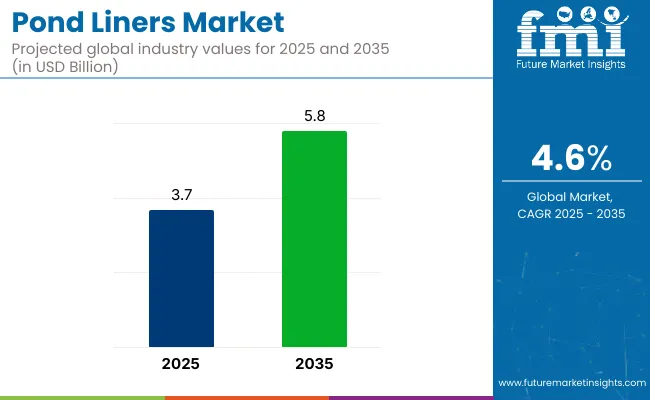
Future Market Insights (FMI) reveals that the pond liners market is projected to expand at 7.5% CAGR during the forecast period 2023 to 2033. Valuation is poised to reach US$ 1.8 billion in 2023. By 2033, the global market is set to witness a total of US$ 3.8 billion. The market stood at US$ 1.7 billion at the end of 2022.

Pond liners have gained prominence due to their capacity to endure a wide range of water and environmental variables. Customers prefer it since they help in providing resistance to the ozone and against oxidation. These factors are expected to drive demand for pond liners through 2033.

Rising usage in salt-water farming, ash from coal confinement, disposal of waste, mining, and water management have necessitated the usage of pond liners. It has also helped mitigate user worries about water shortages and emphasized water conservation.

The rising popularity of decorative ponds in residential and commercial landscapes is a significant driver for pond liners. Pond liners are essential for creating and maintaining such water features, providing a watertight barrier to prevent leakage and maintain water levels.

The increasing interest in landscaping and gardening, both in residential and commercial settings is likely to drive demand for pond liners during the forecast period. Several homeowners and landscape professionals incorporate ponds and water features into their designs. These would require reliable liners to retain water effectively.

The focus on environmental conservation and sustainable practices has led to the construction of natural and artificial ponds for ecological purposes. These ponds are used for storm water management, wildlife habitats, and water treatment.

Pond liners play a crucial role in ensuring water retention and preventing contamination and supporting environmental conservation initiatives. This is expected to fuel the demand for pond liners throughout the projection period.

Pond liners are widely used in agriculture and aquaculture for diverse purposes. They help in creating fish ponds, irrigation reservoirs, and containment ponds for agricultural and aquaculture activities. The increasing demand for sustainable food production and aquaculture has also contributed to high demand for pond liners.

The construction of reservoirs, water storage facilities, and recreational water bodies require pond liners to prevent seepage and ensure efficient water storage. As infrastructure development projects continue to rise, the demand for pond liners as a reliable water containment solution is expected to increase.

Advances in materials and manufacturing technologies have improved the quality and performance of pond liners. New liner materials have been developed, such as reinforced polyethylene (RPE) and EPDM (ethylene propylene diene terpolymer).

Novel materials offer enhanced durability, flexibility, and resistance to UV radiation, punctures, and chemical degradation. These technological advancements have expanded the application scope of pond liners and increased their adoption.

Key Trends Shaping the Market:

  • Growing trend among homeowners and landscapers to incorporate decorative ponds and water features in the garden and outdoor spaces.
  • Growing emphasis on using eco-friendly solutions across several sectors related to water and water management is likely to drive demand for pond liners.
  • Customization options, such as pre-formed liners and lines with integrated shelves and steps, are becoming more popular to cater to different customer requirements.
  • New materials like RPE and EPDM are being developed for pond liners, which increase their durability and life span, making it cost-effective for customers.
  • Growing rate of artificial pond construction for storm water management and water treatment is driving sales of pond liners.
Attribute Key Insights
Pond Liners Market Actual Size (2022A) ~US$ 1.7 billion
Estimated Market Size (2023E) ~US$ 1.8 billion
Projected Market Size (2033F) ~US$ 3.8 billion
Value-based CAGR (2023 to 2033) ~7.5% CAGR

Don't pay for what you don't need

Customize your report by selecting specific countries or regions and save 30%!

2018 to 2022 Pond Liners Market Outlook Compared to 2023 to 2033 Forecast

The pond liners market is poised to witness 7.5% CAGR during the forecast period 2023 to 2033. From 2018 to 2022, sales expanded at 9.1% CAGR.

The pond liners industry is witnessing the adoption of advanced manufacturing technologies, such as extrusion coating and calendaring. This is being done to produce liners with improved strength, flexibility, and chemical resistance. These advancements in manufacturing techniques enhance the overall performance and durability of pond liners.

Rapid urbanization and infrastructure development projects, such as construction of reservoirs, retention ponds, and decorative water features, contribute to the demand for pond liners. Customers prefer them since they provide effective solutions for water containment, erosion control, and landscaping purposes.

With the growing interest in landscaping and gardening, there is an increased demand for decorative ponds and water gardens. Consumers use pond liners to create and maintain these water features, offering waterproofing and shape customization options.

Manufacturers are focusing on developing innovative materials and designs for pond liners to meet specific customer requirements. This includes liners with enhanced UV resistance, improved tear strength, and customized sizes and shapes to fit diverse pond configurations.

Rapid urbanization has led to small outdoor spaces, prompting the trend of constructing compact water features like patio ponds or rooftop gardens. Pond liners are vital components in such installations, as they provide a contained and controlled water environment within limited areas.

The growing popularity of DIY landscaping projects has contributed to the demand for pond liners. Homeowners and gardening enthusiasts often undertake pond construction themselves, and the availability of user-friendly pond liner kits and resources facilitates their efforts.

Key Dynamics in Pond Liners Market Globally

  • Increasing Demand for Geomembrane Liners:

Geomembrane liners, which are made from synthetic materials such as HDPE (High-Density Polyethylene), PVC (Polyvinyl Chloride), and EPDM (Ethylene Propylene Diene Monomer), are widely used in pond lining applications. The demand for these liners is expected to propel due to their durability, flexibility, and resistance to chemicals, UV radiation, and punctures.

  • Growing Environmental Awareness:

There is a growing emphasis on environmental conservation and sustainable practices. This trend has led to an increased focus on using pond liners to prevent seepage and contamination of water bodies. Pond liners help in water conservation by minimizing water loss through seepage and preventing the infiltration of harmful substances into the groundwater.

  • Expansion of Aquaculture:

The aquaculture sector, including fish farming and shrimp cultivation, is experiencing significant growth globally. Pond liners play a crucial role in creating and maintaining the ideal aquatic environment for fish and other aquatic organisms. The expansion of the aquaculture sector is expected to drive the demand for pond liners.

Nikhil Kaitwade
Nikhil Kaitwade

Principal Consultant

Talk to Analyst

Find your sweet spots for generating winning opportunities in this market.

Country-wise Analysis

What is the United States Pond Liners Market Outlook?

Rising Focus On Water Conservation Set to Boost Demand

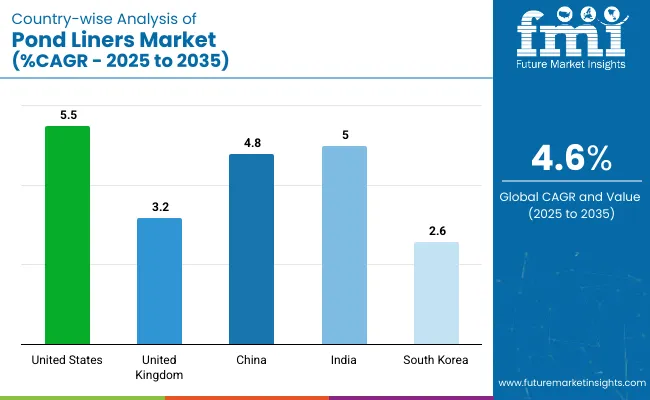
The pond liners industry in the United States is expected to hold revenues of US$ 695.9 million by 2033. It discovers a transformative prospect with the potential to generate absolute growth worth US$ 357.5 million through 2033.

The United States pond liners industry surpassed 9.0 % CAGR during the historical period 2018 to 2022. It is likely to exhibit a 7.5% CAGR from 2023 to 2033.

The United States is a leading player in the pond liners industry. The country has a significant market share due to the growing demand for pond liners across several sectors, such as agriculture, construction, and landscaping. Agricultural sector consumers in the United States are increasingly using pond liners for irrigation and water storage purposes, driving the market's growth.

The rising focus on water conservation in the country has further boosted the demand for pond liners. With droughts becoming more frequent in certain regions of the United States, there is a need for efficient water storage solutions, and pond liners provide a reliable option.

Technological advancements in the manufacturing of pond liners have also contributed to the growth of the market. Innovations in materials and production techniques have made pond liners more durable, flexible, and environmentally friendly. This has increased their appeal to consumers and has led to a high adoption rate.

Will China Be a Leading Player in the Pond Liners Market?

China's Rapid Economic Growth Expected to Propel Demand

In China, pond liners sales are set to register a sum of US$ 824.4 million by 2033. It is likely to unlock an absolute revenue potential of US$ 422.3 million through 2033.

China expanded at 8.9% CAGR during the historical period 2018 to 2022. It is likely to exhibit 7.4% CAGR during the forecast period 2023 to 2033.

One such emerging economy that has a significant impact on the pond liners industry is China. China has been the leading producer and consumer of pond liners in the world over recent years. This is mainly due to the country's rapid economic upheaval, which has increased demand for agriculture, aquaculture, and construction projects.

China has been focusing on improving its environmental sustainability by promoting green technology and implementing strict regulations on environmental protection. This has increased the demand for pond liners in the country. This is because they are an essential component of wastewater treatment plants and other environmental protection projects.

The Chinese government has been investing heavily in infrastructure development, including the construction of new ponds and reservoirs. This has increased the demand for high-quality pond liners to prevent water loss and ensure efficient water storage.

Category-wise Insights

Which is the Highly Preferred Material of Pond Liners?

Demand for Polyvinyl Chloride to Gain Momentum in the Market

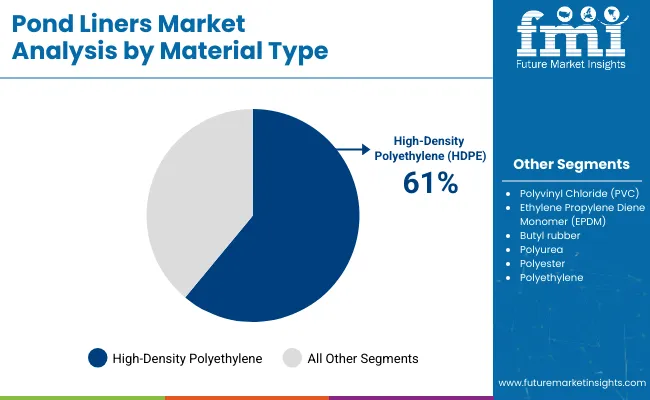
Based on material, polyvinyl chloride segment is in the forefront of the pond liners market during the forecast period. It is likely to accelerate at 7.2% CAGR during the forecast period 2023 to 2033.

Polyvinyl Chloride is a widely used material in the global pond liners industry due to its beneficial properties and availability. Polyvinyl chloride (PVC) is the most common type of polyvinyl used for pond liners.

PVC pond liners are highly durable, flexible, and resistant to UV radiation, chemicals, and punctures. These properties make PVC an ideal choice for consumers to construct and line ponds, water gardens, and other water containment structures.

PVC liners are resistant to a wide range of chemicals, including fertilizers, herbicides, and pesticides that may be used near or in the pond. This resistance helps maintain water quality and prevents potential harm to aquatic life.

Which is the Leading End-use Industry for Pond Liners?

Pond Line Use in Potable Water Will Remain High

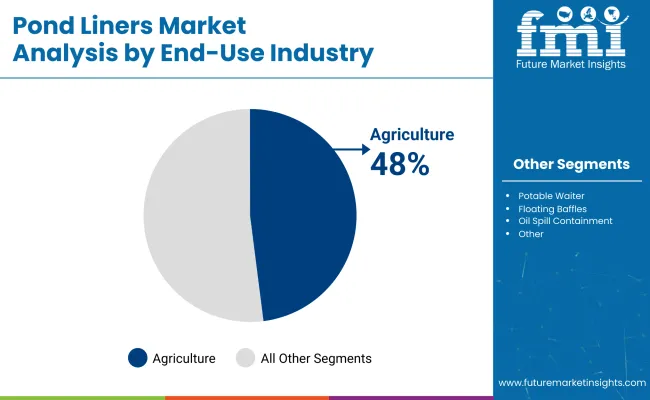
By end-use industry, potable water division is likely to monopolize the pond liners industry throughout the forecast period. Sales accelerated at 9.0% CAGR during the historical period 2018 and 2022. It is anticipated to soar at 7.4% CAGR through 2033.

In the potable water segment, strict regulations and standards govern water quality and safety. As a result, specialized materials and systems are typically employed to ensure the purity and integrity of the water supply.

While pond liners can be used in certain cases, such as for small-scale water storage systems or temporary water containment, they are not as prevalent in large potable water infrastructure projects.

Get the data you need at a Fraction of the cost

Personalize your report by choosing insights you need
and save 40%!

Competitive Landscape

Key manufacturers focus on developing innovative pond liner products with improved features and enhanced performance. This might include liners with better durability, flexibility, UV resistance, and chemical resistance, among other properties. Innovation helps manufacturers attract customers looking for advanced solutions and differentiate themselves from competitors.

Manufacturers often expand their product portfolios to cater to a wide range of customer needs. They might offer pond liners in different materials such as EPDM (Ethylene Propylene Diene Monomer), PVC (Polyvinyl Chloride), HDPE (High-Density Polyethylene), and others. By providing options suitable for various applications and budgets, manufacturers can capture a large market share.

To reach a broad customer base, manufacturers are expanding their geographical presence. This can involve establishing new production facilities, distribution networks, or entering new markets through partnerships, collaborations, or acquisitions. Geographic expansion helps manufacturers tap into new regions with growing demand for pond liners.

Recent developments:

  • In October 2022, Evaporation pond work has now been completed within the Sal de la Puna Program ("SDLP Project"), which is situated at Salta province, Argentina's Pastos Grandes basin.
  • In November 2022, Infracon Construction, Inc. is happy to announce that it has purchased all of the assets of Dawson Creek, BC-based Smith Connelly Services Inc.

Scope of the Report

Attribute Details
Estimated Market Size (2023) US$ 1.8 billion
Projected Market Size (2033) US$ 3.8 billion
Anticipated Growth Rate (2023 to 2033) 7.5% CAGR
Forecast Period 2023 to 2033
Historical Data Available for 2018 to 2022
Market Analysis US$ million/billion for Value and MT for Volume
Key Regions Covered North America, Latin America, Europe, Asia Pacific, and the Middle East & Africa
Key Countries Covered United States, Canada, Brazil, Mexico, Germany, United Kingdom, France, Italy, Spain, Nordic, Russia, Poland, China, India, Thailand, Indonesia, Australia and New Zealand, Japan, GCC countries, North Africa, South Africa, and others.
Key Segments Covered
  • Material
  • End-use Industry
  • Region
Key Companies Profiled
  • BTL Liners’
  • Emmbi Industries Limited
  • Reef Industries, Inc.
  • Stephens Industries Ltd.
  • Western Environmental Liner
Report Coverage Market Forecast, Company Share Analysis, Competition Intelligence, Drivers Restraints Opportunity Trends Analysis, Market Dynamics and Challenges, and Strategic Growth Initiatives

Pond Liners Market Segmentation

By End-use Industry:

  • Potable Water
  • Floating Baffles
  • Oil Spill Containment
  • Other

By Material:

  • Polyvinyl Chloride (PVC)
  • Ethylene Propylene Diene Monomer (EPDM)
  • Butyl Rubber
  • Polyurea
  • Polyester
  • Polyethylene

By Region:

  • North America
  • Latin America
  • Europe
  • East Asia
  • South Asia
  • Oceania
  • Middle East & Africa

Frequently Asked Questions

Which Countries are Advancing the Ceramic Transducers Market?

The United States, the United Kingdom and India advancing the global market.

Which End User Holds Lucrative Opportunities?

Potable water holds high revenue potential.

Which Countries Dominate the Pond Liners Market?

The United States and China are estimated to dominate the global market.

What is the Growth Forecast for the Pond Liners Market?

The market is forecast to register a CAGR of 7.5% through 2033.

How is the Historical Performance of the Pond Liners Market?

The market registered a CAGR of 9.1% from 2018 to 2022.

Table of Content

1. Executive Summary

    1.1. Global Market Outlook

    1.2. Demand-side Trends

    1.3. Supply-side Trends

    1.4. Technology Roadmap Analysis

    1.5. Analysis and Recommendations

2. Market Overview

    2.1. Market Coverage / Taxonomy

    2.2. Market Definition / Scope / Limitations

3. Market Background

    3.1. Market Dynamics

        3.1.1. Drivers

        3.1.2. Restraints

        3.1.3. Opportunity

        3.1.4. Trends

    3.2. Scenario Forecast

        3.2.1. Demand in Optimistic Scenario

        3.2.2. Demand in Likely Scenario

        3.2.3. Demand in Conservative Scenario

    3.3. Opportunity Map Analysis

    3.4. Product Life Cycle Analysis

    3.5. Supply Chain Analysis

        3.5.1. Supply Side Participants and their Roles

            3.5.1.1. Producers

            3.5.1.2. Mid-Level Participants (Traders/ Agents/ Brokers)

            3.5.1.3. Wholesalers and Distributors

        3.5.2. Value Added and Value Created at Node in the Supply Chain

        3.5.3. List of Raw Materiall Suppliers

        3.5.4. List of Existing and Potential Buyer’s

    3.6. Investment Feasibility Matrix

    3.7. Value Chain Analysis

        3.7.1. Profit Margin Analysis

        3.7.2. Wholesalers and Distributors

        3.7.3. Retailers

    3.8. PESTLE and Porter’s Analysis

    3.9. Regulatory Landscape

        3.9.1. By Key Regions

        3.9.2. By Key Countries

    3.10. Regional Parent Market Outlook

    3.11. Production and Consumption Statistics

    3.12. Import and Export Statistics

4. Global Market Analysis 2018 to 2022 and Forecast, 2023 to 2033

    4.1. Historical Market Size Value (US$ Million) & Volume (Square Meter) Analysis, 2018 to 2022

    4.2. Current and Future Market Size Value (US$ Million) & Volume (Square Meter) Projections, 2023 to 2033

        4.2.1. Y-o-Y Growth Trend Analysis

        4.2.2. Absolute $ Opportunity Analysis

5. Global Market Analysis 2018 to 2022 and Forecast 2023 to 2033, By End-Use Industry

    5.1. Introduction / Key Findings

    5.2. Historical Market Size Value (US$ Million) & Volume (Square Meter) Analysis By End-Use Industry, 2018 to 2022

    5.3. Current and Future Market Size Value (US$ Million) & Volume (Square Meter) Analysis and Forecast By End-Use Industry, 2023 to 2033

        5.3.1. Potable Water

        5.3.2. Floating Baffles

        5.3.3. Oil Spill Containment

        5.3.4. Other

    5.4. Y-o-Y Growth Trend Analysis By End-Use Industry, 2018 to 2022

    5.5. Absolute $ Opportunity Analysis By End-Use Industry, 2023 to 2033

6. Global Market Analysis 2018 to 2022 and Forecast 2023 to 2033, By Raw Material

    6.1. Introduction / Key Findings

    6.2. Historical Market Size Value (US$ Million) & Volume (Square Meter) Analysis By Raw Material, 2018 to 2022

    6.3. Current and Future Market Size Value (US$ Million) & Volume (Square Meter) Analysis and Forecast By Raw Material, 2023 to 2033

        6.3.1. Polyvinyl Chloride (PVC)

        6.3.2. Ethylene Propylene Diene Monomer (EPDM)

        6.3.3. Butyl Rubber

        6.3.4. Polyurea

        6.3.5. Polyester

        6.3.6. Polyethylene

    6.4. Y-o-Y Growth Trend Analysis By Raw Material, 2018 to 2022

    6.5. Absolute $ Opportunity Analysis By Raw Material, 2023 to 2033

7. Global Market Analysis 2018 to 2022 and Forecast 2023 to 2033, By Region

    7.1. Introduction

    7.2. Historical Market Size Value (US$ Million) & Volume (Square Meter) Analysis By Region, 2018 to 2022

    7.3. Current Market Size Value (US$ Million) & Volume (Square Meter) Analysis and Forecast By Region, 2023 to 2033

        7.3.1. North America

        7.3.2. Latin America

        7.3.3. Western Europe

        7.3.4. Eastern Europe

        7.3.5. South Asia and Pacific

        7.3.6. East Asia

        7.3.7. Middle East and Africa

    7.4. Market Attractiveness Analysis By Region

8. North America Market Analysis 2018 to 2022 and Forecast 2023 to 2033, By Country

    8.1. Historical Market Size Value (US$ Million) & Volume (Square Meter) Trend Analysis By Market Taxonomy, 2018 to 2022

    8.2. Market Size Value (US$ Million) & Volume (Square Meter) Forecast By Market Taxonomy, 2023 to 2033

        8.2.1. By Country

            8.2.1.1. United States

            8.2.1.2. Canada

        8.2.2. By End-Use Industry

        8.2.3. By Raw Material

    8.3. Market Attractiveness Analysis

        8.3.1. By Country

        8.3.2. By End-Use Industry

        8.3.3. By Raw Material

    8.4. Key Takeaways

9. Latin America Market Analysis 2018 to 2022 and Forecast 2023 to 2033, By Country

    9.1. Historical Market Size Value (US$ Million) & Volume (Square Meter) Trend Analysis By Market Taxonomy, 2018 to 2022

    9.2. Market Size Value (US$ Million) & Volume (Square Meter) Forecast By Market Taxonomy, 2023 to 2033

        9.2.1. By Country

            9.2.1.1. Brazil

            9.2.1.2. Mexico

            9.2.1.3. Rest of Latin America

        9.2.2. By End-Use Industry

        9.2.3. By Raw Material

    9.3. Market Attractiveness Analysis

        9.3.1. By Country

        9.3.2. By End-Use Industry

        9.3.3. By Raw Material

    9.4. Key Takeaways

10. Western Europe Market Analysis 2018 to 2022 and Forecast 2023 to 2033, By Country

    10.1. Historical Market Size Value (US$ Million) & Volume (Square Meter) Trend Analysis By Market Taxonomy, 2018 to 2022

    10.2. Market Size Value (US$ Million) & Volume (Square Meter) Forecast By Market Taxonomy, 2023 to 2033

        10.2.1. By Country

            10.2.1.1. Germany

            10.2.1.2. United Kingdom

            10.2.1.3. France

            10.2.1.4. Spain

            10.2.1.5. Italy

            10.2.1.6. Rest of Western Europe

        10.2.2. By End-Use Industry

        10.2.3. By Raw Material

    10.3. Market Attractiveness Analysis

        10.3.1. By Country

        10.3.2. By End-Use Industry

        10.3.3. By Raw Material

    10.4. Key Takeaways

11. Eastern Europe Market Analysis 2018 to 2022 and Forecast 2023 to 2033, By Country

    11.1. Historical Market Size Value (US$ Million) & Volume (Square Meter) Trend Analysis By Market Taxonomy, 2018 to 2022

    11.2. Market Size Value (US$ Million) & Volume (Square Meter) Forecast By Market Taxonomy, 2023 to 2033

        11.2.1. By Country

            11.2.1.1. Poland

            11.2.1.2. Russia

            11.2.1.3. Czech Republic

            11.2.1.4. Romania

            11.2.1.5. Rest of Eastern Europe

        11.2.2. By End-Use Industry

        11.2.3. By Raw Material

    11.3. Market Attractiveness Analysis

        11.3.1. By Country

        11.3.2. By End-Use Industry

        11.3.3. By Raw Material

    11.4. Key Takeaways

12. South Asia and Pacific Market Analysis 2018 to 2022 and Forecast 2023 to 2033, By Country

    12.1. Historical Market Size Value (US$ Million) & Volume (Square Meter) Trend Analysis By Market Taxonomy, 2018 to 2022

    12.2. Market Size Value (US$ Million) & Volume (Square Meter) Forecast By Market Taxonomy, 2023 to 2033

        12.2.1. By Country

            12.2.1.1. India

            12.2.1.2. Bangladesh

            12.2.1.3. Australia

            12.2.1.4. New Zealand

            12.2.1.5. Rest of South Asia and Pacific

        12.2.2. By End-Use Industry

        12.2.3. By Raw Material

    12.3. Market Attractiveness Analysis

        12.3.1. By Country

        12.3.2. By End-Use Industry

        12.3.3. By Raw Material

    12.4. Key Takeaways

13. East Asia Market Analysis 2018 to 2022 and Forecast 2023 to 2033, By Country

    13.1. Historical Market Size Value (US$ Million) & Volume (Square Meter) Trend Analysis By Market Taxonomy, 2018 to 2022

    13.2. Market Size Value (US$ Million) & Volume (Square Meter) Forecast By Market Taxonomy, 2023 to 2033

        13.2.1. By Country

            13.2.1.1. China

            13.2.1.2. Japan

            13.2.1.3. South Korea

        13.2.2. By End-Use Industry

        13.2.3. By Raw Material

    13.3. Market Attractiveness Analysis

        13.3.1. By Country

        13.3.2. By End-Use Industry

        13.3.3. By Raw Material

    13.4. Key Takeaways

14. Middle East and Africa Market Analysis 2018 to 2022 and Forecast 2023 to 2033, By Country

    14.1. Historical Market Size Value (US$ Million) & Volume (Square Meter) Trend Analysis By Market Taxonomy, 2018 to 2022

    14.2. Market Size Value (US$ Million) & Volume (Square Meter) Forecast By Market Taxonomy, 2023 to 2033

        14.2.1. By Country

            14.2.1.1. GCC Countries

            14.2.1.2. South Africa

            14.2.1.3. Israel

            14.2.1.4. Rest of MEA

        14.2.2. By End-Use Industry

        14.2.3. By Raw Material

    14.3. Market Attractiveness Analysis

        14.3.1. By Country

        14.3.2. By End-Use Industry

        14.3.3. By Raw Material

    14.4. Key Takeaways

15. Key Countries Market Analysis

    15.1. United States

        15.1.1. Pricing Analysis

        15.1.2. Market Share Analysis, 2022

            15.1.2.1. By End-Use Industry

            15.1.2.2. By Raw Material

    15.2. Canada

        15.2.1. Pricing Analysis

        15.2.2. Market Share Analysis, 2022

            15.2.2.1. By End-Use Industry

            15.2.2.2. By Raw Material

    15.3. Brazil

        15.3.1. Pricing Analysis

        15.3.2. Market Share Analysis, 2022

            15.3.2.1. By End-Use Industry

            15.3.2.2. By Raw Material

    15.4. Mexico

        15.4.1. Pricing Analysis

        15.4.2. Market Share Analysis, 2022

            15.4.2.1. By End-Use Industry

            15.4.2.2. By Raw Material

    15.5. Germany

        15.5.1. Pricing Analysis

        15.5.2. Market Share Analysis, 2022

            15.5.2.1. By End-Use Industry

            15.5.2.2. By Raw Material

    15.6. United Kingdom

        15.6.1. Pricing Analysis

        15.6.2. Market Share Analysis, 2022

            15.6.2.1. By End-Use Industry

            15.6.2.2. By Raw Material

    15.7. France

        15.7.1. Pricing Analysis

        15.7.2. Market Share Analysis, 2022

            15.7.2.1. By End-Use Industry

            15.7.2.2. By Raw Material

    15.8. Spain

        15.8.1. Pricing Analysis

        15.8.2. Market Share Analysis, 2022

            15.8.2.1. By End-Use Industry

            15.8.2.2. By Raw Material

    15.9. Italy

        15.9.1. Pricing Analysis

        15.9.2. Market Share Analysis, 2022

            15.9.2.1. By End-Use Industry

            15.9.2.2. By Raw Material

    15.10. Poland

        15.10.1. Pricing Analysis

        15.10.2. Market Share Analysis, 2022

            15.10.2.1. By End-Use Industry

            15.10.2.2. By Raw Material

    15.11. Russia

        15.11.1. Pricing Analysis

        15.11.2. Market Share Analysis, 2022

            15.11.2.1. By End-Use Industry

            15.11.2.2. By Raw Material

    15.12. Czech Republic

        15.12.1. Pricing Analysis

        15.12.2. Market Share Analysis, 2022

            15.12.2.1. By End-Use Industry

            15.12.2.2. By Raw Material

    15.13. Romania

        15.13.1. Pricing Analysis

        15.13.2. Market Share Analysis, 2022

            15.13.2.1. By End-Use Industry

            15.13.2.2. By Raw Material

    15.14. India

        15.14.1. Pricing Analysis

        15.14.2. Market Share Analysis, 2022

            15.14.2.1. By End-Use Industry

            15.14.2.2. By Raw Material

    15.15. Bangladesh

        15.15.1. Pricing Analysis

        15.15.2. Market Share Analysis, 2022

            15.15.2.1. By End-Use Industry

            15.15.2.2. By Raw Material

    15.16. Australia

        15.16.1. Pricing Analysis

        15.16.2. Market Share Analysis, 2022

            15.16.2.1. By End-Use Industry

            15.16.2.2. By Raw Material

    15.17. New Zealand

        15.17.1. Pricing Analysis

        15.17.2. Market Share Analysis, 2022

            15.17.2.1. By End-Use Industry

            15.17.2.2. By Raw Material

    15.18. China

        15.18.1. Pricing Analysis

        15.18.2. Market Share Analysis, 2022

            15.18.2.1. By End-Use Industry

            15.18.2.2. By Raw Material

    15.19. Japan

        15.19.1. Pricing Analysis

        15.19.2. Market Share Analysis, 2022

            15.19.2.1. By End-Use Industry

            15.19.2.2. By Raw Material

    15.20. South Korea

        15.20.1. Pricing Analysis

        15.20.2. Market Share Analysis, 2022

            15.20.2.1. By End-Use Industry

            15.20.2.2. By Raw Material

    15.21. GCC Countries

        15.21.1. Pricing Analysis

        15.21.2. Market Share Analysis, 2022

            15.21.2.1. By End-Use Industry

            15.21.2.2. By Raw Material

    15.22. South Africa

        15.22.1. Pricing Analysis

        15.22.2. Market Share Analysis, 2022

            15.22.2.1. By End-Use Industry

            15.22.2.2. By Raw Material

    15.23. Israel

        15.23.1. Pricing Analysis

        15.23.2. Market Share Analysis, 2022

            15.23.2.1. By End-Use Industry

            15.23.2.2. By Raw Material

16. Market Structure Analysis

    16.1. Competition Dashboard

    16.2. Competition Benchmarking

    16.3. Market Share Analysis of Top Players

        16.3.1. By Regional

        16.3.2. By End-Use Industry

        16.3.3. By Raw Material

17. Competition Analysis

    17.1. Competition Deep Dive

        17.1.1. BTL Liners

            17.1.1.1. Overview

            17.1.1.2. Product Portfolio

            17.1.1.3. Profitability by Market Segments

            17.1.1.4. Sales Footprint

            17.1.1.5. Strategy Overview

                17.1.1.5.1. Marketing Strategy

                17.1.1.5.2. Product Strategy

                17.1.1.5.3. Channel Strategy

        17.1.2. Emmbi Industries Limited

            17.1.2.1. Overview

            17.1.2.2. Product Portfolio

            17.1.2.3. Profitability by Market Segments

            17.1.2.4. Sales Footprint

            17.1.2.5. Strategy Overview

                17.1.2.5.1. Marketing Strategy

                17.1.2.5.2. Product Strategy

                17.1.2.5.3. Channel Strategy

        17.1.3. Reef Industries, Inc.

            17.1.3.1. Overview

            17.1.3.2. Product Portfolio

            17.1.3.3. Profitability by Market Segments

            17.1.3.4. Sales Footprint

            17.1.3.5. Strategy Overview

                17.1.3.5.1. Marketing Strategy

                17.1.3.5.2. Product Strategy

                17.1.3.5.3. Channel Strategy

        17.1.4. Stephens Industries Ltd.

            17.1.4.1. Overview

            17.1.4.2. Product Portfolio

            17.1.4.3. Profitability by Market Segments

            17.1.4.4. Sales Footprint

            17.1.4.5. Strategy Overview

                17.1.4.5.1. Marketing Strategy

                17.1.4.5.2. Product Strategy

                17.1.4.5.3. Channel Strategy

        17.1.5. Western Environmental Liner

            17.1.5.1. Overview

            17.1.5.2. Product Portfolio

            17.1.5.3. Profitability by Market Segments

            17.1.5.4. Sales Footprint

            17.1.5.5. Strategy Overview

                17.1.5.5.1. Marketing Strategy

                17.1.5.5.2. Product Strategy

                17.1.5.5.3. Channel Strategy

        17.1.6. AGRU

            17.1.6.1. Overview

            17.1.6.2. Product Portfolio

            17.1.6.3. Profitability by Market Segments

            17.1.6.4. Sales Footprint

            17.1.6.5. Strategy Overview

                17.1.6.5.1. Marketing Strategy

                17.1.6.5.2. Product Strategy

                17.1.6.5.3. Channel Strategy

        17.1.7. Carlisle Emmbi Industries Limited

            17.1.7.1. Overview

            17.1.7.2. Product Portfolio

            17.1.7.3. Profitability by Market Segments

            17.1.7.4. Sales Footprint

            17.1.7.5. Strategy Overview

                17.1.7.5.1. Marketing Strategy

                17.1.7.5.2. Product Strategy

                17.1.7.5.3. Channel Strategy

        17.1.8. GSE Environmental LLC

            17.1.8.1. Overview

            17.1.8.2. Product Portfolio

            17.1.8.3. Profitability by Market Segments

            17.1.8.4. Sales Footprint

            17.1.8.5. Strategy Overview

                17.1.8.5.1. Marketing Strategy

                17.1.8.5.2. Product Strategy

                17.1.8.5.3. Channel Strategy

        17.1.9. Huadun Snowflake

            17.1.9.1. Overview

            17.1.9.2. Product Portfolio

            17.1.9.3. Profitability by Market Segments

            17.1.9.4. Sales Footprint

            17.1.9.5. Strategy Overview

                17.1.9.5.1. Marketing Strategy

                17.1.9.5.2. Product Strategy

                17.1.9.5.3. Channel Strategy

        17.1.10. HongXiang New Geo-Materiall Co. Ltd

            17.1.10.1. Overview

            17.1.10.2. Product Portfolio

            17.1.10.3. Profitability by Market Segments

            17.1.10.4. Sales Footprint

            17.1.10.5. Strategy Overview

                17.1.10.5.1. Marketing Strategy

                17.1.10.5.2. Product Strategy

                17.1.10.5.3. Channel Strategy

18. Assumptions & Acronyms Used

19. Research Methodology

Recommendations

Industrial Automation

Land Survey Equipment Market

Published : February 2024

Industrial Automation

Water Desalination Equipment Market

Published : October 2023

Industrial Automation

Water Softening Systems Market

Published : June 2023

Explore Industrial Automation Insights

View Reports