The Hydraulic Cylinder Market is estimated to be valued at USD 17.5 billion in 2025 and is projected to reach USD 27.5 billion by 2035, registering a compound annual growth rate (CAGR) of 4.6% over the forecast period.
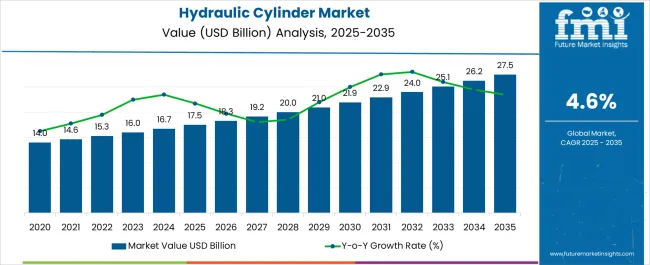
| Metric | Value |
|---|---|
| Hydraulic Cylinder Market Estimated Value in (2025 E) | USD 17.5 billion |
| Hydraulic Cylinder Market Forecast Value in (2035 F) | USD 27.5 billion |
| Forecast CAGR (2025 to 2035) | 4.6% |
The hydraulic cylinder market is expanding steadily, supported by the rising adoption of automated systems, demand for efficient heavy-duty equipment, and increased investment in infrastructure and industrial projects. Advancements in material engineering and sealing technologies are enabling higher durability and performance under extreme working conditions.
The growing focus on productivity improvements and reduced downtime has encouraged industries to integrate hydraulic cylinders into a wide range of machinery, from construction and mining to manufacturing and material handling. Regulatory emphasis on safety standards and the need for energy-efficient equipment are further boosting innovation and adoption.
The market outlook remains positive as industries continue to transition toward advanced hydraulic solutions that provide reliability, precision, and longevity across demanding applications.
The market is segmented by Bore Size, Product Type, Application, and Operating Principle and region. By Bore Size, the market is divided into <50 mm, 51-100 mm, 101-150 mm, 151-300 mm, and Above 300 mm. In terms of Product Type, the market is classified into Tie-rod Cylinders, Threaded Cylinders, Welded Cylinders, Bolted/Mill Type Cylinders, Telescopic Cylinders, and Other Cylinders. Based on Application, the market is segmented into Industrial Equipment and Mobile Equipment. By Operating Principle, the market is divided into Single Acting, Double Acting, and Multi-stage/Tandem. Regionally, the market is classified into North America, Latin America, Western Europe, Eastern Europe, Balkan & Baltic Countries, Russia & Belarus, Central Asia, East Asia, South Asia & Pacific, and the Middle East & Africa.
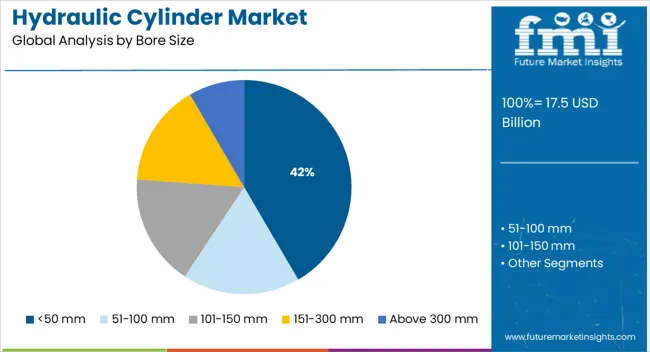
The less than 50 mm bore size segment is projected to account for 41.60% of the total market revenue by 2025, positioning it as a key growth contributor. This dominance is attributed to its suitability for compact machinery and light to medium-duty applications where space efficiency and precision control are critical.
The segment has gained traction in mobile equipment, agricultural machinery, and material handling systems due to its ability to deliver consistent performance with reduced weight and size.
Increasing adoption in industries that prioritize energy efficiency and compact design has reinforced the segment’s growth trajectory.
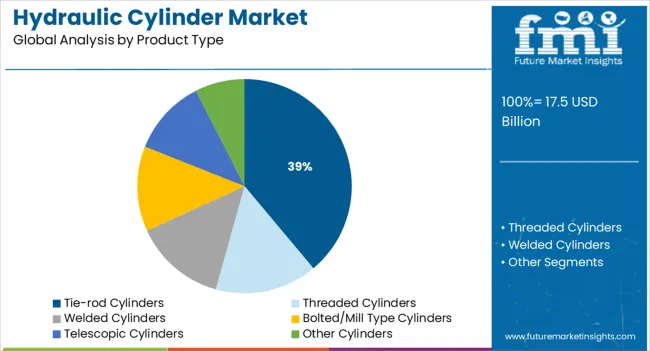
The tie-rod cylinders product type segment is expected to contribute 38.90% of total market revenue by 2025, establishing itself as the leading product type. Its popularity is driven by the ease of assembly, repair, and cost efficiency compared to other cylinder designs.
Tie-rod cylinders provide excellent durability and versatility, making them highly effective across a wide range of industrial applications. The ability to withstand high pressure and offer simple installation has supported adoption in manufacturing plants, agricultural equipment, and general machinery.
As industries seek affordable and reliable hydraulic solutions, this product type continues to dominate market preference.
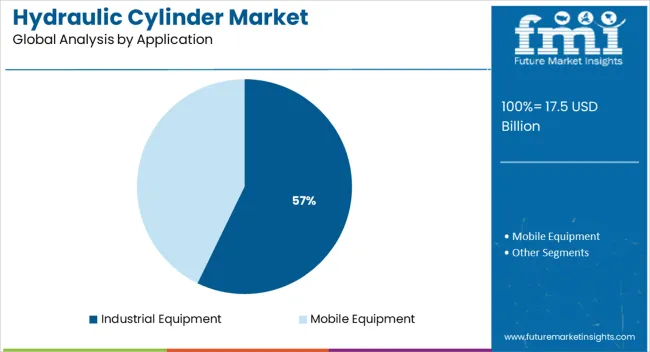
The industrial equipment application segment is forecasted to hold 57.20% of total market revenue by 2025, making it the most dominant application area. This growth is driven by the rising integration of hydraulic cylinders in automated production lines, heavy-duty material handling systems, and advanced manufacturing machinery.
The ability of hydraulic cylinders to deliver high force output, precision control, and operational safety has solidified their role in industrial environments. Growing demand for durable and energy-efficient components that support continuous operation is further strengthening their use in industrial equipment.
As modernization and automation accelerate across global industries, this segment is expected to remain the central growth driver for the hydraulic cylinder market.
The sales of hydraulic cylinders are expected to increase due to their ability to deliver power loads. This is despite their presence far away from the power generation source. The end users are particularly overwhelmed by their ability to conserve far more energy than their pneumatic and electro-mechanical counterparts.
Owing to the many benefits offered by hydraulic cylinders, FMI researchers have pointed out that the market may witness a massive increase in their adoption. While the historical CAGR was merely 2%, the anticipated CAGR is 4.6%. An increase of more than 2 times can be attributed to surging infrastructural activities, and the ability of the hydraulic cylinders to work flawlessly in harsh conditions.
During this timeframe, the manufacturers may be looking to fast-track the infrastructural activities which were in hibernation mode over the past couple of years. This might increase the adoption of hydraulic cylinders as these are very accurate and precise, and operate at a decent speed as well.
With the market expected to exhibit above-average growth, the manufacturers are willing to expand their presence. For example, Liebherr, which has been manufacturing hydraulic cylinders decided to open a new plant in Oberopfingen by 2025.
Fluctuating prices of raw materials in the international market used in the manufacturing of hydraulic or lifting cylinders are expected to be a key challenge. The market for hydraulic cylinders is driven by the sale of hydraulic systems that requires the assimilation of their parts such as hydraulic ram and hydraulic pistons.
Any disruption in the market related to the supply and availability of these associated parts can severely hamper the consumption of hydraulic cylinders.
Strict government regulations to avoid contamination of the environment by the fluid in hydraulic systems is a major deterring factor. Replacement of this fluid with some more environmentally sound solutions remains the main challenge.
| Region | North America |
|---|---|
| Country | United States |
| CAGR (2025 to 2035) | 3.5% |
| Region | Europe |
|---|---|
| Countriy | United Kingdom |
| CAGR (2025 to 2035) | 3.9% |
| Region | Asia Pacific |
|---|---|
| Country | China |
| CAGR (2025 to 2035) | 6.3% |
| Region | Asia Pacific |
|---|---|
| Country | Japan |
| CAGR (2025 to 2035) | 5.1% |
| Regions | Asia Pacific |
|---|---|
| Country | South Korea |
| CAGR (2025 to 2035) | 5.4% |
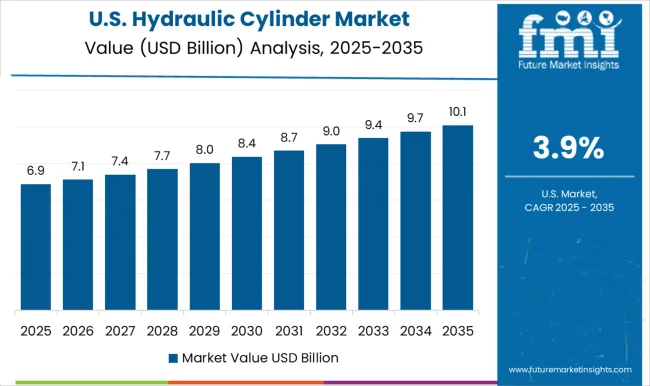
The United States is one of the leading waste management markets. Based on the data available, the annual treatment capacity is expected to surpass 270 million tonnes.
This is also impacted by the surging urban population. Hydraulic cylinders are used in the waste management industry to provide adequate torque to control the machines. The trash compactors make use of hydraulic cylinders to compress waste in the trash trucks. The street sweepers that are used for cleaning the roads make use of hydraulic cylinders to rotate the brushes.
| Attributes | Details |
|---|---|
| United States Market Expected Size (2035) | USD 4.5 billion |
| United States Market Absolute Dollar Growth | USD 1.3 billion |
| CAGR % 2020 to 2025 | 1.6% |
The United Kingdom is currently a huge market for massive food packaging. The food packaging market is expected to reach a valuation of USD 17.5 billion in 2025. The food packaging equipment makes use of hydraulic cylinders to achieve precision for the right dimensions and to keep the food fresh.
The conveyor systems derive power from the hydraulic cylinders for processing and positioning the food products. These cylinders are also used to transport raw materials.
| Attributes | Details |
|---|---|
| United Kingdom Market Expected Size (2035) | USD 364.1 million |
| United Kingdom Market Absolute Dollar Growth | USD 115.5 million |
| CAGR % 2020 to 2025 | 1.2% |
The construction market in China was valued at USD 4.8 trillion in 2024. This market is expected to grow at a rate of 5.2%. Hydraulic cylinders are used in the construction sector to power the bulldozers, and loaders to push the loads.
The excavators also make use of hydraulic cylinders to control the movements. Hydraulic cylinders are also used in brick molding machines and concrete busters to improve the precision of these machines. The forklifts make use of hydraulic cylinders as these power the forklifts to lift heavy loads.
| Attributes | Details |
|---|---|
| China Market Expected Size (2035) | USD 3.2 billion |
| China Market Absolute Dollar Growth | USD 1.5 billion |
| CAGR % 2020 to 2025 | 2.6% |
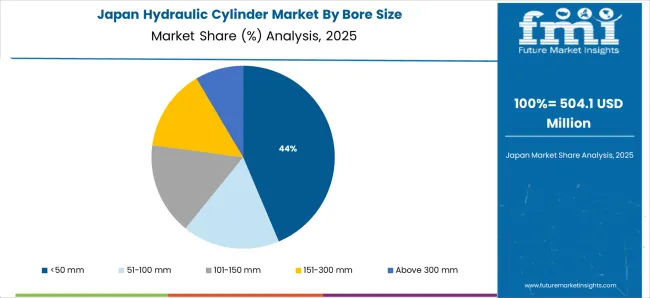
Japan is the leading aerospace market in Asia and has reported a turnover of more than USD 25 billion. Hydraulic cylinders are believed to be one of the most crucial components for landing gears, flight controls, cargo doors, etc. The hydraulic cylinders are only employed by the manufacturers after going through a series of safety tests, which further increases consumer confidence.
| Attributes | Details |
|---|---|
| Japan Market Expected Size (2035) | USD 1.6 billion |
| Japan Market Absolute Dollar Growth | USD 636.7 million |
| CAGR % 2020 to 2025 | 3.1% |
These are found to be highly effective for defense purposes as well. From steering rudders on submarines to assisting in missile erection from launch platforms, hydraulic cylinders can provide a wide range of operations.
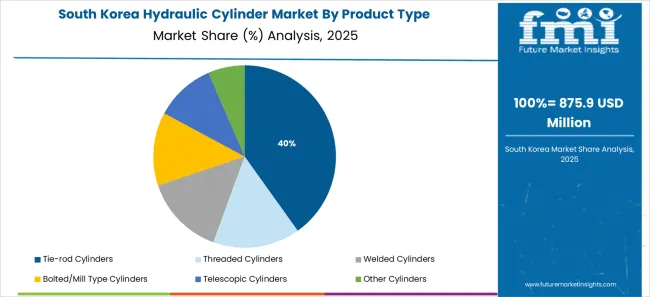
In 2024, South Korea ranks fourth in the production of passenger cars. The hydraulic cylinders are used for pressing, pulling, and lifting the vehicles at a high force. The hydraulic cylinders also provide the required force that moves parts of a vehicle in one plane. The telescopic hydraulic cylinders are highly preferred in the automobile sector because of being cost-effective and save lots of space. Thus, they are used in vehicle trailers.
| Attributes | Details |
|---|---|
| South Korea Market Expected Size (2035) | USD 1.1 billion |
| South Korea Market Absolute Dollar Growth | USD 453.1 million |
| CAGR % 2020 to 2025 | 2.7% |
| Segment | Product Type |
|---|---|
| Attributes | Welded Hydraulic Cylinder |
| CAGR (2020 to 2025) | 2.3% |
| CAGR (2025 to 2035) | 4.6% |
| Segment | Application |
|---|---|
| Attributes | Mobile Equipment |
| CAGR (2020 to 2025) | 2.1% |
| CAGR (2025 to 2035) | 4.5% |
The welded hydraulic cylinder segment is expected to hold the dominant share. The welded hydraulic cylinders have superior seal packaging, which increases their life expectancy. These also beautify the equipment on which they are used. These work exceptionally well in the applications in which space factor is taken into consideration. Most importantly, the welded hydraulic cylinders are customizable, which provides a lot of options to the manufacturers as well. Being highly durable, these can be used in harsh conditions as well.
The mobile equipment segment is expected to hold the leading share. Mobile equipment is used in some of the most critical sectors, and these are implemented on large scale. In the agricultural sector, these are used in fields, cultivation, and harvesting equipment for actuating various attachments.
The mobile equipment is also used in automotive vertical parking systems for delivering parking solutions in densely populated areas. In the construction sector, mobile equipment is used for concrete mixes, which represents massive prospects for the segment.
The start-ups operating in the market are looking to offer their products to different sectors. Instead of specializing in a single product type, they are looking to diversify their offerings. To increase the versatility of the operations, the new players are making use of the multi-stage operating principle.
Suloshi Hydraulics and Manufacturing Solutions Private Limited:
The start-up has been engaged in manufacturing tie rod pneumatic cylinders, telescopic hydraulic cylinders, hydraulic clamp cylinders, etc. They have the reputation of delivering products as per the set standards. They are a team of highly qualified and skilled professionals who handle business-related tasks with professionalism. The ability to maintain timelines has assisted the company in being a top-notch firm in the sector.
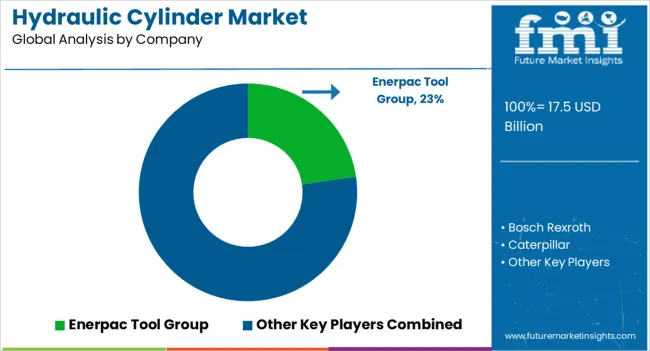
Dominant Hydraulic Cylinder Manufacturers:
| Company | Description |
|---|---|
| Caterpillar | Caterpillar's strategy reflects the company’s legacy and continuing commitment to meeting the needs of the customers and the communities in which they live and work. Caterpillar employees share a focused view of business through the Operating and Execution Model, through which Caterpillar is making strategic choices. The customers have been using Caterpillar’s products to build the basic infrastructure which enables higher standards of living. Together with its partners, Caterpillar helps its customers to build a better and more sustainable world. |
| Eaton | Eaton is dedicated to improving people’s lives and the environment with power management technologies that are reliable, safe, and sustainable. The energy-efficient products and services help customers manage electrical, hydraulic, and mechanical power more reliably. The broad product mix can be found in industries all over the world, protecting people and assets, while improving productivity and efficiency. The Eaton Business System is the embodiment of its integrated operating company philosophy, it is how Eaton works. |
| Bosch Rexroth | Bosch Rexroth has been giving its customers and users a competitive advantage through safe, efficient, intelligent, and high-performance solutions. The company drives the digital transformation of the factory of the future, exceeds the limits with connected hydraulics, and sets the stage for transforming mobile machines. The products and solutions offered by the company contribute to the more sustainable development of machines, manufacturing, and daily life. |
Other significant players profiled: Enerpac Tool Group and KYB Corporation.
The global hydraulic cylinder market is estimated to be valued at USD 17.5 billion in 2025.
The market size for the hydraulic cylinder market is projected to reach USD 27.5 billion by 2035.
The hydraulic cylinder market is expected to grow at a 4.6% CAGR between 2025 and 2035.
The key product types in hydraulic cylinder market are <50 mm, 51-100 mm, 101-150 mm, 151-300 mm and above 300 mm.
In terms of product type, tie-rod cylinders segment to command 38.9% share in the hydraulic cylinder market in 2025.


Our Research Products

The "Full Research Suite" delivers actionable market intel, deep dives on markets or technologies, so clients act faster, cut risk, and unlock growth.

The Leaderboard benchmarks and ranks top vendors, classifying them as Established Leaders, Leading Challengers, or Disruptors & Challengers.

Locates where complements amplify value and substitutes erode it, forecasting net impact by horizon

We deliver granular, decision-grade intel: market sizing, 5-year forecasts, pricing, adoption, usage, revenue, and operational KPIs—plus competitor tracking, regulation, and value chains—across 60 countries broadly.

Spot the shifts before they hit your P&L. We track inflection points, adoption curves, pricing moves, and ecosystem plays to show where demand is heading, why it is changing, and what to do next across high-growth markets and disruptive tech

Real-time reads of user behavior. We track shifting priorities, perceptions of today’s and next-gen services, and provider experience, then pace how fast tech moves from trial to adoption, blending buyer, consumer, and channel inputs with social signals (#WhySwitch, #UX).

Partner with our analyst team to build a custom report designed around your business priorities. From analysing market trends to assessing competitors or crafting bespoke datasets, we tailor insights to your needs.
Supplier Intelligence
Discovery & Profiling
Capacity & Footprint
Performance & Risk
Compliance & Governance
Commercial Readiness
Who Supplies Whom
Scorecards & Shortlists
Playbooks & Docs
Category Intelligence
Definition & Scope
Demand & Use Cases
Cost Drivers
Market Structure
Supply Chain Map
Trade & Policy
Operating Norms
Deliverables
Buyer Intelligence
Account Basics
Spend & Scope
Procurement Model
Vendor Requirements
Terms & Policies
Entry Strategy
Pain Points & Triggers
Outputs
Pricing Analysis
Benchmarks
Trends
Should-Cost
Indexation
Landed Cost
Commercial Terms
Deliverables
Brand Analysis
Positioning & Value Prop
Share & Presence
Customer Evidence
Go-to-Market
Digital & Reputation
Compliance & Trust
KPIs & Gaps
Outputs
Full Research Suite comprises of:
Market outlook & trends analysis
Interviews & case studies
Strategic recommendations
Vendor profiles & capabilities analysis
5-year forecasts
8 regions and 60+ country-level data splits
Market segment data splits
12 months of continuous data updates
DELIVERED AS:
PDF EXCEL ONLINE
Hydraulic Anchor Drilling Vehicle for Mining Market Size and Share Forecast Outlook 2025 to 2035
Hydraulic Gear Pumps Market Size and Share Forecast Outlook 2025 to 2035
Hydraulic Recloser Market Size and Share Forecast Outlook 2025 to 2035
Hydraulic Lifting Mobile Light Tower Market Size and Share Forecast Outlook 2025 to 2035
Hydraulic Fracturing Market Size and Share Forecast Outlook 2025 to 2035
Hydraulic Power Unit Market Size and Share Forecast Outlook 2025 to 2035
Hydraulic Lifting Light Tower Market Size and Share Forecast Outlook 2025 to 2035
Hydraulic Squeeze Chute Market Size and Share Forecast Outlook 2025 to 2035
Hydraulic Filters Market Size and Share Forecast Outlook 2025 to 2035
Hydraulic Dosing Pump Market Size and Share Forecast Outlook 2025 to 2035
Hydraulic Fluids Market Analysis - Size, Share, and Forecast 2025 to 2035
Hydraulic Fluids & Process Oil Market Size 2025 to 2035
Hydraulic Pumps Market Growth & Outlook 2025 to 2035
Hydraulic Intensifiers Market Growth – Trends & Forecast 2025 to 2035
Hydraulic Spreader Market
Hydraulic Cab Tilt System Market
Hydraulic Demolition Machine And Breaker Market
TBR Hydraulic Curing Press Market Size and Share Forecast Outlook 2025 to 2035
Electrohydraulic Pump Market Insights by Type, End Use, Application, and Region through 2035
Railway Hydraulic Damper Market

Thank you!
You will receive an email from our Business Development Manager. Please be sure to check your SPAM/JUNK folder too.
Chat With
MaRIA