The global hydraulic gear pumps market is valued at USD 2.1 billion in 2025 and is slated to reach USD 3.0 billion by 2035, recording an absolute increase of USD 0.9 billion over the forecast period. This translates into a total growth of 44.0%, with the market forecast to expand at a compound annual growth rate (CAGR) of 3.7% between 2025 and 2035.
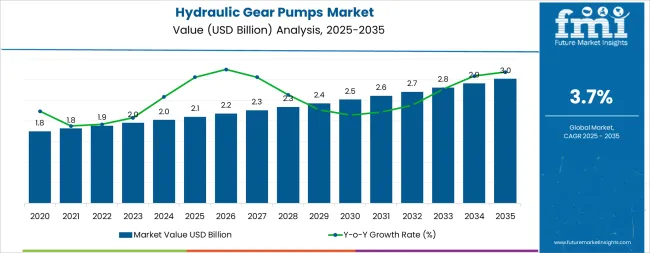
The overall market size is expected to grow by nearly 1.4X during the same period, supported by increasing global industrial automation, growing construction and mining activities, and rising adoption of efficient fluid power systems across diverse industrial applications.
Between 2025 and 2030, the hydraulic gear pumps market is projected to expand from USD 2.1 billion to USD 2.4 billion, resulting in a value increase of USD 0.3 billion, which represents 33.3% of the total forecast growth for the decade. This phase of development will be shaped by increasing industrial automation, rising construction equipment demand, and growing adoption of energy-efficient hydraulic systems in automotive and material handling applications. Equipment manufacturers are expanding their production capabilities to address the growing demand for reliable fluid power solutions and enhanced operational efficiency.
From 2030 to 2035, the market is forecast to grow from USD 2.4 billion to USD 3.0 billion, adding another USD 0.6 billion, which constitutes 66.7% of the overall ten-year expansion. This period is expected to be characterized by the expansion of advanced external gear pump systems, the integration of high-pressure applications, and the development of automated material handling technologies for industrial facilities.
The growing adoption of industrial automation programs and smart manufacturing initiatives will drive demand for hydraulic gear pumps with enhanced operational efficiency and reduced maintenance requirements.
Between 2020 and 2025, the hydraulic gear pumps market experienced steady recovery growth, driven by increasing industrial production demand recovery and growing recognition of hydraulic gear pumps as essential equipment for construction, automotive, and manufacturing operations.
The market developed as industries recognized the potential for efficient pumps to enhance operational reliability while reducing operational costs and improving equipment performance. Technological advancement in pump design and pressure handling capabilities began emphasizing the critical importance of maintaining operational efficiency and energy consumption optimization in industrial fluid power systems.
| Metric | Value |
|---|---|
| Estimated Value (2025E) | USD 2.1 billion |
| Forecast Value (2035F) | USD 3 billion |
| Forecast CAGR (2025 to 2035) | 3.7% |
Market expansion is being supported by the increasing global industrial automation and the corresponding need for efficient fluid power equipment that can maintain operational reliability and equipment performance while supporting diverse industrial applications across various manufacturing environments. Modern industries are increasingly focused on implementing pump solutions that can reduce operational downtime, minimize maintenance costs, and provide consistent performance in machinery operations. Hydraulic gear pumps' proven ability to deliver enhanced operational efficiency, reliable fluid power capabilities, and versatile industrial applications make them essential equipment for contemporary manufacturing operations and industrial automation solutions.
The growing emphasis on construction equipment modernization and operational efficiency is driving demand for hydraulic gear pumps that can support high-pressure applications, reduce system complexity, and enable efficient power transmission across varying industrial configurations. Industrial operators' preference for equipment that combines reliability with operational efficiency and cost-effectiveness is creating opportunities for innovative pump implementations. The rising influence of energy efficiency regulations and industrial automation technologies is also contributing to increased adoption of hydraulic gear pumps that can provide advanced operational control without compromising performance or energy consumption optimization.
The hydraulic gear pumps market is poised for robust growth and transformation. As industries across both developed and emerging markets seek fluid power equipment that is efficient, reliable, automated, and energy-compliant, hydraulic gear systems are gaining prominence not just as operational equipment but as strategic infrastructure for operational efficiency, equipment reliability, productivity enhancement, and energy optimization.
Rising industrial automation and construction activities in North America, East Asia, and Western Europe amplify demand, while manufacturers are picking up on innovations in external gear pump technologies and high-pressure applications.
Pathways like external gear pump adoption, pressure range optimization, and advanced material handling promise strong margin uplift, especially in developed markets. Geographic expansion and application diversification will capture volume, particularly where industrial automation is growing or manufacturing infrastructure requires modernization. Energy efficiency pressures around consumption reduction, operational optimization, and performance enhancement give structural support.
The market is segmented by type, operating pressure, end use, and region. By type, the market is divided into external gear pump and internal gear pump. By operating pressure, it covers upto 15 bar, 15-50 bar, 50-150 bar, 150-250 bar, 250-300 bar, and more than 300 bar.
By end use, it is segmented into construction equipment, mining equipment, automotive, material handling equipment, off-highway vehicles, processing industries (chemicals, petrochemicals, oil & gas refineries, and others), and other industrial machinery and equipment. Regionally, the market is divided into North America, Latin America, Western Europe, Eastern Europe, East Asia, South Asia Pacific, and Middle East & Africa.
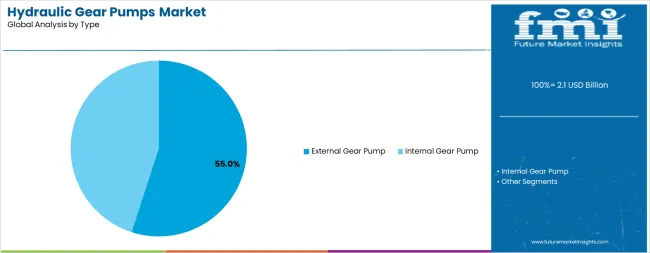
The external gear pump segment is projected to account for 55.0% of the hydraulic gear pumps market in 2025, reaffirming its position as the leading type category. Industrial operators increasingly utilize external gear pumps for their proven reliability, high efficiency capabilities, and cost-effectiveness in fluid power applications across construction equipment, automotive systems, and industrial machinery applications. External gear pump technology's established operational procedures and consistent performance output directly address the industrial requirements for reliable fluid power transmission and operational efficiency in diverse manufacturing environments.
This type segment forms the foundation of current industrial fluid power operations, as it represents the technology with the greatest operational reliability and established maintenance infrastructure across multiple applications and industrial scenarios. Operator investments in enhanced external gear systems and operational optimization continue to strengthen adoption among industries and equipment manufacturers. With operators prioritizing operational reliability and equipment availability, external gear pumps align with both operational efficiency objectives and cost management requirements, making them the central component of comprehensive hydraulic power strategies.
The 15-50 bar operating pressure segment is projected to experience the fastest growth with a CAGR of 6.1% from 2025 to 2035, driven by increasing demand for medium-pressure applications in construction, mining, and material handling industries. This pressure range provides optimal operating conditions for many machinery systems, offering a perfect balance of performance and efficiency while supporting diverse industrial requirements and equipment configurations.
The segment is supported by continuous innovation in construction equipment development and the growing availability of specialized pressure configurations that enable efficient power transmission with enhanced operational capabilities. Additionally, industrial operators are investing in medium-pressure optimization to support large-scale operations and equipment performance delivery. As industrial automation becomes more prevalent and operational efficiency requirements increase, the 15-50 bar segment will continue to drive market growth while supporting advanced equipment utilization and manufacturing operational strategies.
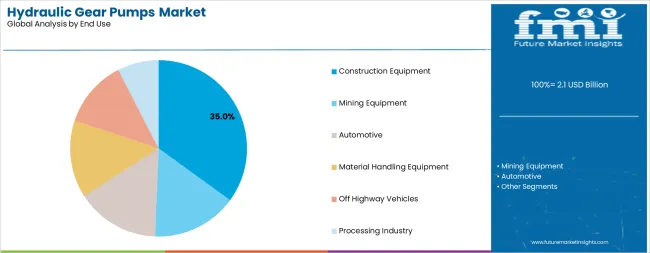
Construction equipment is projected to represent the fastest-growing application with a CAGR of 6.2% from 2025 to 2035, underscoring its critical role as the primary driver of hydraulic gear pump demand for construction machinery and industrial equipment operations. Construction operators prefer hydraulic gear pumps for their efficiency, reliability, and ability to handle high-pressure applications while supporting equipment operations and machinery performance requirements. Positioned as essential equipment for modern construction operations, gear pumps offer both operational advantages and performance benefits.
The segment is supported by continuous innovation in construction equipment expansion and the growing availability of specialized pump configurations that enable efficient power transmission with enhanced operational capabilities. Additionally, construction companies are investing in equipment optimization to support large-scale operations and project delivery. As construction demand becomes more prevalent and operational efficiency requirements increase, construction equipment will continue to dominate the application market while supporting advanced equipment utilization and operational strategies.
The hydraulic gear pumps market is advancing steadily due to increasing industrial automation and growing adoption of operational efficiency infrastructure that provides enhanced fluid power transmission and equipment reliability across diverse industrial applications.
However, the market faces challenges, including high equipment capital costs, specialized maintenance infrastructure requirements, and varying operational requirements across different industrial environments. Innovation in external gear pump technologies and pressure optimization continues to influence equipment development and market expansion patterns.
The growing expansion of industrial automation and construction equipment development is enabling pump manufacturers to develop hydraulic gear systems that provide superior operational efficiency, enhanced fluid power capabilities, and reliable performance in high-demand industrial environments.
Advanced gear pump systems provide improved operational capacity while allowing more effective power transmission and consistent performance delivery across various applications and industrial requirements. Manufacturers are increasingly recognizing the competitive advantages of modern pump capabilities for operational efficiency and industrial productivity positioning.
Modern hydraulic gear pump manufacturers are incorporating external gear technologies and high-pressure handling systems to enhance operational efficiency, reduce maintenance requirements, and ensure consistent performance delivery to industrial operators.
These technologies improve equipment reliability while enabling new applications, including automated material handling and advanced construction equipment solutions. Advanced technology integration also allows manufacturers to support premium equipment positioning and operational optimization beyond traditional fluid power equipment supply.
| Country | CAGR (2025-2035) |
|---|---|
| USA | 3.8% |
| China | 3.4% |
| Germany | 3.2% |
| Japan | 3.0% |
| United Kingdom | 2.8% |
| France | 2.6% |
| India | 4.1% |
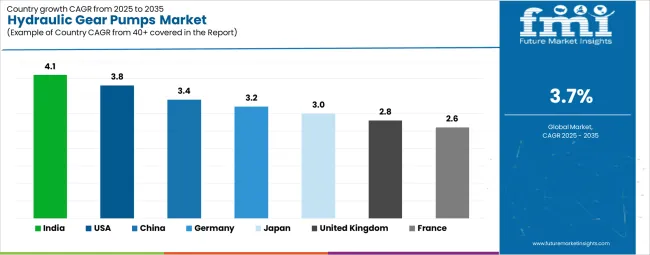
The hydraulic gear pumps market is experiencing steady growth globally, with India leading at a 4.1% CAGR through 2035, driven by extensive manufacturing expansion programs, advanced infrastructure investments, and significant adoption of cost-effective pump solutions. USA follows at 3.8%, supported by massive industrial automation projects, comprehensive manufacturing development, and growing adoption of external gear pump technologies.
China shows growth at 3.4%, emphasizing manufacturing modernization and advanced production capabilities. Germany records 3.2%, focusing on precision engineering and operational optimization. Japan demonstrates 3.0% growth, supported by industrial advancement and technology integration.
United Kingdom shows 2.8% growth, driven by manufacturing modernization and operational efficiency requirements. France demonstrates 2.6% growth, supported by industrial expansion but characterized by competitive market pressures.
The report covers an in-depth analysis of top-performing countries are highlighted below.
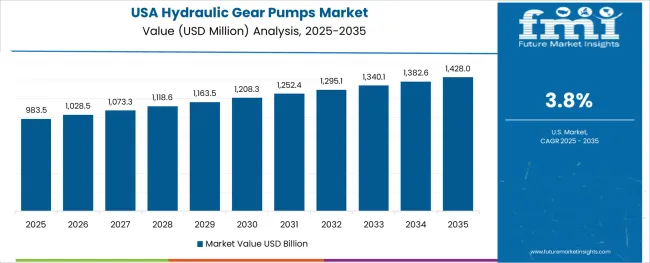
Revenue from hydraulic gear pumps in the USA is projected to exhibit strong growth with a CAGR of 3.8% through 2035, driven by extensive industrial automation programs and rapidly growing adoption of external gear pump solutions supported by energy efficiency regulations and operational optimization initiatives. The country's comprehensive manufacturing infrastructure and increasing investment in advanced fluid power technologies are creating substantial demand for efficient hydraulic gear pump solutions. Major industries and equipment manufacturers are establishing comprehensive pump systems to serve both domestic operations and export requirements.
Revenue from hydraulic gear pumps in China is expanding at a CAGR of 3.4%, supported by the country's massive manufacturing development projects, extensive industrial infrastructure expansion, and increasing adoption of automated fluid power systems. The country's comprehensive industrial strategy and growing manufacturing demand are driving advanced pump capabilities. State industries and manufacturing companies are establishing extensive equipment operations to address the growing demand for efficient power transmission and operational reliability.
Revenue from hydraulic gear pumps in Germany is expanding at a CAGR of 3.2%, supported by the country's strong precision engineering capabilities, advanced manufacturing infrastructure, and comprehensive industrial modernization programs among manufacturing operators. The nation's mature industrial sector and increasing emphasis on operational efficiency are driving advanced pump capabilities throughout the equipment market. Leading manufacturers and industrial facilities are investing extensively in external gear pump development and technology integration to serve both domestic manufacturing needs and export markets.
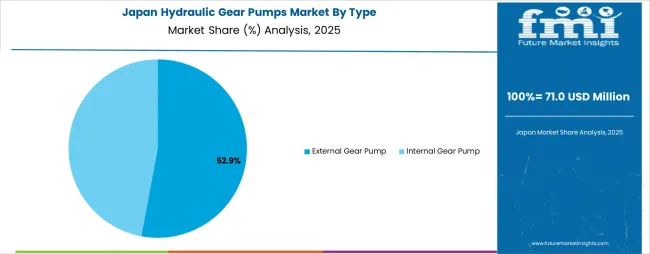
Revenue from hydraulic gear pumps in Japan is growing at a CAGR of 3.0%, driven by expanding industrial precision programs, increasing operational efficiency requirements, and growing investment in manufacturing enhancement. The country's established industrial infrastructure and emphasis on operational optimization are supporting demand for advanced pump technologies across major manufacturing markets. Industrial operators and equipment manufacturers are establishing comprehensive pump programs to serve both domestic manufacturing needs and technology export requirements.
Revenue from hydraulic gear pumps in the United Kingdom is expanding at a CAGR of 2.8%, supported by the country's focus on manufacturing infrastructure upgrades, comprehensive operational efficiency programs, and strategic investment in industrial improvement. The UK's established manufacturing industry and emphasis on operational enhancement are driving demand for specialized pump technologies focusing on operational reliability and equipment quality. Manufacturing operators are investing in comprehensive equipment modernization to serve both domestic manufacturing requirements and industrial operations.
Revenue from hydraulic gear pumps in France is expanding at a CAGR of 2.6%, supported by the country's industrial equipment upgrade programs, growing manufacturing demand, and increasing investment in operational modernization. France's established industrial sector and emphasis on manufacturing improvement are driving demand for reliable pump technologies across major industrial markets. Manufacturing operators and industrial facilities are establishing equipment partnerships to serve both domestic manufacturing development and operational efficiency markets.
Revenue from hydraulic gear pumps in India is expanding at a CAGR of 4.1%, supported by the country's growing manufacturing sector, increasing industrial automation demand, and strategic investment in infrastructure development. India's expanding industrial market and emphasis on operational efficiency are driving demand for cost-effective pump technologies across major manufacturing markets. Industries and manufacturing operators are establishing equipment partnerships to serve both domestic manufacturing expansion and operational efficiency requirements.
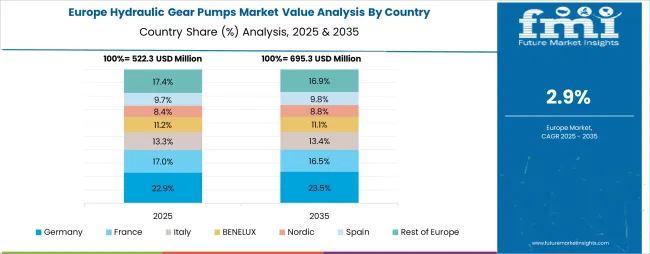
The hydraulic gear pumps market in Europe is projected to grow from USD 0.6 billion in 2025 to USD 0.8 billion by 2035, registering a CAGR of 2.9% over the forecast period. Germany is expected to maintain its leadership position with a 32.5% market share in 2025, increasing to 33.1% by 2035, supported by its advanced manufacturing infrastructure, comprehensive energy efficiency regulations, and major industrial facilities serving European and international markets.
United Kingdom follows with a 18.3% share in 2025, projected to ease to 17.9% by 2035, driven by manufacturing modernization programs, operational optimization initiatives, and established industrial capabilities, but facing challenges from competitive pressures and investment constraints. France holds a 16.8% share in 2025, expected to decline to 16.4% by 2035, supported by industrial equipment upgrades and energy efficiency requirements but facing challenges from operational optimization and investment uncertainties.
Italy commands a 13.2% share in 2025, projected to reach 13.4% by 2035, while Spain accounts for 10.1% in 2025, expected to reach 10.3% by 2035. The Rest of Europe region, including Nordic countries, Eastern European markets, Netherlands, Belgium, and other European countries, is anticipated to gain momentum, expanding its collective share from 9.1% to 8.9% by 2035, attributed to increasing manufacturing development across Nordic countries and growing industrial modernization across various European markets implementing automation upgrade programs.
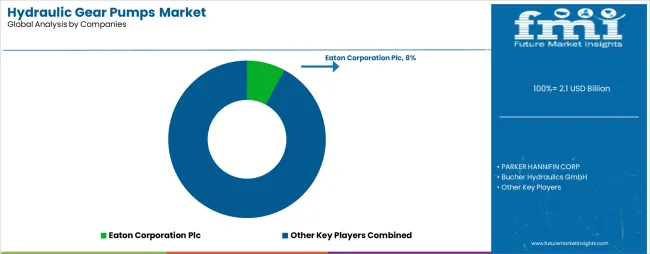
The hydraulic gear pumps market is characterized by competition among established industrial equipment manufacturers, specialized pump technology providers, and integrated fluid power system companies. Companies are investing in advanced external gear pump research, pressure optimization development, operational efficiency enhancement, and comprehensive equipment portfolios to deliver efficient, reliable, and energy-compliant hydraulic gear pump solutions. Innovation in external gear technologies, high-pressure handling capabilities, and advanced material integration is central to strengthening market position and competitive advantage.
Eaton Corporation leads the market with a strong presence, offering comprehensive hydraulic gear pump solutions and fluid power systems with a focus on reliability and operational efficiency for industrial applications. Parker-Hannifin Corporation provides extensive pump portfolios with an emphasis on innovation, customization, and aftermarket support services.
Bucher Hydraulics delivers specialized gear pump systems with a focus on cost-effective manufacturing and regional adaptability. KYB Corporation specializes in advanced hydraulic technologies with emphasis on automotive and industrial applications.
Bosch Rexroth AG focuses on comprehensive fluid power solutions with global service networks and automation integration. CASAPPA S.p.A. offers specialized gear pump equipment with emphasis on high-pressure applications and manufacturing excellence. Dynamatic Technologies provides diverse pump solutions with regional market leadership and cost-effective production capabilities.
| Items | Values |
|---|---|
| Quantitative Units (2025) | USD 2.1 billion |
| Type | External Gear Pump, Internal Gear Pump |
| Operating Pressure | Upto 15 bar, 15-50 bar, 50-150 bar, 150-250 bar, 250-300 bar, More Than 300 bar |
| End Use | Construction Equipment, Mining Equipment, Automotive, Material Handling Equipment, Off Highway Vehicles, Processing Industry (Chemicals, Petrochemicals, Oil & Gas Refineries, Others), Other Industrial Machinery and Equipment |
| Regions Covered | North America, Latin America, Western Europe, Eastern Europe, East Asia, South Asia Pacific, Middle East & Africa |
| Countries Covered | United States, Canada, Germany, United Kingdom, France, China, Japan, Brazil, India and 15+ countries |
| Key Companies Profiled | Eaton Corporation, PARKER HANNIFIN, Bucher Hydraulics, KYB Corporation, Bosch Rexroth AG, CASAPPA S.p.A., and Dynamatic Technologies |
| Additional Attributes | Pump sales by type and pressure category, regional demand trends, competitive landscape, technological advancements in external gear systems, pressure optimization development, operational efficiency innovation, and performance enhancement optimization |
The global hydraulic gear pumps market is estimated to be valued at USD 2.1 billion in 2025.
The market size for the hydraulic gear pumps market is projected to reach USD 3.0 billion by 2035.
The hydraulic gear pumps market is expected to grow at a 3.7% CAGR between 2025 and 2035.
The key product types in hydraulic gear pumps market are external gear pump and internal gear pump.
In terms of end use, construction equipment segment to command 35.0% share in the hydraulic gear pumps market in 2025.


Our Research Products

The "Full Research Suite" delivers actionable market intel, deep dives on markets or technologies, so clients act faster, cut risk, and unlock growth.

The Leaderboard benchmarks and ranks top vendors, classifying them as Established Leaders, Leading Challengers, or Disruptors & Challengers.

Locates where complements amplify value and substitutes erode it, forecasting net impact by horizon

We deliver granular, decision-grade intel: market sizing, 5-year forecasts, pricing, adoption, usage, revenue, and operational KPIs—plus competitor tracking, regulation, and value chains—across 60 countries broadly.

Spot the shifts before they hit your P&L. We track inflection points, adoption curves, pricing moves, and ecosystem plays to show where demand is heading, why it is changing, and what to do next across high-growth markets and disruptive tech

Real-time reads of user behavior. We track shifting priorities, perceptions of today’s and next-gen services, and provider experience, then pace how fast tech moves from trial to adoption, blending buyer, consumer, and channel inputs with social signals (#WhySwitch, #UX).

Partner with our analyst team to build a custom report designed around your business priorities. From analysing market trends to assessing competitors or crafting bespoke datasets, we tailor insights to your needs.
Supplier Intelligence
Discovery & Profiling
Capacity & Footprint
Performance & Risk
Compliance & Governance
Commercial Readiness
Who Supplies Whom
Scorecards & Shortlists
Playbooks & Docs
Category Intelligence
Definition & Scope
Demand & Use Cases
Cost Drivers
Market Structure
Supply Chain Map
Trade & Policy
Operating Norms
Deliverables
Buyer Intelligence
Account Basics
Spend & Scope
Procurement Model
Vendor Requirements
Terms & Policies
Entry Strategy
Pain Points & Triggers
Outputs
Pricing Analysis
Benchmarks
Trends
Should-Cost
Indexation
Landed Cost
Commercial Terms
Deliverables
Brand Analysis
Positioning & Value Prop
Share & Presence
Customer Evidence
Go-to-Market
Digital & Reputation
Compliance & Trust
KPIs & Gaps
Outputs
Full Research Suite comprises of:
Market outlook & trends analysis
Interviews & case studies
Strategic recommendations
Vendor profiles & capabilities analysis
5-year forecasts
8 regions and 60+ country-level data splits
Market segment data splits
12 months of continuous data updates
DELIVERED AS:
PDF EXCEL ONLINE
Hydraulic Pumps Market Growth & Outlook 2025 to 2035
Automotive Electro-hydraulic Power Steering Pumps Market Size and Share Forecast Outlook 2025 to 2035
Hydraulic Anchor Drilling Vehicle for Mining Market Size and Share Forecast Outlook 2025 to 2035
Hydraulic Recloser Market Size and Share Forecast Outlook 2025 to 2035
Hydraulic Lifting Mobile Light Tower Market Size and Share Forecast Outlook 2025 to 2035
Hydraulic Fracturing Market Size and Share Forecast Outlook 2025 to 2035
Hydraulic Power Unit Market Size and Share Forecast Outlook 2025 to 2035
Hydraulic Lifting Light Tower Market Size and Share Forecast Outlook 2025 to 2035
Pumps Market Size and Share Forecast Outlook 2025 to 2035
Gearbox and Gear Motors Market Size and Share Forecast Outlook 2025 to 2035
Gear Motor Market Size and Share Forecast Outlook 2025 to 2035
Hydraulic Squeeze Chute Market Size and Share Forecast Outlook 2025 to 2035
Hydraulic Cylinder Market Size and Share Forecast Outlook 2025 to 2035
Hydraulic Filters Market Size and Share Forecast Outlook 2025 to 2035
Hydraulic Dosing Pump Market Size and Share Forecast Outlook 2025 to 2035
Hydraulic Fluids Market Analysis - Size, Share, and Forecast 2025 to 2035
Pumps and Trigger Spray Market Trends - Growth & Forecast 2025 to 2035
Hydraulic Fluids & Process Oil Market Size 2025 to 2035
Gears, Drives and Speed Changers Market Growth – Trends & Forecast 2025 to 2035
Hydraulic Intensifiers Market Growth – Trends & Forecast 2025 to 2035

Thank you!
You will receive an email from our Business Development Manager. Please be sure to check your SPAM/JUNK folder too.
Chat With
MaRIA