The Hydraulic Squeeze Chute Market is estimated to be valued at USD 14969.1 million in 2025 and is projected to reach USD 25569.3 million by 2035, registering a compound annual growth rate (CAGR) of 5.5% over the forecast period.
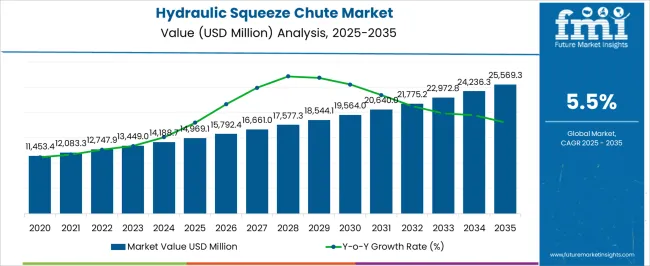
| Metric | Value |
|---|---|
| Hydraulic Squeeze Chute Market Estimated Value in (2025 E) | USD 14969.1 million |
| Hydraulic Squeeze Chute Market Forecast Value in (2035 F) | USD 25569.3 million |
| Forecast CAGR (2025 to 2035) | 5.5% |
The hydraulic squeeze chute market is experiencing steady growth as livestock management practices increasingly prioritize animal safety, handler efficiency, and operational productivity. Growing herd sizes and heightened focus on reducing livestock stress during handling are creating demand for advanced chute systems that ensure smoother operations and minimize injury risks.
Hydraulic systems are gaining preference over manual counterparts due to their ability to reduce labor intensity, improve precision, and enhance operator safety. Investment in durable materials, automation features, and ergonomic designs has further expanded market adoption.
Additionally, regulatory and industry emphasis on animal welfare and efficient herd management is reinforcing the integration of hydraulic squeeze chutes. With continuous improvements in portability, durability, and remote operation, the market outlook remains strong, supported by the livestock sector’s ongoing modernization and the push for safer and more productive handling solutions.
The market is segmented by Application and Type and region. By Application, the market is divided into Livestock Industry, Private Farm, and Others. In terms of Type, the market is classified into Portable and Stationary. Regionally, the market is classified into North America, Latin America, Western Europe, Eastern Europe, Balkan & Baltic Countries, Russia & Belarus, Central Asia, East Asia, South Asia & Pacific, and the Middle East & Africa.
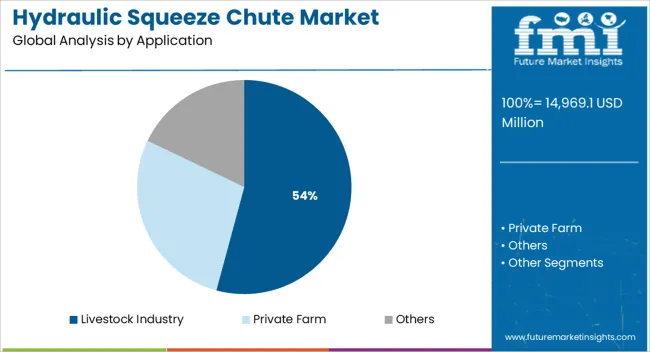
The livestock industry application segment is projected to hold 54.20% of the overall market revenue by 2025, making it the leading category. This dominance is being driven by the rising need for efficient cattle handling systems that reduce stress and improve health management outcomes.
Increasing herd sizes, particularly in commercial farming, are creating a higher demand for hydraulic chutes that streamline processes such as vaccination, tagging, and health monitoring. The ability to improve both operator safety and livestock welfare has reinforced their adoption within large scale livestock operations.
As efficiency, compliance with welfare standards, and productivity remain top priorities, the livestock industry continues to lead in the application of hydraulic squeeze chutes.
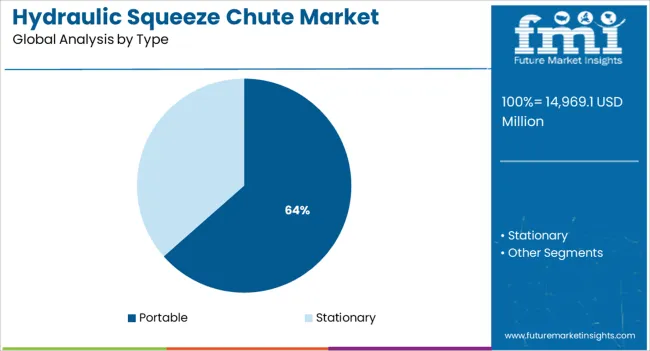
The portable type segment is expected to account for 63.50% of total revenue by 2025 within the type category, establishing it as the dominant segment. Its leadership is attributed to the convenience of mobility, which enables cattle handlers to operate across dispersed farm locations and remote pastures.
Portability allows for flexible use without requiring permanent installations, aligning with the needs of both small and large farms. Ease of transportation, adaptability to different herd sizes, and reduced infrastructure costs have made portable hydraulic chutes the preferred choice.
Furthermore, advancements in lightweight durable materials and compact hydraulic systems are enhancing portability without compromising on strength and efficiency. This segment’s ability to balance flexibility, cost effectiveness, and functionality ensures its continued dominance in the hydraulic squeeze chute market.
Companies in this market are investing in research and development to develop new and advanced hydraulic squeeze chutes that are more efficient, user-friendly, and capable of providing improved welfare to animals. This is likely to increase the market size and improve the efficiency of the agricultural industry. Governments are introducing regulations and guidelines to promote the use of animal-friendly technologies such as hydraulic squeeze chutes, in response to increasing demand for humane animal handling in the agricultural sector.
Changes in consumer preferences are also one of the factors that impact sales of hydraulic squeeze chutes. For example, if consumers become more interested in animal welfare, it could drive demand for hydraulic squeeze chutes that prioritize the welfare of animals. Increasing adoption of hydraulic squeeze chutes in developing countries like the Asia Pacific and Africa where the population is increasing and the need for food production is high may drive the global market.
Revolutions in import and export regulations can also positively affect the sales of hydraulic squeeze chutes. For example, if a government imposes tariffs on imported equipment, it could make it more difficult for foreign manufacturers to compete in the market and could create opportunities for domestic manufacturers.
The livestock industry is estimated to hold the largest market share as it usually handles high volumes of animals and requires heavy-duty equipment. However, the private farm segment is likely to witness significant growth due to the increasing number of smaller farms adopting portable hydraulic squeeze chutes.
Portable hydraulic squeeze chutes are more popular among the private farm segment as these operations have a limited number of animals and need equipment that can be easily moved around the farm. These types of chutes can be moved with ease and are also not as expensive as stationary chutes which are suitable for smaller farms or hobby farmers, who are looking for a cost-effective solution.
In conclusion, the popularity of a specific segment in the hydraulic squeeze chute industry depends on factors such as the size and scale of the operation, automation preference, and cost of the equipment. The livestock industry segment holds a 45% share of the market. However, the private farm segment is anticipated to register a significant CAGR of 21% during the forecast period.
| Attributes | Details |
|---|---|
| US Market Size (2035) | USD 3,631.2 million |
| Share in the Global Market | 28.5% |
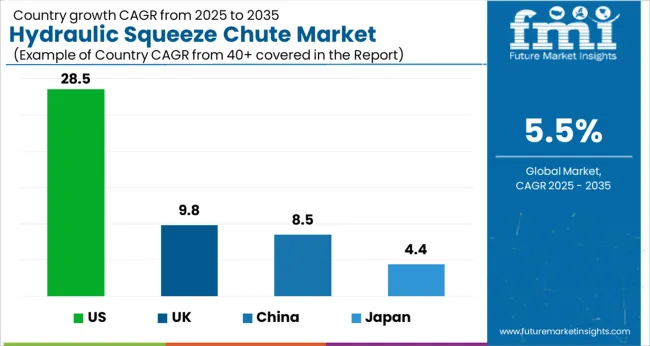
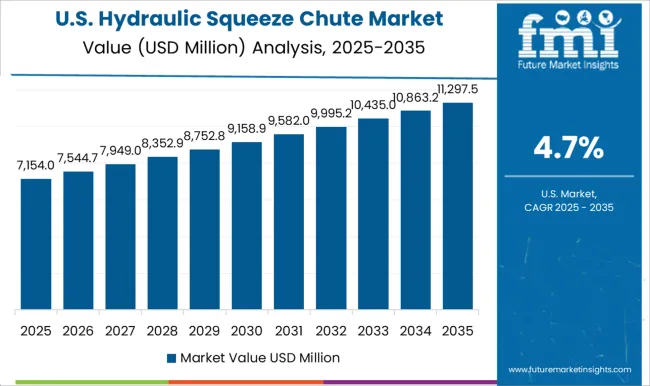
North America holds a significant share of the hydraulic squeeze chute market, particularly in the USA The USA holds a revenue share of 28.5% in the global hydraulic squeeze chute industry. The value of the hydraulic squeeze chute market in the USA is estimated to reach USD 3,631.2 million by 2035.
The United States is home to a large livestock population, which creates a significant demand for hydraulic squeeze chutes. This increased demand is driving the growth of the market in the region.
The use of automation and technology is increasing in the livestock handling industry, which has led to the adoption of more advanced and efficient hydraulic squeeze chutes in the region. Governments in the United States are increasingly introducing regulations and guidelines to promote the use of animal-friendly technologies, such as hydraulic squeeze chutes, in the agricultural sector.
Many farmers and ranchers in the United States are prioritizing animal welfare and investing in hydraulic squeeze chutes that offer improved handling and care for animals. The USA economy is one of the largest in the world, and the country is home to many large farms and ranches, which increases the demand for hydraulic squeeze chutes.
| Attributes | Details |
|---|---|
| UK Market Size (2035) | USD 2215.3 million |
| Share in the Global Market by 2035 | 9.8% |
The United Kingdom hydraulic squeeze chutes industry is to witness a CAGR of 5.9% and an anticipated value of USD 2215.3 million throughout the projection period.
The introduction of government initiatives for the implementation of hydraulic squeeze chutes in the agricultural industry is expected to drive market growth as it encourages farmers to invest in animal-friendly equipment. The United Kingdom is expected to be a key contributor to this growth, as the government is promoting the use of these chutes to improve animal welfare and reduce labor costs.
The sales of hydraulic squeeze chutes are expected to increase as farmers look to upgrade their equipment to comply with new regulations and guidelines. In addition, the development of advanced and efficient hydraulic squeeze chutes by manufacturers is also expected to boost the market growth in this region. Overall, the adoption of hydraulic squeeze chutes in the United Kingdom is expected to be driven by a combination of government initiatives, which is expected to drive growth in the market.
| Attributes | Details |
|---|---|
| China Market Size (2035) | USD 1662.0 million |
| Share in the Global Market by 2035 | 8.5% |
China currently has a significant share of 8.5% in the hydraulic squeeze chute industry. The market is projected to witness a steady CAGR of 4.4% during the forecast period. The demand for hydraulic squeeze chutes in China is estimated to reach a peak of USD 1662.0 million throughout the forecast period.
China is emerging as a significant market for hydraulic squeeze chutes, owing to a large pool of livestock animals, increasing incidences of animal disorders, and rising awareness of animal welfare. With the growing population of animals, the demand for equipment for efficient and effective animal handling is increasing. The hydraulic squeeze chutes provide a means for immobilizing animals quickly and easily, reducing the time and labor needed to handle them. Additionally, these chutes are designed to minimize the stress and injury to animals during handling, which is especially important given the increasing incidences of animal disorders in China.
The increasing focus on animal welfare in China has led to the introduction of regulations and guidelines that promote the use of animal-friendly technologies in the agricultural industry. This has also increased awareness among farmers and ranchers of the importance of investing in equipment that provides better care for animals. The Chinese government's push for improved animal welfare, through initiatives and regulations, has also led to an increase in the use of technologies such as hydraulic squeeze chutes which are in line with these regulations.
| Attributes | Details |
|---|---|
| Japan Market Size (2035) | USD 558.4 million |
| Share in the Global Market by 2035 | 4.4% |
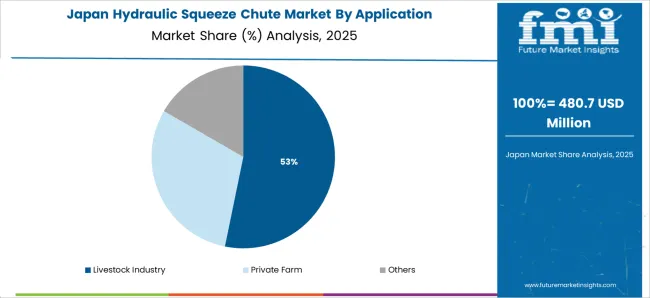
Japan is one of the lucrative hydraulic squeeze chute industries, with a revenue growth rate of 5% and an expected value of USD 558.4 million during the projected period.
The hydraulic squeeze chute market is projected to experience significant growth in Japan in the coming years. One of the key factors driving this growth is the availability of technologically advanced tools at cheaper prices than in advanced countries such as the United States.
Japan has a strong and sophisticated agricultural sector and farmers are becoming more and more interested in investing in advanced equipment to improve their efficiency and productivity. The hydraulic squeeze chutes provide a more efficient, humane, and cost-effective way of handling livestock, which is becoming more important to farmers and ranchers in Japan as they look to improve their operations.
Japan's domestic market for agricultural equipment is relatively protected from overseas competition, which allows Japanese manufacturers to focus on developing advanced technologies and equipment for the domestic market and offer more competitive prices. This gives Japanese farmers access to advanced equipment at more affordable prices than those in other countries which allows them to adopt the latest technologies, such as hydraulic squeeze chutes more easily.
In addition, the Japanese government also encourages farmers to adopt advanced equipment through subsidies, grants, and other types of financial support, which further fuels the growth of the market.
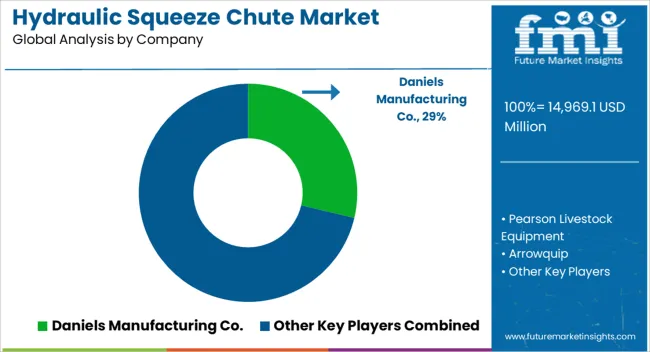
Several companies are considered to be leading the way in transforming the hydraulic squeeze chute market. Some of the top companies in this industry include:
O'Donnell Manufacturing: O'Donnell Manufacturing offers a variety of hydraulic squeeze chutes. But one of their unique products is the "Pro Series Squeeze Chute" which is built for professional use and features an automatic head gate with a self-catching mechanism, an automatic side exit gate, and a remote-control panel for easy operation.
Toolnew: Toolnew is a leading provider of hydraulic squeeze chutes and other livestock handling equipment. They offer a wide range of chutes with unique designs like the "Cattle & Sheep Hydraulic Squeeze Chute" which is built with durable and lightweight aluminum construction and a hydraulic head gate with a locking mechanism for improved animal safety.
Clipex: Clipex is known for its unique, high-quality hydraulic squeeze chutes. One of their unique products is the "Clipex Hydraulic Squeeze Crush" which is built for heavy-duty use and features durable construction, an automatic head gate, a self-catching mechanism, and remote control for easy operation.
Arrowquip: Arrowquip is a leading provider of hydraulic squeeze chutes and other livestock handling equipment. They offer a wide range of chutes designed for various types of livestock, including cattle, sheep, and goats, and are also equipped with features like automatic head gates, self-catching head gates, and automatic sliding gates.
These are just a few examples of companies that are considered to be leaders in the hydraulic squeeze chute market. Other notable manufacturers of hydraulic squeeze chutes include Jamesway, Tru-Test, and Valley Farms. The companies in this market continuously introduce new and advanced products that cater to the need of farmers, ranchers, and feedlots operators.
It is important to note that the market is constantly evolving and new companies and technologies may emerge. To stay competitive, companies should keep an eye on industry trends and developments, and invest in research and development to create new and innovative products.
Recent Developments in the Market:
The global hydraulic squeeze chute market is estimated to be valued at USD 14,969.1 million in 2025.
The market size for the hydraulic squeeze chute market is projected to reach USD 25,569.3 million by 2035.
The hydraulic squeeze chute market is expected to grow at a 5.5% CAGR between 2025 and 2035.
The key product types in hydraulic squeeze chute market are livestock industry, private farm and others.
In terms of type, portable segment to command 63.5% share in the hydraulic squeeze chute market in 2025.


Our Research Products

The "Full Research Suite" delivers actionable market intel, deep dives on markets or technologies, so clients act faster, cut risk, and unlock growth.

The Leaderboard benchmarks and ranks top vendors, classifying them as Established Leaders, Leading Challengers, or Disruptors & Challengers.

Locates where complements amplify value and substitutes erode it, forecasting net impact by horizon

We deliver granular, decision-grade intel: market sizing, 5-year forecasts, pricing, adoption, usage, revenue, and operational KPIs—plus competitor tracking, regulation, and value chains—across 60 countries broadly.

Spot the shifts before they hit your P&L. We track inflection points, adoption curves, pricing moves, and ecosystem plays to show where demand is heading, why it is changing, and what to do next across high-growth markets and disruptive tech

Real-time reads of user behavior. We track shifting priorities, perceptions of today’s and next-gen services, and provider experience, then pace how fast tech moves from trial to adoption, blending buyer, consumer, and channel inputs with social signals (#WhySwitch, #UX).

Partner with our analyst team to build a custom report designed around your business priorities. From analysing market trends to assessing competitors or crafting bespoke datasets, we tailor insights to your needs.
Supplier Intelligence
Discovery & Profiling
Capacity & Footprint
Performance & Risk
Compliance & Governance
Commercial Readiness
Who Supplies Whom
Scorecards & Shortlists
Playbooks & Docs
Category Intelligence
Definition & Scope
Demand & Use Cases
Cost Drivers
Market Structure
Supply Chain Map
Trade & Policy
Operating Norms
Deliverables
Buyer Intelligence
Account Basics
Spend & Scope
Procurement Model
Vendor Requirements
Terms & Policies
Entry Strategy
Pain Points & Triggers
Outputs
Pricing Analysis
Benchmarks
Trends
Should-Cost
Indexation
Landed Cost
Commercial Terms
Deliverables
Brand Analysis
Positioning & Value Prop
Share & Presence
Customer Evidence
Go-to-Market
Digital & Reputation
Compliance & Trust
KPIs & Gaps
Outputs
Full Research Suite comprises of:
Market outlook & trends analysis
Interviews & case studies
Strategic recommendations
Vendor profiles & capabilities analysis
5-year forecasts
8 regions and 60+ country-level data splits
Market segment data splits
12 months of continuous data updates
DELIVERED AS:
PDF EXCEL ONLINE
Hydraulic Anchor Drilling Vehicle for Mining Market Size and Share Forecast Outlook 2025 to 2035
Hydraulic Gear Pumps Market Size and Share Forecast Outlook 2025 to 2035
Hydraulic Recloser Market Size and Share Forecast Outlook 2025 to 2035
Hydraulic Lifting Mobile Light Tower Market Size and Share Forecast Outlook 2025 to 2035
Hydraulic Fracturing Market Size and Share Forecast Outlook 2025 to 2035
Hydraulic Power Unit Market Size and Share Forecast Outlook 2025 to 2035
Hydraulic Lifting Light Tower Market Size and Share Forecast Outlook 2025 to 2035
Hydraulic Cylinder Market Size and Share Forecast Outlook 2025 to 2035
Hydraulic Filters Market Size and Share Forecast Outlook 2025 to 2035
Hydraulic Dosing Pump Market Size and Share Forecast Outlook 2025 to 2035
Hydraulic Fluids Market Analysis - Size, Share, and Forecast 2025 to 2035
Squeeze Pouch Market Growth – Demand & Forecast 2025 to 2035
Hydraulic Fluids & Process Oil Market Size 2025 to 2035
Hydraulic Pumps Market Growth & Outlook 2025 to 2035
Hydraulic Intensifiers Market Growth – Trends & Forecast 2025 to 2035
Squeeze Bottle Market Trends – Growth & Forecast 2024-2034
Squeeze Tube Market
Hydraulic Spreader Market
Hydraulic Cab Tilt System Market
Hydraulic Demolition Machine And Breaker Market

Thank you!
You will receive an email from our Business Development Manager. Please be sure to check your SPAM/JUNK folder too.
Chat With
MaRIA