Reports

- Global Locations -

Headquarters

Future Market Insights, Inc.

Christiana Corporate, 200
Continental Drive, Suite 401,
Newark, Delaware - 19713,
United States

T: +1-845-579-5705

Americas

Future Market Insights, Inc.

616 Corporate Way, Suite 2-9018,
Valley Cottage, NY 10989, United States

T: +1-347-918-3531

MEA

Future Market Insights

1602-6 Jumeirah Bay X2 Tower, Plot No: JLT-PH2-X2A,
Jumeirah Lakes Towers, Dubai,
United Arab Emirates

Europe

Future Market Insights

3rd Floor, 207 Regent Street,
W1B 3HH London
United Kingdom

T: + 44 (0) 20 8123 9659
D: +44 (0) 20 3287 4268

Asia Pacific

Future Market Insights

IndiaLand Global Tech Park, Unit UG-1, Behind Grand HighStreet, Phase 1, Hinjawadi, MH, Pune – 411057, India

Global PP Closure Market Outlook (2023 to 2033)

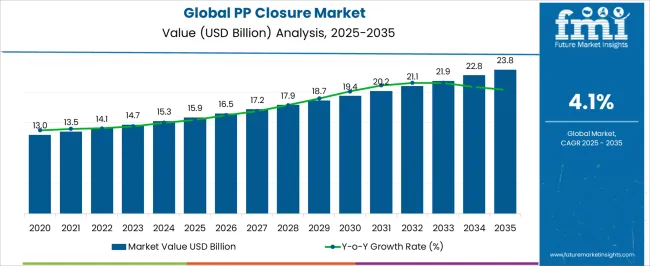
The global PP closure market size is projected to reach US$ 14.6 billion in 2023. Between 2023 and 2033, global PP closure sales are likely to rise at 4.30% CAGR, taking the overall market valuation to US$ 22.3 billion by 2033.

PP (polypropylene) closures are safe and secure packaging solutions commonly used for packaging and sealing different types of bottles, jars, tubes, and other containers and jars. These packaging solutions protect sensitive products from spoilage and extend their shelf life.

PP closures are gaining wider popularity due to their outstanding sealability, low cost, moisture resistance, durability, and recyclable nature. These closures have become a reliable means of sealing and protecting food products, pharmaceuticals, beverages, and cosmetics.

Rising usage of PP closures for packaging a wide range of products across sectors such as food & beverages, healthcare, chemicals, and personal care & cosmetics will boost the market.

The increasing demand for convenience & ease of use in packaging and the focus on sustainability and eco-friendliness in packaging material will influence growth in the market.

The global market will also be driven by technological advancements and innovations in closure designs and materials.

Widening applications of PP closures in the pharmaceutical sector is likely to create a plethora of opportunities for manufacturers. PP closures are used to seal containers for medicines and other healthcare products. They can effectively protect pharmaceutical formulations and extend their lifespan.

Factors Propelling Global PP Closure Demand:

  • Rising adoption of PP closures across the thriving food & beverage sector due to their excellent barrier properties and ability to preserve the freshness of food products will likely boost the market.
  • Growing need for convenient packaging is expected to fuel demand for PP closure as they are well-suited for this purpose on account of their ease of use and versatility.
  • Rise of online food delivery services coupled with increasing demand for packaging solutions that are leak-proof and prevent spills during transit will bolster PP closure sales.
  • The increasing demand for sustainable packaging solutions that are eco-friendly, lightweight, and recyclable will create lucrative opportunities for PP closure manufacturers.
  • Surging demand for healthcare and cosmetics products is anticipated to uplift PP closure demand during the next ten years.
  • Increasing consumption of bottled water and carbonated and non-carbonated drinks will elevate global PP closure demand.

Key Factors Restraining Market Expansion:

  • Due to the risk of chemical leaching, there have been concerns about the safety of using certain types of PP material and this could lead to reduced demand for PP closures.
  • PP closures are made from polypropylene, which is derived from petroleum, which is being phased out of several sectors.
  • Fluctuations in crude oil prices can have a significant impact on the cost of producing PP closures since they are sourced from crude oil.
  • As consumers become more environmentally conscious, they are increasingly using reusable containers, such as glass jars and metal containers.

Emerging Opportunities that are Impacting the Market:

  • Technological advancements enabling manufacturers to produce high-quality closures with improved performance will spur growth in the market.
  • Rapid growth of e-commerce to create high demand for secure and durable packaging solutions including PP closures, which are tamper-evident and provide a tight seal.
  • Escalating demand for packaged goods, particularly in Asia-Pacific, due to rapid economic growth and urbanization will positively impact PP closure sales.
  • The increasing focus on sustainable development and environmental protection will present investment opportunities for companies that provide eco-friendly PP closures.

Key Trends Propelling PP Closure Market Forward:

  • Biodegradable PP closures are gaining popularity as a sustainable alternative to traditional PP closures since they can break down naturally, reducing the environmental impact of packaging waste.
  • Growing demand for innovative closure designs that offer unique shapes, colors, and textures will foster market development.
  • Manufacturers are exploring ways to offer customized PP closures with unique designs and logos by using digital printing technology which will boost the market.
  • Radio-frequency identification (RFID) technology is being integrated into PP closures to enable tracking and monitoring of products throughout the supply chain.
  • With increasing scrutiny on product safety and quality, manufacturers are placing a greater emphasis on ensuring that PP closures meet stringent safety and quality standards.
Attributes Key Insights
Estimated Global PP Closure Market Size (2023) US$ 14.6 billion
Projected PP Closure Market Value (2033) US$ 22.3 billion
Value CAGR (2023 to 2033) 4.30%

Don't pay for what you don't need

Customize your report by selecting specific countries or regions and save 30%!

2018 to 2022 Global PP Closure Sales Outlook Compared to Demand Forecast from 2023 to 2033

From 2018 to 2022, global sales of PP Closure increased at a CAGR of about 2.5%, reaching a market size of US$ 14 billion in 2022.

Looking forwards, the global market for PP closures is expected to witness a CAGR of 4.30% during the assessment period. According to Future Market Insights’ (FMI) latest report, total market value is expected to increase to around US$ 22.3 billion by 2033.

Growth in the global market is driven by various factors. This includes the rising demand for packaged goods, especially in food and beverages sector, and the growing use of PP closures in other pharmaceutical and personal care sectors.

Automation is expected to enable manufacturers to produce PP closures more efficiently and cost-effectively, while also reducing waste and improving quality.

Similarly, digitalization is expected to become important in the PP closure quality. This could lead to the adoption of technologies such as artificial intelligence, robotics, and the IoT in the production process.

Demand is likely to remain high across Asia-Pacific nations including China & India due to the rapid urbanization, high demand for packaged goods, and increasing need for high-quality packaging solutions.

Comparative View of the PP Closure Market

PP Closure Market:

Attributes PP Closure Market
CAGR (2023 to 2033) 4.30%
Market Value (2033) US$ 22.3 billion
Opportunity The increasing demand for child-resistant and tamper-evident closures to create growth prospects for the market.
Key Trends Adoption of advanced materials and technologies, such as nanotechnology and bioplastics to enhance the performance and sustainability of PP closures will boost the market.

Metal Closure Market:

Attributes Metal Closure Market
CAGR (2023 to 2033) 6.0%
Market Value (2033) US$ 52.8 billion
Opportunity Sharp rise in the production and consumption of alcoholic beverages, carbonated soft drinks, and bottled water to create high demand for metal closures.
Key Trends Growing usage of metal closures across pharmaceutical, home care, and personal care & cosmetic sectors will fuel market expansion.

Plastic Caps & Closure Market:

Attributes Plastic Caps & Closure Market
CAGR (2023 to 2033) 5.3%
Market Value (2033) US$ 76.95 billion
Opportunity Rising production and consumption of carbonated and non-carbonated beverages to boost the global plastic caps & closure market.
Key Trends The use of smart features such as tamper evidence and dispensing systems, to enhance functionality and convenience for consumers will boost the market.
Ismail Sutaria
Ismail Sutaria

Principal Consultant

Talk to Analyst

Find your sweet spots for generating winning opportunities in this market.

Country-wise Insights

What is Triggering Growth of the United States PP Closure Industry?

Focus on Diversifying PP Closure Products to Fuel Market Expansion in the United States

Country United States
Market Size (US$ billion) by End of Forecast Period (2033) US$ 3.9 billion
CAGR from 2023 to the End of Forecast (2033) 3.4%

As per Future Market Insights (FMI), the United States PP closure market is set to thrive at 3.4% CAGR, reaching a valuation of US$ 3.9 billion by 2033. Growth in the market is driven by rising demand for PP closures from food & beverage, cosmetic, and healthcare sectors and focus on product diversification.

The United States is indeed eager to diversify its PP (polypropylene) closure market for several reasons. One such reason is the extensive usage of PP closures in the packaging vertical, particularly in food and beverage sector.

The United States is one of the leading consumers of PP closures in the world. However, a reliance on a limited number of suppliers can create vulnerabilities in the supply chain, such as price volatility, quality issues, and disruptions in production.

To address these challenges, the United States is pursuing a range of strategies to diversify its PP closure market. One approach is to encourage domestic production, by providing tax incentives and other forms of support for manufacturers, and by promoting policies that incentivize companies to invest in the United States. This can help to create jobs and support local industries, while also reducing reliance on foreign suppliers.

Another strategy is to develop alternative sources of supply, such as by exploring new suppliers in other regions, or by developing new materials and technologies that can replace or supplement traditional PP closures.

For example, various companies are exploring the use of bioplastics or other sustainable materials as alternatives to PP closures. This can help to reduce environmental impact and increase sustainability, while also diversifying the market and reducing risk.

Diversifying the PP closure product lineup is seen as a key strategic priority for the United States, as it helps to reduce risk, promote sustainability, and support domestic sectors.

What is Driving Demand for PP Closures in the United Kingdom?

High Consumption of Packaged Food & Beverages Driving PP Closure Demand in the United Kingdom

Country United Kingdom
Market Size (US$ billion) by End of Forecast Period (2033) US$ 0.728 billion
CAGR from 2023 to the End of Forecast (2033) 3.9%

The United Kingdom PP closure industry is anticipated to cross a valuation of US$ 0.728 billion by 2033. From 2023 to 2033, PP closure demand in the country is projected to increase at 3.9% CAGR.

The United Kingdom is one of the prominent markets for PP closures in Europe and has a strong market base for the PP closure market.

Growth in the United Kingdom market is driven by several factors. This includes the increasing demand for packaged food and beverages, rise in e-commerce, and growing focus on sustainability.

The demand for packaged food and beverages in the United Kingdom is increasing due to factors such as changing lifestyles, urbanization, and rising disposable income. This is driving the demand for high-quality PP closures that are compatible with a variety of packaging formats and can ensure the safety and freshness of the products.

Rapid rise of e-commerce in the United Kingdom is also supporting the expansion of the PP closure industry. The growth of online shopping has increased the demand for secure and convenient packaging solutions. This in turn is driving demand for PP closures as they can seal products effectively and maintain their quality during transportation.

How is China PP Closure Market Shaping?

Availability of Customized PP Closures Boosting Growth in China

Country China
Market Size (US$ billion) by End of Forecast Period (2033) US$ 2.8 billion
CAGR from 2023 to the End of Forecast (2033) 5.7%

The PP closure industry in China is expected to progress at a steady CAGR of 5.7% CAGR from 2023 to 2033. Total market valuation in China is likely to exceed US$ 2.8 billion by the end of 2033.

Growth in China market is driven by several factors. This includes rapid expansion of food & beverage sector, technological advancements, and increasing demand for customized and value-added products.

With the growing demand for PP closures in China, manufacturers are expected to invest in research and development to introduce new and innovative products, further driving market growth.

What Strategies are Being Employed by PP Closure Manufacturers in Japan to Gain Profits?

Manufacturers in Japan Embracing Automation to Improve Productivity and Gain Profits

Country Japan
Market Size (US$ billion) by End of Forecast Period (2033) US$ 0.874 billion
CAGR from 2023 to the End of Forecast (2033) 2.6%

Japan PP closure industry is projected to reach a valuation of US$ 0.874 billion by 2033. Over the next ten years, PP closure sales in Japan market are likely to soar at 2.6% CAGR.

Increasing demand from food & beverage sector, growing trend of automation in the manufacturing sector, and the need for enhanced efficiency and productivity are key factors driving Japan market.

Manufacturers are increasingly using automated systems to produce PP closures, which helps to improve efficiency, reduce labor costs, and enhance productivity. Automation also allows manufacturers to produce high-quality products consistently, which is driving the demand for PP closures with advanced features and customization options.

Category-wise Insights

Which is the Highly Sought-after Closure Type in the Global Market?

Demand Remains High for Screw Closures in the Global Market

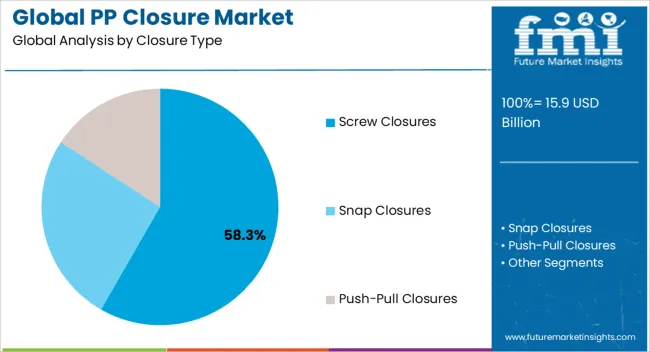
Based on closure type, the global market is segmented into screw closures, snap closures, and push-pull closures. Among these, demand is expected to remain high for screw closures. This is due to rising usage of these closures across a wide range of sectors.

According to Future Market Insights (FMI), the screw closures segment is anticipated to progress at a CAGR of 4.8% during the forecast period. It is likely to hold around 57% of the global market by 2033.

PP screw closures are widely used in a variety of sectors for their versatility, durability, and cost-effectiveness. They are particularly popular for use in the food and beverage sector, where they are used to seal containers for products such as sauces, condiments, and beverages.

The screw closure segment holds a key market share in the PP closure industry. These closures are compatible with a wide range of container sizes and shapes. They are also easy to use and can be quickly applied and removed, making them a popular choice for both consumers and manufacturers.

Why is the Most Commonly Used Technology for Manufacturing PP Closures?

Manufacturers Prefer Injection Molding Technology for Producing PP Closures

As per Future Market Insights (FMI), inject molding is likely to remain a commonly opted PP closure manufacturing technology globally. The target is anticipated to thrive at 3.8% CAGR during the forecast period, accounting for a prominent market share of around 71% in 2033.Top of Form

Injection molding technology is becoming increasingly popular in the PP closure industry because it allows for the production of closures with high precision and consistency.

Injection molding machines can produce large quantities of closures quickly and efficiently, with minimal variation in size, shape, and quality. This makes injection molding an ideal choice for manufacturers that need to produce high volumes of closures with tight tolerances and consistent performance.

Which End-use Sector will Create the Most Opportunities for PP Closure Companies?

Food and Beverage Sector to Create Lucrative Opportunities for PP Closure Manufacturers

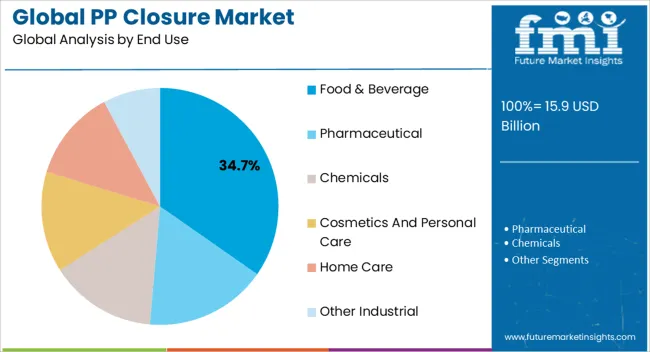
Based on end use, adoption of PP closures is expected to remain high in the food & beverage sector. This is due to various benefits that PP closures provide to food & beverage businesses.

PP closures are easy to use and provide a secure seal. They can be quickly applied and removed, making them a popular choice for both food manufacturers and consumers.

PP closures offer a tight seal that is resistant to leakage, ensuring that the product remains fresh and free from contamination. Adoption of these closures helps companies to protect their products from external factors and extend their shelf life.

Rising need for protective packaging solutions across the thriving food & beverage sector globally is expected to bolster PP closures sales during the next ten years.

Get the data you need at a Fraction of the cost

Personalize your report by choosing insights you need
and save 40%!

How Market Players Stay Competitive in PP Closure Industry?

Key manufacturers of PP (polypropylene) closure are adopting various strategies such as innovation, customization, quality control, sustainability, and customer service to differentiate themselves from their competitors and meet the changing needs of their customers.
Key Strategies Adopted by PP Closure Manufacturers

Developing Innovative Product:

Companies are investing in research and development to find new materials that can improve the performance of PP closures. For instance, they may explore the use of bioplastics or recycled plastics, which are more sustainable and eco-friendly.

Companies also look for new additives or modifiers that can enhance the properties of PP closures, such as UV stabilizers, anti-static agents, and anti-blocking agents.

Customization:

Leading PP closure companies can customize their products by offering a wide range of closure sizes and shapes. This allows customers to select closures that fit their specific packaging needs.

Companies offer closures in different diameters and heights to fit different types of bottles, jars, and containers. Several companies also offer closures with various neck finishes, such as screw-on, snap-on, or press-on, to match different types of packaging.

Sustainability:

Companies are creating more sustainable products by using recycled materials. They are using post-consumer recycled polypropylene (PCR-PP) to manufacture closures, which reduces the amount of plastic waste that goes to landfills. The use of recycled materials also conserves natural resources and reduces the carbon footprint of the product.

Strategic Expansion:

Several companies are expanding their product lines by introducing new closure designs that cater to specific market segments. They are conducting market research to identify the needs and preferences of different customer groups and developing closures that meet these requirements.

For instance, companies are developing closures with specific tamper-evidence features for the pharmaceutical industry or closures with improved pour spouts for the food and beverage industry.

Acquisition:

The companies in the PP closure industry can expand their product offerings through acquisitions. They are acquiring companies that specialize in the production of complementary closure products to solidify their position.

Key Players in the PP Closure Industry:

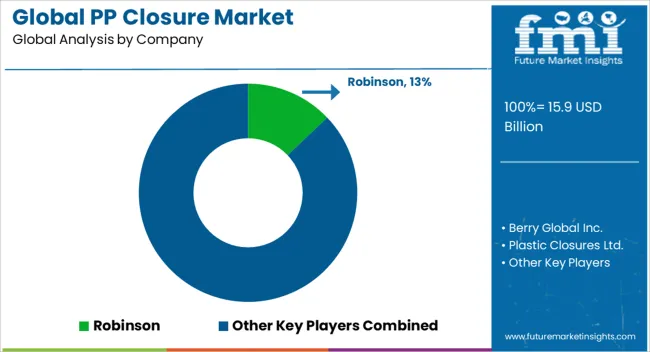
  • Robinson
  • Berry Global
  • Plastic Closures Ltd.
  • Weener Plastics
  • Amcor
  • Silgan Plastics
  • Comar
  • Rieke Packaging

Key Developments:

  • In 2021, Amcor in collaboration with MGJ introduced IMPRESSIONS, a novel technology that allows brands to customize closure liners.
  • In 2021, Silgan Holdings Inc. acquired Easytech Closures S.p.A.
  • In 2018, Sabic presented its latest packaging closures and caps at the Plastic Closures Innovations Conference in Berlin, Germany.
  • In January 2021, a new lightweight polypropylene closure was launched by Berry Global for medical applications.

Scope of the Report

Attribute Details
Estimated Market Value (2023) US$ 14.6 billion
Projected Market Value (2033) US$ 22.3 billion
Anticipated Growth Rate (2023 to 2033) 4.30%
Forecast Period 2023 to 2033
Historical Data Available for 2018 to 2022
Market Analysis US$ Million for Value
Key Countries Covered United States, Canada, Brazil, Mexico, Argentina, Rest of Latin America, China, Japan, South Korea, India, ASEAN, Oceania, Rest of South Asia & Pacific, Germany, Italy, France, United Kingdom, Spain, BENELUX, Nordics, Rest of Western Europe, Poland, Hungary, Romania, Czech Republic, Rest of Eastern Europe, Central Asia, Russia & Belarus, Balkan & Baltics, Saudi Arabia, United Arab Emirates, Turkiye, Northern Africa, South Africa, Israel, Rest of Middle East & Africa
Key Segments Covered Closure Type, Technology, End Use, and Region
Key Companies Profiled
  • Robinson
  • Berry Global
  • Plastic Closures Ltd.
  • Weener Plastics
  • Amcor
  • Silgan Plastics
  • Comar
  • Rieke Packaging
Report Coverage Market Forecast, Company Share Analysis, Competition Intelligence, DROT Analysis, Market Dynamics and Challenges, and Strategic Growth Initiatives

Global PP Closure Industry Segmentation

By Closure Type:

  • Screw Closures
  • Snap Closures
  • Push-Pull Closures

By Technology:

  • Compression Molding
  • Injection Molding

By End Use:

  • Food & Beverage
  • Pharmaceutical
  • Chemicals
  • Cosmetics and Personal Care
  • Home Care
  • Other Industrial

By Region:

  • North America
  • Latin America
  • East Asia
  • South Asia & Pacific
  • Western Europe
  • Eastern Europe
  • Central Asia
  • Russia & Belarus
  • Balkan & Baltic Countries
  • Middle East & Africa

Frequently Asked Questions

What is the Current Global PP Closure Market Valuation?

The global PP closure market is valued at US$ 14.6 billion in 2023.

What is the Projected Size of the Global PP Closure Market by 2033?

The global PP closure market is projected to attain a value of US$ 22.3 billion by 2033.

What is the Estimated CAGR for the Global PP Closure Market?

Global PP closure sales are anticipated to surge at a robust 4.30% CAGR through 2033.

Which Region Demonstrates Significant Profit Potential for Global PP Closure Market?

The Asia Pacific region demonstrates substantial profit opportunities within the global PP closure market.

Which is the Key Segment in the Global PP Closure Market by Closure Type?

The screw closures segment is poised to dominate the market, holding a 57% global market share by 2033.

Table of Content

1. Executive Summary

    1.1. Global Market Outlook

    1.2. Market Analysis

    1.3. Analysis and Recommendations

2. Market Overview

    2.1. Market Coverage / Taxonomy

    2.2. Market Definition / Scope / Limitations

3. Key Market Trends

    3.1. Key Trends Impacting the Market

    3.2. Sustainable Trends

    3.3. Technological Trends

    3.4. Product Innovation / Development Trends

4. Key Success Factors

    4.1. Product Adoption / Usage Analysis

    4.2. Product USP’s / Features

    4.3. Strategic Promotional Strategies

    4.4. Go-to-market Strategies

5. Market Demand Analysis 2018 to 2022 and Forecast, 2023 to 2033

    5.1. Historical Market Volume (Units) Analysis, 2018 to 2022

    5.2. Current and Future Market Volume (Units) Projections, 2023 to 2033

    5.3. Y-o-Y Growth Trend Analysis

6. Market - Pricing Analysis

    6.1. Regional Pricing Analysis

    6.2. Global Average Pricing Analysis Benchmark

7. Market Demand (in Value or Size in US$ Billion) Analysis 2018 to 2022 and Forecast, 2023 to 2033

    7.1. Historical Market Value (US$ Billion) Analysis, 2018 to 2022

    7.2. Current and Future Market Value (US$ Billion) Projections, 2023 to 2033

        7.2.1. Y-o-Y Growth Trend Analysis

        7.2.2. Absolute $ Opportunity Analysis

8. Market Background

    8.1. Global Packaging Market Overview

    8.2. Forecast Factors - Relevance & Impact

    8.3. Value Chain Analysis & Profitability Margin

        8.3.1. Exhaustive List of Raw Material Suppliers

        8.3.2. Exhaustive List of Distribution Channels/ Converters/Distributors

        8.3.3. Exhaustive List of Brand Owners/ Customer Base

    8.4. Case-based Scenario – Impact Assessment

        8.4.1. Current Statistics

        8.4.2. Short-Mid-Long Term Outlook

        8.4.3. Likely Rebound

    8.5. Market Dynamics

        8.5.1. Drivers

        8.5.2. Restraints

        8.5.3. Opportunity Analysis

    8.6. Supply Demand Analysis

        8.6.1. Import /Export Analysis

9. Market Analysis 2018 to 2022 and Forecast 2023 to 2033, By Closure Type

    9.1. Introduction / Key Findings

    9.2. Historical Market Size (US$ Billion) and Volume (Units) Analysis By Closure Type, 2018 to 2022

    9.3. Current and Future Market Size (US$ Billion) and Volume (Units) Analysis and Forecast By Closure Type, 2023 to 2033

        9.3.1. Screw Closures

        9.3.2. Snap Closures

        9.3.3. Push-Pull Closures

    9.4. Market Attractiveness Analysis By Closure Type

10. Market Analysis 2018 to 2022 and Forecast 2023 to 2033, By Technology

    10.1. Introduction / Key Findings

    10.2. Historical Market Size (US$ Billion) and Volume (Units) Analysis By Technology, 2018 to 2022

    10.3. Current and Future Market Size (US$ Billion) and Volume (Units) Analysis and Forecast By Technology, 2023 to 2033

        10.3.1. Compression Molding

        10.3.2. Injection Molding

    10.4. Market Attractiveness Analysis By Technology

11. Market Analysis 2018 to 2022 and Forecast 2023 to 2033, By End-use

    11.1. Introduction / Key Findings

    11.2. Historical Market Size (US$ Billion) and Volume (Units) Analysis By End-use, 2018 to 2022

    11.3. Current and Future Market Size (US$ Billion) and Volume (Units) Analysis and Forecast By End-use, 2023 to 2033

        11.3.1. Food & Beverage

        11.3.2. Pharmaceutical

        11.3.3. Chemicals

        11.3.4. Cosmetics & Personal Care

        11.3.5. Home Care

        11.3.6. Other Industrial

    11.4. Market Attractiveness Analysis By End-use

12. Market Analysis 2018 to 2022 and Forecast 2023 to 2033, By Region

    12.1. Introduction / Key Findings

    12.2. Historical Market Size (US$ Billion) and Volume (Units) Analysis By Region, 2018 to 2022

    12.3. Current and Future Market Size (US$ Billion) and Volume (Units) Analysis and Forecast By Region, 2023 to 2033

        12.3.1. North America

        12.3.2. Latin America

        12.3.3. East Asia

        12.3.4. South Asia & Pacific

        12.3.5. Western Europe

        12.3.6. Eastern Europe

        12.3.7. Central Asia

        12.3.8. Russia & Belarus

        12.3.9. Balkan & Baltic Countries

        12.3.10. Middle East and Africa

    12.4. Market Attractiveness Analysis By Region

13. North America Market Analysis 2018 to 2022 and Forecast 2023 to 2033

    13.1. Introduction / Key Findings

    13.2. Historical Market Size (US$ Billion) and Volume (Units) Analysis by Market Taxonomy, 2018 to 2022

    13.3. Current Market Size (US$ Billion) and Volume (Units) Analysis and Forecast by Market Taxonomy, 2023 to 2033

        13.3.1. By Region

            13.3.1.1. United States

            13.3.1.2. Canada

        13.3.2. By Closure Type

        13.3.3. By Technology

        13.3.4. By End-use

    13.4. Market Attractiveness Analysis

        13.4.1. By Region

        13.4.2. By Closure Type

        13.4.3. By Technology

        13.4.4. By End-use

14. Latin America Market Analysis 2018 to 2022 and Forecast 2023 to 2033

    14.1. Introduction / Key Findings

    14.2. Historical Market Size (US$ Billion) and Volume (Units) Analysis by Market Taxonomy, 2018 to 2022

    14.3. Current Market Size (US$ Billion) and Volume (Units) Analysis and Forecast by Market Taxonomy, 2023 to 2033

        14.3.1. By Region

            14.3.1.1. Brazil

            14.3.1.2. Mexico

            14.3.1.3. Argentina

            14.3.1.4. Rest of Latin America

        14.3.2. By Closure Type

        14.3.3. By Technology

        14.3.4. By End-use

    14.4. Market Attractiveness Analysis

        14.4.1. By Region

        14.4.2. By Closure Type

        14.4.3. By Technology

        14.4.4. By End-use

15. East Asia Market Analysis 2018 to 2022 and Forecast 2023 to 2033

    15.1. Introduction / Key Findings

    15.2. Historical Market Size (US$ Billion) and Volume (Units) Analysis by Market Taxonomy, 2018 to 2022

    15.3. Current Market Size (US$ Billion) and Volume (Units) Analysis and Forecast by Market Taxonomy, 2023 to 2033

        15.3.1. By Region

            15.3.1.1. China

            15.3.1.2. Japan

            15.3.1.3. South Korea

        15.3.2. By Closure Type

        15.3.3. By Technology

        15.3.4. By End-use

    15.4. Market Attractiveness Analysis

        15.4.1. By Region

        15.4.2. By Closure Type

        15.4.3. By Technology

        15.4.4. By End-use

16. South Asia & Pacific Market Analysis 2018 to 2022 and Forecast 2023 to 2033

    16.1. Introduction / Key Findings

    16.2. Historical Market Size (US$ Billion) and Volume (Units) Analysis by Market Taxonomy, 2018 to 2022

    16.3. Current Market Size (US$ Billion) and Volume (Units) Analysis and Forecast by Market Taxonomy, 2023 to 2033

        16.3.1. By Region

            16.3.1.1. India

            16.3.1.2. ASEAN

            16.3.1.3. Australia & New Zealand

        16.3.2. By Closure Type

        16.3.3. By Technology

        16.3.4. By End-use

    16.4. Market Attractiveness Analysis

        16.4.1. By Region

        16.4.2. By Closure Type

        16.4.3. By Technology

        16.4.4. By End-use

17. Western Europe Market Analysis 2018 to 2022 and Forecast 2023 to 2033

    17.1. Introduction / Key Findings

    17.2. Historical Market Size (US$ Billion) and Volume (Units) Analysis by Market Taxonomy, 2018 to 2022

    17.3. Current Market Size (US$ Billion) and Volume (Units) Analysis and Forecast by Market Taxonomy, 2023 to 2033

        17.3.1. By Region

            17.3.1.1. Germany

            17.3.1.2. France

            17.3.1.3. Spain

            17.3.1.4. Italy

            17.3.1.5. United Kingdom

            17.3.1.6. BENELUX

            17.3.1.7. Nordics

            17.3.1.8. Rest of Western Europe

        17.3.2. By Closure Type

        17.3.3. By Technology

        17.3.4. By End-use

    17.4. Market Attractiveness Analysis

        17.4.1. By Region

        17.4.2. By Closure Type

        17.4.3. By Technology

        17.4.4. By End-use

18. Eastern Europe Market Analysis 2018 to 2022 and Forecast 2023 to 2033

    18.1. Introduction / Key Findings

    18.2. Historical Market Size (US$ Billion) and Volume (Units) Analysis by Market Taxonomy, 2018 to 2022

    18.3. Current Market Size (US$ Billion) and Volume (Units) Analysis and Forecast by Market Taxonomy, 2023 to 2033

        18.3.1. By Region

            18.3.1.1. Poland

            18.3.1.2. Hungary

            18.3.1.3. Austria

            18.3.1.4. Czech Republic

            18.3.1.5. Rest of Eastern Europe

        18.3.2. By Closure Type

        18.3.3. By Technology

        18.3.4. By End-use

    18.4. Market Attractiveness Analysis

        18.4.1. By Region

        18.4.2. By Closure Type

        18.4.3. By Technology

        18.4.4. By End-use

19. Central Asia Market Analysis 2018 to 2022 and Forecast 2023 to 2033

    19.1. Introduction / Key Findings

    19.2. Historical Market Size (US$ Billion) and Volume (Units) Analysis by Market Taxonomy, 2018 to 2022

    19.3. Current Market Size (US$ Billion) and Volume (Units) Analysis and Forecast by Market Taxonomy, 2023 to 2033

        19.3.1. By Region

            19.3.1.1. Kazakhstan

            19.3.1.2. Kyrgyzstan

            19.3.1.3. Tajikistan

            19.3.1.4. Turkmenistan

            19.3.1.5. Uzbekistan

        19.3.2. By Closure Type

        19.3.3. By Technology

        19.3.4. By End-use

    19.4. Market Attractiveness Analysis

        19.4.1. By Region

        19.4.2. By Closure Type

        19.4.3. By Technology

        19.4.4. By End-use

20. Russia & Belarus Market Analysis 2018 to 2022 and Forecast 2023 to 2033

    20.1. Introduction / Key Findings

    20.2. Historical Market Size (US$ Billion) and Volume (Units) Analysis by Market Taxonomy, 2018 to 2022

    20.3. Current Market Size (US$ Billion) and Volume (Units) Analysis and Forecast by Market Taxonomy, 2023 to 2033

        20.3.1. By Region

            20.3.1.1. Russia

            20.3.1.2. Belarus

        20.3.2. By Closure Type

        20.3.3. By Technology

        20.3.4. By Distribution Channel

        20.3.5. By End-use

    20.4. Market Attractiveness Analysis

        20.4.1. By Region

        20.4.2. By Closure Type

        20.4.3. By Technology

        20.4.4. By End-use

21. Balkan Countries Market Analysis 2018 to 2022 and Forecast 2023 to 2033

    21.1. Introduction / Key Findings

    21.2. Historical Market Size (US$ Billion) and Volume (Units) Analysis by Market Taxonomy, 2018 to 2022

    21.3. Current Market Size (US$ Billion) and Volume (Units) Analysis and Forecast by Market Taxonomy, 2023 to 2033

        21.3.1. By Region

            21.3.1.1. Romania

            21.3.1.2. Greece

            21.3.1.3. Bulgaria

        21.3.2. By Closure Type

        21.3.3. By Technology

        21.3.4. By End-use

    21.4. Market Attractiveness Analysis

        21.4.1. By Region

        21.4.2. By Closure Type

        21.4.3. By Technology

        21.4.4. By End-use

22. Baltic Countries Market Analysis 2018 to 2022 and Forecast 2023 to 2033

    22.1. Introduction / Key Findings

    22.2. Historical Market Size (US$ Billion) and Volume (Units) Analysis by Market Taxonomy, 2018 to 2022

    22.3. Current Market Size (US$ Billion) and Volume (Units) Analysis and Forecast by Market Taxonomy, 2023 to 2033

        22.3.1. By Region

            22.3.1.1. Lithuania

            22.3.1.2. Estonia

            22.3.1.3. Latvia

        22.3.2. By Closure Type

        22.3.3. By Technology

        22.3.4. By End-use

    22.4. Market Attractiveness Analysis

        22.4.1. By Region

        22.4.2. By Closure Type

        22.4.3. By Technology

        22.4.4. By End-use

23. Middle East & Africa Market Analysis 2018 to 2022 and Forecast 2023 to 2033

    23.1. Introduction / Key Findings

    23.2. Historical Market Size (US$ Billion) and Volume (Units) Analysis by Market Taxonomy, 2018 to 2022

    23.3. Current Market Size (US$ Billion) and Volume (Units) Analysis and Forecast by Market Taxonomy, 2023 to 2033

        23.3.1. By Region

            23.3.1.1. GCC Countries

            23.3.1.2. Turkiye

            23.3.1.3. Northern Africa

            23.3.1.4. South Africa

            23.3.1.5. Israel

            23.3.1.6. Saudi Arabia

        23.3.2. By Closure Type

        23.3.3. By Technology

        23.3.4. By End-use

    23.4. Market Attractiveness Analysis

        23.4.1. By Region

        23.4.2. By Closure Type

        23.4.3. By Technology

        23.4.4. By End-use

24. Region wise Market Analysis 2023 & 2033

    24.1. United States Market Analysis

        24.1.1. By Closure Type

        24.1.2. By Technology

        24.1.3. By End-use

    24.2. Canada Market Analysis

        24.2.1. By Closure Type

        24.2.2. By Technology

        24.2.3. By End-use

    24.3. Brazil Market Analysis

        24.3.1. By Closure Type

        24.3.2. By Technology

        24.3.3. By End-use

    24.4. Mexico Market Analysis

        24.4.1. By Closure Type

        24.4.2. By Technology

        24.4.3. By End-use

    24.5. Germany Market Analysis

        24.5.1. By Closure Type

        24.5.2. By Technology

        24.5.3. By End-use

    24.6. United Kingdom Market Analysis

        24.6.1. By Closure Type

        24.6.2. By Technology

        24.6.3. By End-use

    24.7. Spain Market Analysis

        24.7.1. By Closure Type

        24.7.2. By Technology

        24.7.3. By End-use

    24.8. France Market Analysis

        24.8.1. By Closure Type

        24.8.2. By Technology

        24.8.3. By End-use

    24.9. Italy Market Analysis

        24.9.1. By Closure Type

        24.9.2. By Technology

        24.9.3. By End-use

    24.10. Russia Market Analysis

        24.10.1. By Closure Type

        24.10.2. By Technology

        24.10.3. By End-use

    24.11. China Market Analysis

        24.11.1. By Closure Type

        24.11.2. By Technology

        24.11.3. By End-use

    24.12. Japan Market Analysis

        24.12.1. By Closure Type

        24.12.2. By Technology

        24.12.3. By End-use

    24.13. India Market Analysis

        24.13.1. By Closure Type

        24.13.2. By Technology

        24.13.3. By End-use

    24.14. GCC Countries Market Analysis

        24.14.1. By Closure Type

        24.14.2. By Technology

        24.14.3. By End-use

    24.15. Australia Market Analysis

        24.15.1. By Closure Type

        24.15.2. By Technology

        24.15.3. By End-use

25. Market Structure Analysis

    25.1. Market Analysis by Tier of Companies (Sustainable Packaging)

    25.2. Market Share Analysis of Top Players

    25.3. Market Presence Analysis

26. Competition Analysis

    26.1. Competition Dashboard

    26.2. Competition Benchmarking

    26.3. Competition Deep Dive

        26.3.1. Robinson

            26.3.1.1. Overview

            26.3.1.2. Product Portfolio

            26.3.1.3. Profitability by Market Segments (Closure Type/Technology/End-use/Region)

            26.3.1.4. Sales Footprint

            26.3.1.5. Strategy Overview

        26.3.2. Berry Global Inc.

            26.3.2.1. Overview

            26.3.2.2. Product Portfolio

            26.3.2.3. Profitability by Market Segments (Closure Type/Technology/End-use/Region)

            26.3.2.4. Sales Footprint

            26.3.2.5. Strategy Overview

        26.3.3. Plastic Closures Ltd.

            26.3.3.1. Overview

            26.3.3.2. Product Portfolio

            26.3.3.3. Profitability by Market Segments (Closure Type/Technology/End-use/Region)

            26.3.3.4. Sales Footprint

            26.3.3.5. Strategy Overview

        26.3.4. Weener Plastics

            26.3.4.1. Overview

            26.3.4.2. Product Portfolio

            26.3.4.3. Profitability by Market Segments (Closure Type/Technology/End-use/Region)

            26.3.4.4. Sales Footprint

            26.3.4.5. Strategy Overview

        26.3.5. Amcor

            26.3.5.1. Overview

            26.3.5.2. Product Portfolio

            26.3.5.3. Profitability by Market Segments (Closure Type/Technology/End-use/Region)

            26.3.5.4. Sales Footprint

            26.3.5.5. Strategy Overview

        26.3.6. Silgan Plastics

            26.3.6.1. Overview

            26.3.6.2. Product Portfolio

            26.3.6.3. Profitability by Market Segments (Closure Type/Technology/End-use/Region)

            26.3.6.4. Sales Footprint

            26.3.6.5. Strategy Overview

        26.3.7. Comar

            26.3.7.1. Overview

            26.3.7.2. Product Portfolio

            26.3.7.3. Profitability by Market Segments (Closure Type/Technology/End-use/Region)

            26.3.7.4. Sales Footprint

            26.3.7.5. Strategy Overview

        26.3.8. SABIC

            26.3.8.1. Overview

            26.3.8.2. Product Portfolio

            26.3.8.3. Profitability by Market Segments (Closure Type/Technology/End-use/Region)

            26.3.8.4. Sales Footprint

            26.3.8.5. Strategy Overview

        26.3.9. O.Berk

            26.3.9.1. Overview

            26.3.9.2. Product Portfolio

            26.3.9.3. Profitability by Market Segments (Closure Type/Technology/End-use/Region)

            26.3.9.4. Sales Footprint

            26.3.9.5. Strategy Overview

        26.3.10. Rieke Packaging

            26.3.10.1. Overview

            26.3.10.2. Product Portfolio

            26.3.10.3. Profitability by Market Segments (Closure Type/Technology/End-use/Region)

            26.3.10.4. Sales Footprint

            26.3.10.5. Strategy Overview

        26.3.11. Gilfor

            26.3.11.1. Overview

            26.3.11.2. Product Portfolio

            26.3.11.3. Profitability by Market Segments (Closure Type/Technology/End-use/Region)

            26.3.11.4. Sales Footprint

            26.3.11.5. Strategy Overview

        26.3.12. Drug Plastics

            26.3.12.1. Overview

            26.3.12.2. Product Portfolio

            26.3.12.3. Profitability by Market Segments (Closure Type/Technology/End-use/Region)

            26.3.12.4. Sales Footprint

            26.3.12.5. Strategy Overview

        26.3.13. Bericap

            26.3.13.1. Overview

            26.3.13.2. Product Portfolio

            26.3.13.3. Profitability by Market Segments (Closure Type/Technology/End-use/Region)

            26.3.13.4. Sales Footprint

            26.3.13.5. Strategy Overview

        26.3.14. Hercules

            26.3.14.1. Overview

            26.3.14.2. Product Portfolio

            26.3.14.3. Profitability by Market Segments (Closure Type/Technology/End-use/Region)

            26.3.14.4. Sales Footprint

            26.3.14.5. Strategy Overview

27. Assumptions and Acronyms Used

28. Research Methodology

List of Tables

Table 01: Market Value (US$ billion) Analysis, By Closure Type, 2018H to 2033F

Table 02: Market Volume (Units) Analysis, By Closure Type, 2018H to 2033F

Table 03: Market Value (US$ billion) Analysis, by Technology, 2018H to 2033F

Table 04: Market Volume (Units) Analysis, by Technology, 2018H to 2033F

Table 05: Market Value (US$ billion) Analysis, by End-use, 2018H to 2033F

Table 06: Market Volume (Units) Analysis, by End-use, 2018H to 2033F

Table 07: Market Value (US$ billion) Analysis, by Region, 2018H to 2033F

Table 08: Market Volume (Units) Analysis, by Region, 2018H to 2033F

Table 09: North America Market Value (US$ billion) Analysis, By Closure Type, 2018H to 2033F

Table 10: North America Market Volume (Units) Analysis, By Closure Type, 2018H to 2033F

Table 11: North America Market Value (US$ billion) Analysis, by Technology, 2018H to 2033F

Table 12: North America Market Volume (Units) Analysis, by Technology, 2018H to 2033F

Table 13: North America Market Value (US$ billion) Analysis, by End-use, 2018H to 2033F

Table 14: North America Market Volume (Units) Analysis, by End-use, 2018H to 2033F

Table 15: North America Market Value (US$ billion) Analysis, by Region, 2018H to 2033F

Table 16: North America Market Volume (Units) Analysis, by Region, 2018H to 2033F

Table 17: Latin America Market Value (US$ billion) Analysis, By Closure Type, 2018H to 2033F

Table 18: Latin America Market Volume (Units) Analysis, By Closure Type, 2018H to 2033F

Table 19: Latin America Market Value (US$ billion) Analysis, by Technology, 2018H to 2033F

Table 20: Latin America Market Volume (Units) Analysis, by Technology, 2018H to 2033F

Table 21: Latin America Market Value (US$ billion) Analysis, by End-use, 2018H to 2033F

Table 22: Latin America Market Volume (Units) Analysis, by End-use, 2018H to 2033F

Table 23: Latin America Market Value (US$ billion) Analysis, by Region, 2018H to 2033F

Table 24: Latin America Market Volume (Units) Analysis, by Region, 2018H to 2033F

Table 25: East Asia Market Value (US$ billion) Analysis, By Closure Type, 2018H to 2033F

Table 26: East Asia Market Volume (Units) Analysis, By Closure Type, 2018H to 2033F

Table 27: East Asia Market Value (US$ billion) Analysis, by Technology, 2018H to 2033F

Table 28: East Asia Market Volume (Units) Analysis, by Technology, 2018H to 2033F

Table 29: East Asia Market Value (US$ billion) Analysis, by End-use, 2018H to 2033F

Table 30: East Asia Market Volume (Units) Analysis, by End-use, 2018H to 2033F

Table 31: East Asia Market Value (US$ billion) Analysis, by Region, 2018H to 2033F

Table 32: East Asia Market Volume (Units) Analysis, by Region, 2018H to 2033F

Table 33: South Asia & Pacific Market Value (US$ billion) Analysis, By Closure Type, 2018H to 2033F

Table 34: South Asia & Pacific Market Volume (Units) Analysis, By Closure Type, 2018H to 2033F

Table 35: South Asia & Pacific Market Value (US$ billion) Analysis, by Technology, 2018H to 2033F

Table 36: South Asia & Pacific Market Volume (Units) Analysis, by Technology, 2018H to 2033F

Table 37: South Asia & Pacific Market Value (US$ billion) Analysis, by End-use, 2018H to 2033F

Table 38: South Asia & Pacific Market Volume (Units) Analysis, by End-use, 2018H to 2033F

Table 39: South Asia & Pacific Market Value (US$ billion) Analysis, by Region, 2018H to 2033F

Table 40: South Asia & Pacific Market Volume (Units) Analysis, by Region, 2018H to 2033F

Table 41: Western Europe Market Value (US$ billion) Analysis, By Closure Type, 2018H to 2033F

Table 42: Western Europe Market Volume (Units) Analysis, By Closure Type, 2018H to 2033F

Table 43: Western Europe Market Value (US$ billion) Analysis, by Technology, 2018H to 2033F

Table 44: Western Europe Market Volume (Units) Analysis, by Technology, 2018H to 2033F

Table 45: Western Europe Market Value (US$ billion) Analysis, by End-use, 2018H to 2033F

Table 46: Western Europe Market Volume (Units) Analysis, by End-use, 2018H to 2033F

Table 47: Western Europe Market Value (US$ billion) Analysis, by Region, 2018H to 2033F

Table 48: Western Europe Market Volume (Units) Analysis, by Region, 2018H to 2033F

Table 49: Eastern Europe Market Value (US$ billion) Analysis, By Closure Type, 2018H to 2033F

Table 50: Eastern Europe Market Volume (Units) Analysis, By Closure Type, 2018H to 2033F

Table 51: Eastern Europe Market Value (US$ billion) Analysis, by Technology, 2018H to 2033F

Table 52: Eastern Europe Market Volume (Units) Analysis, by Technology, 2018H to 2033F

Table 53: Eastern Europe Market Value (US$ billion) Analysis, by End-use, 2018H to 2033F

Table 54: Eastern Europe Market Volume (Units) Analysis, by End-use, 2018H to 2033F

Table 55: Eastern Europe Market Value (US$ billion) Analysis, by Region, 2018H to 2033F

Table 56: Eastern Europe Market Volume (Units) Analysis, by Region, 2018H to 2033F

Table 57: Central Asia Market Value (US$ billion) Analysis, By Closure Type, 2018H to 2033F

Table 58: Central Asia Market Volume (Units) Analysis, By Closure Type, 2018H to 2033F

Table 59: Central Asia Market Value (US$ billion) Analysis, by Technology, 2018H to 2033F

Table 60: Central Asia Market Volume (Units) Analysis, by Technology, 2018H to 2033F

Table 61: Central Asia Market Value (US$ billion) Analysis, by End-use, 2018H to 2033F

Table 62: Central Asia Market Volume (Units) Analysis, by End-use, 2018H to 2033F

Table 63: Central Asia Market Value (US$ billion) Analysis, by Region, 2018H to 2033F

Table 64: Central Asia Market Volume (Units) Analysis, by Region, 2018H to 2033F

Table 65: Russia & Belarus Market Value (US$ billion) Analysis, By Closure Type, 2018H to 2033F

Table 66: Russia & Belarus Market Volume (Units) Analysis, By Closure Type, 2018H to 2033F

Table 67: Russia & Belarus Market Value (US$ billion) Analysis, by Technology, 2018H to 2033F

Table 68: Russia & Belarus Market Volume (Units) Analysis, by Technology, 2018H to 2033F

Table 69: Russia & Belarus Market Value (US$ billion) Analysis, by End-use, 2018H to 2033F

Table 70: Russia & Belarus Market Volume (Units) Analysis, by End-use, 2018H to 2033F

Table 71: Russia & Belarus Market Value (US$ billion) Analysis, by Region, 2018H to 2033F

Table 72: Russia & Belarus Market Volume (Units) Analysis, by Region, 2018H to 2033F

Table 73: Balkan Countries Market Value (US$ billion) Analysis, By Closure Type, 2018H to 2033F

Table 74: Balkan Countries Market Volume (Units) Analysis, By Closure Type, 2018H to 2033F

Table 75: Balkan Countries Market Value (US$ billion) Analysis, by Technology, 2018H to 2033F

Table 76: Balkan Countries Market Volume (Units) Analysis, by Technology, 2018H to 2033F

Table 77: Balkan Countries Market Value (US$ billion) Analysis, by End-use, 2018H to 2033F

Table 78: Balkan Countries Market Volume (Units) Analysis, by End-use, 2018H to 2033F

Table 79: Balkan Countries Market Value (US$ billion) Analysis, by Region, 2018H to 2033F

Table 80: Balkan Countries Market Volume (Units) Analysis, by Region, 2018H to 2033F

Table 81: Baltic Countries Market Value (US$ billion) Analysis, By Closure Type, 2018H to 2033F

Table 82: Baltic Countries Market Volume (Units) Analysis, By Closure Type, 2018H to 2033F

Table 83: Baltic Countries Market Value (US$ billion) Analysis, by Technology, 2018H to 2033F

Table 84: Baltic Countries Market Volume (Units) Analysis, by Technology, 2018H to 2033F

Table 85: Baltic Countries Market Value (US$ billion) Analysis, by End-use, 2018H to 2033F

Table 86: Baltic Countries Market Volume (Units) Analysis, by End-use, 2018H to 2033F

Table 87: Baltic Countries Market Value (US$ billion) Analysis, by Region, 2018H to 2033F

Table 88: Baltic Countries Market Volume (Units) Analysis, by Region, 2018H to 2033F

Table 89: Middle East & Africa Market Value (US$ billion) Analysis, By Closure Type, 2018H to 2033F

Table 90: Middle East & Africa Market Volume (Units) Analysis, By Closure Type, 2018H to 2033F

Table 91: Middle East & Africa Market Value (US$ billion) Analysis, by Technology, 2018H to 2033F

Table 92: Middle East & Africa Market Volume (Units) Analysis, by Technology, 2018H to 2033F

Table 93: Middle East & Africa Market Value (US$ billion) Analysis, by End-use, 2018H to 2033F

Table 94: Middle East & Africa Market Volume (Units) Analysis, by End-use, 2018H to 2033F

Table 95: Middle East & Africa Market Value (US$ billion) Analysis, by Region, 2018H to 2033F

Table 96: Middle East & Africa Market Volume (Units) Analysis, by Region, 2018H to 2033F

List of Charts

Figure 01: Market Share Analysis By Closure Type, 2023E & 2033F

Figure 02: Market Y-o-Y Analysis By Closure Type, 2018H to 2033F

Figure 03: Market Attractiveness Analysis By Closure Type, 2023E to 2033F

Figure 04: Market Share Analysis by Technology, 2023E & 2033F

Figure 05: Market Y-o-Y Analysis by Technology, 2018H to 2033F

Figure 06: Market Attractiveness Analysis by Technology, 2023E to 2033F

Figure 07: Market Share Analysis by End-use, 2023E & 2033F

Figure 08: Market Y-o-Y Analysis by End-use, 2018H to 2033F

Figure 09: Market Attractiveness Analysis by End-use, 2023E to 2033F

Figure 10: Market Share Analysis by Region 2023E & 2033F

Figure 11: Market Y-o-Y Analysis by Region, 2018H to 2033F

Figure 12: Market Attractiveness Analysis by Region, 2023E to 2033F

Figure 13: North America Market Attractiveness Analysis by Technology, 2023E to 2033F

Figure 14: North America Market Y-o-Y Analysis By Closure Type, 2018H to 2033F

Figure 15: North America Market Value Share Analysis by End-use 2023(E)

Figure 16: North America Market Share Analysis by Region, 2023E & 2033F

Figure 17: Latin America Market Attractiveness Analysis by Technology, 2023E to 2033F

Figure 18: Latin America Market Y-o-Y Analysis By Closure Type, 2018H to 2033F

Figure 19: Latin America Market Value Share Analysis by End-use 2023(E)

Figure 20: Latin America Market Share Analysis by Region, 2023E & 2033F

Figure 21: East Asia Market Attractiveness Analysis by Technology, 2023E to 2033F

Figure 22: East Asia Market Y-o-Y Analysis By Closure Type, 2018H to 2033F

Figure 23: East Asia Market Value Share Analysis by End-use 2023(E)

Figure 24: East Asia Market Share Analysis by Region, 2023E & 2033F

Figure 25: South Asia & Pacific Market Attractiveness Analysis by Technology, 2023E to 2033F

Figure 26: South Asia & Pacific Market Y-o-Y Analysis By Closure Type, 2018H to 2033F

Figure 27: South Asia & Pacific Market Value Share Analysis by End-use 2023(E)

Figure 28: South Asia & Pacific Market Share Analysis by Region, 2023E & 2033F

Figure 29: Western Europe Market Attractiveness Analysis by Technology, 2023E to 2033F

Figure 30: Western Europe Market Y-o-Y Analysis By Closure Type, 2018H to 2033F

Figure 31: Western Europe Market Value Share Analysis by End-use 2023(E)

Figure 32: Western Europe Market Share Analysis by Region, 2023E & 2033F

Figure 33: Eastern Europe Market Attractiveness Analysis by Technology, 2023E to 2033F

Figure 34: Eastern Europe Market Y-o-Y Analysis By Closure Type, 2018H to 2033F

Figure 35: Eastern Europe Market Value Share Analysis by End-use 2023(E)

Figure 36: Eastern Europe Market Share Analysis by Region, 2023E & 2033F

Figure 37: Central Asia Market Attractiveness Analysis by Technology, 2023E to 2033F

Figure 38: Central Asia Market Y-o-Y Analysis By Closure Type, 2018H to 2033F

Figure 39: Central Asia Market Value Share Analysis by End-use 2023(E)

Figure 40: Central Asia Market Share Analysis by Region, 2023E & 2033F

Figure 41: Russia & Belarus Market Attractiveness Analysis by Technology, 2023E to 2033F

Figure 42: Russia & Belarus Market Y-o-Y Analysis By Closure Type, 2018H to 2033F

Figure 43: Russia & Belarus Market Value Share Analysis by End-use 2023(E)

Figure 44: Russia & Belarus Market Share Analysis by Region, 2023E & 2033F

Figure 45: Balkan Countries Market Attractiveness Analysis by Technology, 2023E to 2033F

Figure 46: Balkan Countries Market Y-o-Y Analysis By Closure Type, 2018H to 2033F

Figure 47: Balkan Countries Market Value Share Analysis by End-use 2023(E)

Figure 48: Balkan Countries Market Share Analysis by Region, 2023E & 2033F

Figure 49: Baltic Countries Market Attractiveness Analysis by Technology, 2023E to 2033F

Figure 50: Baltic Countries Market Y-o-Y Analysis By Closure Type, 2018H to 2033F

Figure 51: Baltic Countries Market Value Share Analysis by End-use 2023(E)

Figure 52: Baltic Countries Market Share Analysis by Region, 2023E & 2033F

Figure 53: Middle East & Africa Market Attractiveness Analysis by Technology, 2023E to 2033F

Figure 54: Middle East & Africa Market Y-o-Y Analysis By Closure Type, 2018H to 2033F

Figure 55: Middle East & Africa Market Value Share Analysis by End-use 2023(E)

Figure 56: Middle East & Africa Market Share Analysis by Region, 2023E & 2033F

Figure 57: United States Market Value Share Analysis, by Technology, 2023E & 2033F

Figure 58: United States Market Value Share Analysis, By Closure Type, 2023E & 2033F

Figure 59: United States Market Value Share Analysis, by End-use, 2023E & 2033F

Figure 60: Canada Market Value Share Analysis, by Technology, 2023E & 2033F

Figure 61: Canada Market Value Share Analysis, By Closure Type, 2023E & 2033F

Figure 62: Canada Market Value Share Analysis, by End-use, 2023E & 2033F

Figure 63: Brazil Market Value Share Analysis, by Technology, 2023E & 2033F

Figure 64: Brazil Market Value Share Analysis, By Closure Type, 2023E & 2033F

Figure 65: Brazil Market Value Share Analysis, by End-use, 2023E & 2033F

Figure 66: Mexico Market Value Share Analysis, by Technology, 2023E & 2033F

Figure 67: Mexico Market Value Share Analysis, By Closure Type, 2023E & 2033F

Figure 68: Mexico Market Value Share Analysis, by End-use, 2023E & 2033F

Figure 69: Germany Market Value Share Analysis, by Technology, 2023E & 2033F

Figure 70: Germany Market Value Share Analysis, By Closure Type, 2023E & 2033F

Figure 71: Germany Market Value Share Analysis, by End-use, 2023E & 2033F

Figure 72: Italy Market Value Share Analysis, by Technology, 2023E & 2033F

Figure 73: Italy Market Value Share Analysis, By Closure Type, 2023E & 2033F

Figure 74: Italy Market Value Share Analysis, by End-use, 2023E & 2033F

Figure 75: France Market Value Share Analysis, by Technology, 2023E & 2033F

Figure 76: France Market Value Share Analysis, By Closure Type, 2023E & 2033F

Figure 77: France Market Value Share Analysis, by End-use, 2023E & 2033F

Figure 78: United Kingdom Market Value Share Analysis, by Technology, 2023E & 2033F

Figure 79: United Kingdom Market Value Share Analysis, By Closure Type, 2023E & 2033F

Figure 80: United Kingdom Market Value Share Analysis, by End-use, 2023E & 2033F

Figure 81: Spain Market Value Share Analysis, by Technology, 2023E & 2033F

Figure 82: Spain Market Value Share Analysis, By Closure Type, 2023E & 2033F

Figure 83: Spain Market Value Share Analysis, by End-use, 2023E & 2033F

Figure 84: Russia Market Value Share Analysis, by Technology, 2023E & 2033F

Figure 85: Russia Market Value Share Analysis, By Closure Type, 2023E & 2033F

Figure 86: Russia Market Value Share Analysis, by End-use, 2023E & 2033F

Figure 87: GCC Market Value Share Analysis, by Technology, 2023E & 2033F

Figure 88: GCC Market Value Share Analysis, By Closure Type, 2023E & 2033F

Figure 89: GCC Market Value Share Analysis, by End-use, 2023E & 2033F

Figure 90: South Africa Market Value Share Analysis, by Technology, 2023E & 2033F

Figure 91: South Africa Market Value Share Analysis, By Closure Type, 2023E & 2033F

Figure 92: South Africa Market Value Share Analysis, by End-use, 2023E & 2033F

Figure 93: Japan Market Value Share Analysis, by Technology, 2023E & 2033F

Figure 94: Japan Market Value Share Analysis, By Closure Type, 2023E & 2033F

Figure 95: Japan Market Value Share Analysis, by End-use, 2023E & 2033F

Figure 96: India Market Value Share Analysis, by Technology, 2023E & 2033F

Figure 97: India Market Value Share Analysis, By Closure Type, 2023E & 2033F

Figure 98: India Market Value Share Analysis, by End-use, 2023E & 2033F

Figure 98: China Market Value Share Analysis, by Technology, 2023E & 2033F

Figure 99: China Market Value Share Analysis, By Closure Type, 2023E & 2033F

Figure 100: China Market Value Share Analysis, by End-use, 2023E & 2033F

Figure 101: Australia Market Value Share Analysis, by Technology, 2023E & 2033F

Figure 102: Australia Market Value Share Analysis, By Closure Type, 2023E & 2033F

Figure 103: Australia Market Value Share Analysis, by End-use, 2023E & 2033F

Recommendations

Packaging

Metal Closures Market

Published : April 2024

Packaging

Food Packaging Market

Published : July 2023

Packaging

Plastic Caps & Closures Market

Published : May 2023

Packaging

Tablets And Capsules Packaging Market

Published : September 2022

Explore Packaging Insights

View Reports