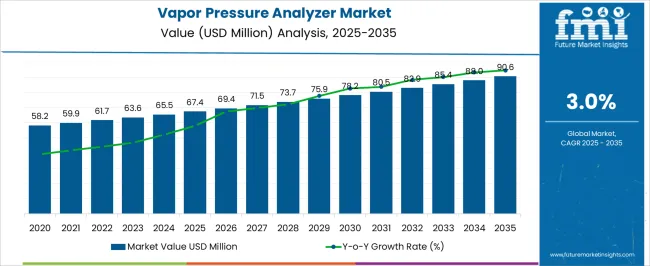
The Vapor Pressure Analyzer Market is estimated to be valued at USD 67.4 million in 2025 and is projected to reach USD 90.6 million by 2035, registering a compound annual growth rate (CAGR) of 3.0% over the forecast period.
| Metric | Value |
|---|---|
| Vapor Pressure Analyzer Market Estimated Value in (2025 E) | USD 67.4 million |
| Vapor Pressure Analyzer Market Forecast Value in (2035 F) | USD 90.6 million |
| Forecast CAGR (2025 to 2035) | 3.0% |
The Vapor Pressure Analyzer market is experiencing significant growth due to increasing demand for precise measurement of volatile compounds and compliance with stringent environmental and fuel quality regulations. The current market scenario reflects widespread adoption across petrochemical, energy, and laboratory sectors where accurate vapor pressure determination is critical for process optimization and safety.
Growth has been supported by technological advancements in automated and software-integrated analyzers, allowing real-time monitoring, reduced manual intervention, and improved accuracy. The increasing complexity of fuels and chemical products, combined with the need for standardized testing in regulatory and industrial applications, is driving the adoption of advanced vapor pressure analyzers.
Future market expansion is expected to be fueled by industrial modernization, increased research and development in chemical analysis, and the growing focus on environmental sustainability, as precise measurement of volatile substances aids in reducing emissions and optimizing formulation As industries continue to prioritize efficiency and compliance, the vapor pressure analyzer market is projected to sustain its upward trajectory, providing both laboratory and industrial users with scalable and reliable solutions.
The vapor pressure analyzer market is segmented by type, applications, and geographic regions. By type, vapor pressure analyzer market is divided into Benchtop Vapor Pressure Analyzer and Portable Vapor Pressure Analyzer. In terms of applications, vapor pressure analyzer market is classified into Fuel Oil, Liquefied Petroleum Gas, Gasoline, and Naptha’s / Kerosene. Regionally, the vapor pressure analyzer industry is classified into North America, Latin America, Western Europe, Eastern Europe, Balkan & Baltic Countries, Russia & Belarus, Central Asia, East Asia, South Asia & Pacific, and the Middle East & Africa.
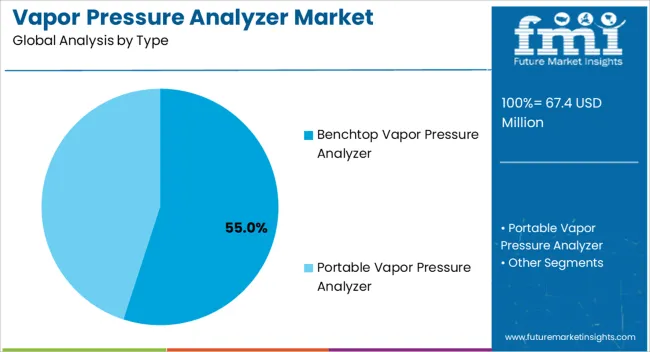
The Benchtop Vapor Pressure Analyzer is projected to hold 55.00% of the total market revenue in 2025, making it the leading type within this market. This dominance is attributed to its compact and versatile design, which allows deployment in laboratory environments where space, precision, and ease of operation are critical. The segment has benefited from increasing demand for high-accuracy analysis in chemical formulation, fuel characterization, and environmental testing.
Benchtop analyzers are favored because they enable automated measurement, rapid data acquisition, and repeatable results, reducing operator dependency and minimizing errors. Their integration with software platforms for data logging and analysis has further enhanced usability in quality control and R&D applications.
The growth of this segment has also been driven by increased adoption in academic and research laboratories, where controlled experimental setups demand reliable and consistent measurements With continued technological advancements improving measurement speed, accuracy, and automation, the benchtop segment is expected to maintain its leading position in the market.
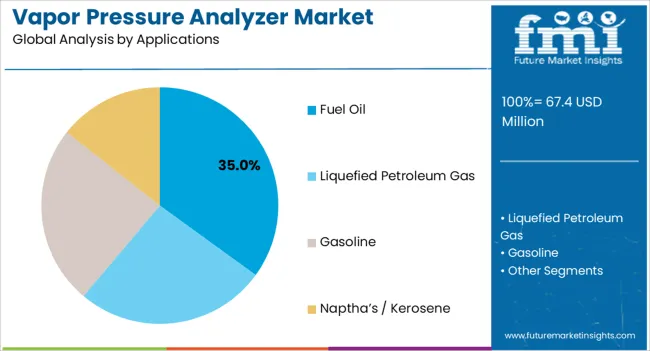
The Fuel Oil application segment is anticipated to account for 35.00% of the overall market revenue in 2025, positioning it as the largest application area. This leadership has been driven by the growing need for accurate vapor pressure measurements to optimize combustion performance, enhance fuel quality, and ensure compliance with environmental standards.
The segment has benefited from increased use in refineries, petrochemical plants, and testing laboratories that require precise monitoring of fuel volatility for safety and efficiency. Accurate vapor pressure analysis is essential in preventing operational hazards, improving storage stability, and guiding formulation adjustments, making these analyzers indispensable in fuel oil applications.
The adoption of automated and software-enhanced analyzers has reduced manual handling and increased throughput, further supporting the segment's growth With rising global energy demand and stricter regulatory frameworks on fuel quality, the use of vapor pressure analyzers in fuel oil applications is expected to remain a critical driver of the market, supporting both operational optimization and environmental compliance.
The vapor pressure analyzer market is segmented by type, applications, and geographic regions. By type, vapor pressure analyzer market is divided into Benchtop Vapor Pressure Analyzer and Portable Vapor Pressure Analyzer. In terms of applications, vapor pressure analyzer market is classified into Fuel Oil, Liquefied Petroleum Gas, Gasoline, and Naptha’s / Kerosene. Regionally, the vapor pressure analyzer industry is classified into North America, Latin America, Western Europe, Eastern Europe, Balkan & Baltic Countries, Russia & Belarus, Central Asia, East Asia, South Asia & Pacific, and the Middle East & Africa.
The Benchtop Vapor Pressure Analyzer is projected to hold 55.00% of the total market revenue in 2025, making it the leading type within this market. This dominance is attributed to its compact and versatile design, which allows deployment in laboratory environments where space, precision, and ease of operation are critical. The segment has benefited from increasing demand for high-accuracy analysis in chemical formulation, fuel characterization, and environmental testing.
Benchtop analyzers are favored because they enable automated measurement, rapid data acquisition, and repeatable results, reducing operator dependency and minimizing errors. Their integration with software platforms for data logging and analysis has further enhanced usability in quality control and R&D applications.
The growth of this segment has also been driven by increased adoption in academic and research laboratories, where controlled experimental setups demand reliable and consistent measurements With continued technological advancements improving measurement speed, accuracy, and automation, the benchtop segment is expected to maintain its leading position in the market.
The Fuel Oil application segment is anticipated to account for 35.00% of the overall market revenue in 2025, positioning it as the largest application area. This leadership has been driven by the growing need for accurate vapor pressure measurements to optimize combustion performance, enhance fuel quality, and ensure compliance with environmental standards.
The segment has benefited from increased use in refineries, petrochemical plants, and testing laboratories that require precise monitoring of fuel volatility for safety and efficiency. Accurate vapor pressure analysis is essential in preventing operational hazards, improving storage stability, and guiding formulation adjustments, making these analyzers indispensable in fuel oil applications.
The adoption of automated and software-enhanced analyzers has reduced manual handling and increased throughput, further supporting the segment's growth With rising global energy demand and stricter regulatory frameworks on fuel quality, the use of vapor pressure analyzers in fuel oil applications is expected to remain a critical driver of the market, supporting both operational optimization and environmental compliance.
| Country | CAGR |
|---|---|
| China | 4.1% |
| India | 3.8% |
| Germany | 3.5% |
| France | 3.2% |
| UK | 2.9% |
| USA | 2.6% |
| Brazil | 2.3% |
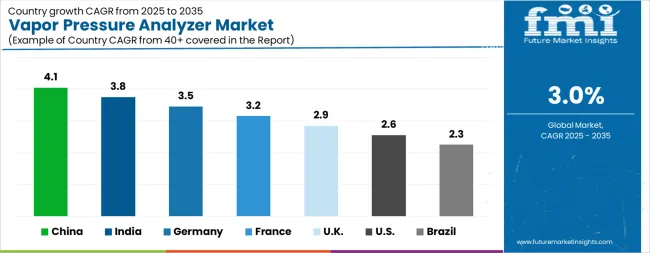
The Vapor Pressure Analyzer Market is expected to register a CAGR of 3.0% during the forecast period, exhibiting varied country level momentum. China leads with the highest CAGR of 4.1%, followed by India at 3.8%. Developed markets such as Germany, France, and the UK continue to expand steadily, while the USA is likely to grow at consistent rates. Brazil posts the lowest CAGR at 2.3%, yet still underscores a broadly positive trajectory for the global Vapor Pressure Analyzer Market. In 2024, Germany held a dominant revenue in the Western Europe market and is expected to grow with a CAGR of 3.5%. The USA Vapor Pressure Analyzer Market is estimated to be valued at USD 23.1 million in 2025 and is anticipated to reach a valuation of USD 29.8 million by 2035. Sales are projected to rise at a CAGR of 2.6% over the forecast period between 2025 and 2035. While Japan and South Korea markets are estimated to be valued at USD 3.5 million and USD 1.7 million respectively in 2025.
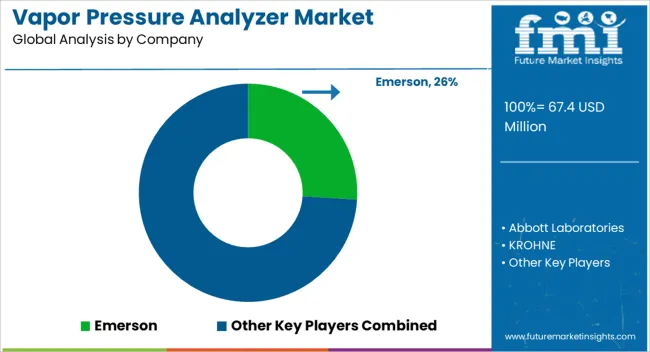
| Item | Value |
|---|---|
| Quantitative Units | USD 67.4 Million |
| Type | Benchtop Vapor Pressure Analyzer and Portable Vapor Pressure Analyzer |
| Applications | Fuel Oil, Liquefied Petroleum Gas, Gasoline, and Naptha’s / Kerosene |
| Regions Covered | North America, Europe, Asia-Pacific, Latin America, Middle East & Africa |
| Country Covered | United States, Canada, Germany, France, United Kingdom, China, Japan, India, Brazil, South Africa |
| Key Companies Profiled | Emerson, Abbott Laboratories, KROHNE, Yokogawa Electric, Teledyne Technologies, Parker Hannifin, Intertek, Siemens, Mettler Toledo, Ametek, and Horiba |
The global vapor pressure analyzer market is estimated to be valued at USD 67.4 million in 2025.
The market size for the vapor pressure analyzer market is projected to reach USD 90.6 million by 2035.
The vapor pressure analyzer market is expected to grow at a 3.0% CAGR between 2025 and 2035.
The key product types in vapor pressure analyzer market are benchtop vapor pressure analyzer and portable vapor pressure analyzer.
In terms of applications, fuel oil segment to command 35.0% share in the vapor pressure analyzer market in 2025.


Our Research Products

The "Full Research Suite" delivers actionable market intel, deep dives on markets or technologies, so clients act faster, cut risk, and unlock growth.

The Leaderboard benchmarks and ranks top vendors, classifying them as Established Leaders, Leading Challengers, or Disruptors & Challengers.

Locates where complements amplify value and substitutes erode it, forecasting net impact by horizon

We deliver granular, decision-grade intel: market sizing, 5-year forecasts, pricing, adoption, usage, revenue, and operational KPIs—plus competitor tracking, regulation, and value chains—across 60 countries broadly.

Spot the shifts before they hit your P&L. We track inflection points, adoption curves, pricing moves, and ecosystem plays to show where demand is heading, why it is changing, and what to do next across high-growth markets and disruptive tech

Real-time reads of user behavior. We track shifting priorities, perceptions of today’s and next-gen services, and provider experience, then pace how fast tech moves from trial to adoption, blending buyer, consumer, and channel inputs with social signals (#WhySwitch, #UX).

Partner with our analyst team to build a custom report designed around your business priorities. From analysing market trends to assessing competitors or crafting bespoke datasets, we tailor insights to your needs.
Supplier Intelligence
Discovery & Profiling
Capacity & Footprint
Performance & Risk
Compliance & Governance
Commercial Readiness
Who Supplies Whom
Scorecards & Shortlists
Playbooks & Docs
Category Intelligence
Definition & Scope
Demand & Use Cases
Cost Drivers
Market Structure
Supply Chain Map
Trade & Policy
Operating Norms
Deliverables
Buyer Intelligence
Account Basics
Spend & Scope
Procurement Model
Vendor Requirements
Terms & Policies
Entry Strategy
Pain Points & Triggers
Outputs
Pricing Analysis
Benchmarks
Trends
Should-Cost
Indexation
Landed Cost
Commercial Terms
Deliverables
Brand Analysis
Positioning & Value Prop
Share & Presence
Customer Evidence
Go-to-Market
Digital & Reputation
Compliance & Trust
KPIs & Gaps
Outputs
Full Research Suite comprises of:
Market outlook & trends analysis
Interviews & case studies
Strategic recommendations
Vendor profiles & capabilities analysis
5-year forecasts
8 regions and 60+ country-level data splits
Market segment data splits
12 months of continuous data updates
DELIVERED AS:
PDF EXCEL ONLINE
Video Extensometer Market Size and Share Forecast Outlook 2025 to 2035
Fluorescence Spectrophotometer Market Size and Share Forecast Outlook 2025 to 2035
Laboratory Grinders Market Size and Share Forecast Outlook 2025 to 2035
Ultrapycnometer Market Size and Share Forecast Outlook 2025 to 2035
Global PP Closure Market Size and Share Forecast Outlook 2025 to 2035
Global Positioning Systems Market Size and Share Forecast Outlook 2025 to 2035
Global Glycidol Market Size and Share Forecast Outlook 2025 to 2035
Global Tert-Amylbenzene Market Size and Share Forecast Outlook 2025 to 2035
Global Sodium Hypochlorite Market Size and Share Forecast Outlook 2025 to 2035
Global Stannic Chloride Market
Global Tyre Inflators Market
Global Wine Tanks Market
Global Bench Scale Market
Global Nutating Mixers Market
Global HVAC Filter Market
Global Nitrite Market
Global Gas Leak Detectors Market
Global Aircraft Brake System Market
Global Loaders Market
Global Optical Comparator Market

Thank you!
You will receive an email from our Business Development Manager. Please be sure to check your SPAM/JUNK folder too.
Chat With
MaRIA