Gourmet Salt Market Size and Share Forecast Outlook 2025 to 2035

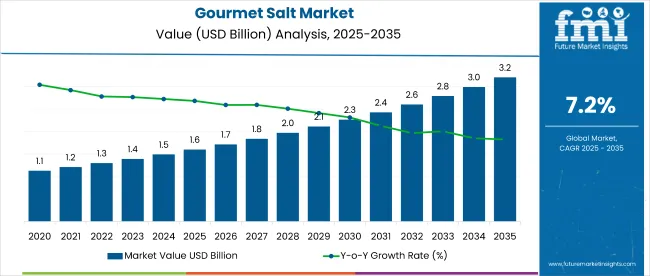
The global gourmet salt market is projected to grow from USD 1.6 billion in 2025 to USD 3.2 billion by 2035, registering a CAGR of 7.2%. This growth is driven by rising consumer demand for premium, natural, and minimally processed food ingredients.
Quick Stats for Gourmet Salt Market

  • Value of Gourmet Salt Market (2025): USD 1.6 billion
  • Projected Value of Gourmet Salt Market (2035): USD 3.2 billion
  • Forecast CAGR of Gourmet Salt Market (2025 to 2035): 7.2%
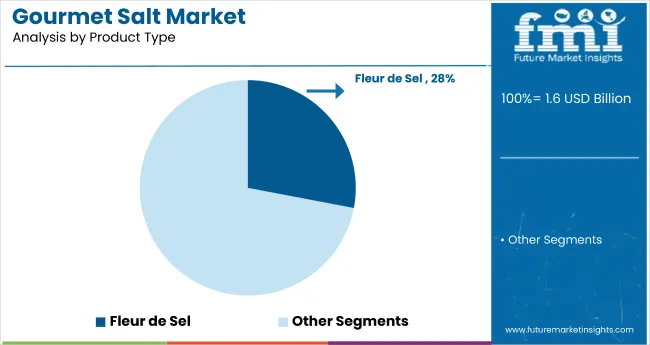
  • Leading Segment by Product Type of Gourmet Salt Market (2025): Fleur de Sel (28% Market Share)
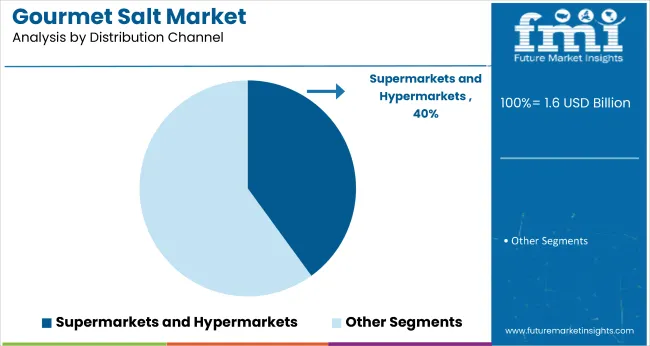
  • Leading Segment by Distribution Channel in Gourmet Salt Market (2025): Supermarkets and Hypermarkets (40% Share)
  • Fastest Growing Country in Gourmet Salt Market (2025): France (7.8% CAGR)
  • Top Key Players in Gourmet Salt Market: Cargill, Incorporated, SaltWorks Inc., Amagansett Sea Salt Co., Murray River, Morton Salt Inc., Alaska Pure Sea Salt Co.

Gourmet Salt Market

Metric Value
Industry Size (2025E) USD 1.6 billion
Industry Value (2035F) USD 3.2 billion
CAGR (2025 to 2035) 7.2%

Increasing awareness about the mineral-rich composition and health benefits of gourmet salts, such as Himalayan pink salt, fleur de sel, and sea salt, is encouraging their adoption in everyday cooking as well as gourmet cuisine.

The market holds 60% share within the global specialty salt market, highlighting its dominance in high-end salt varieties. It accounts for nearly 45% of the premium food ingredients market due to rising demand for natural and minimally processed products. In the natural food additives segment, gourmet salt contributes around 25%, driven by its preservative and flavor-enhancing properties. It holds about 5% share in the overall food flavor enhancer market and 18% in the natural food preservatives segment. However, in the broader food and beverage ingredients market, its share remains modest at below 0.1%.

Government regulations impacting the market emphasize product purity, origin labeling, and additive content. In the United States, the Food and Drug Administration (FDA) regulates food-grade salt under CFR Title 21, ensuring it is free from harmful contaminants. The European Union enforces Regulation (EC) No 1169/2011 for food information and labeling, while Codex Alimentarius standards provide global guidelines for salt quality and iodization. These regulations support the increasing demand for unrefined and additive-free gourmet salts, encouraging producers to invest in quality sourcing, certification, and transparent labeling practices.

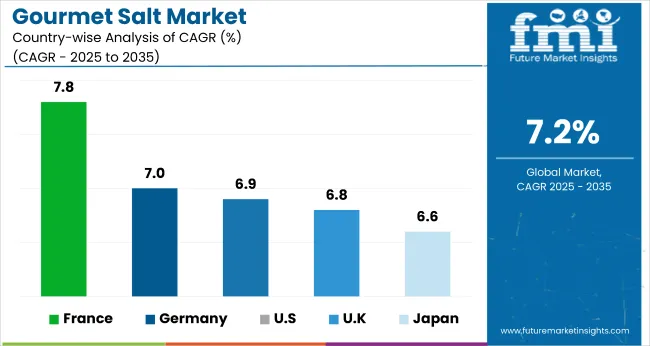
France is projected to be the fastest-growing market, expected to expand at a CAGR of 7.8% from 2025 to 2035. Fleur de Sel will lead the product type segment with a 28% share, while supermarkets and hypermarkets will dominate the distribution channel segment with a 40% share. The USA and Germany markets are also expected to grow steadily at CAGRs of 6.9% and 7.0%, respectively. The UK and Japan are projected to expand at CAGRs of 6.8% and 6.6%, respectively.

Gourmet Salt Market Analysis by Top Investment Segments

The global market is segmented by product type, application, distribution channel, and region. By product type, the market includes coarse salt, flake salt, fleur de sel, Indian black salt, Italian sea salt, selgris sea salt, smoked sea salt, and others (bamboo salt, truffle salt, Hawaiian red salt, and Persian blue salt).

Based on application, the market is segmented into bakery and confectionery, meat and poultry, seafood, sauces and savory, desserts and frozen food, and others (snacks, ready-to-eat meals, beverages, and dairy products).

In terms of distribution channel, the market is classified into B2B (direct sales), B2C (indirect sales), store-based retailing, supermarket/hypermarket, convenience stores, groceries, specialty stores, other retailing formats, and online retailing. Regionally, the market is divided into North America, Latin America, Western Europe, Eastern Europe, Asia Pacific, Japan, and the Middle East and Africa.
Fleur de Sel to Lead the Product Type Segment with 28% Market Share

Gourmet Salt Market Analysis By Product Type

Fleur de Sel is projected to dominate the product type segment with a 28% market share in 2025. Known for its delicate texture and high mineral content, this salt is hand-harvested and used in gourmet dishes and premium culinary applications.
  • Preferred in fine dining and finishing applications.
  • High-value positioning among chefs and artisanal producers.
  • Strong presence in European markets due to origin protection.

Meat and Poultry to Dominate the Application Segment with 27% Market Share

Gourmet Salt Market Analysis By Application

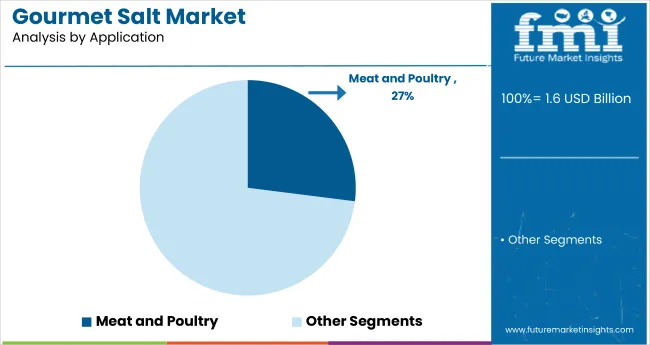
Meat and poultry applications are projected to hold a 27% market share in 2025. Gourmet salts are widely used in this segment for their ability to enhance flavor and serve as natural preservatives, making them ideal for curing, seasoning, and improving the shelf life of processed and artisan meat products.
  • Artisan meat producers are increasingly using gourmet salts for curing and seasoning.
  • Demand for clean-label meat products drives the adoption of natural salts.
  • Its preservative role and flavor depth make it preferred in smoked and processed meats.

Supermarkets and Hypermarkets to Lead Distribution Channel Segment with 40% Market Share

Gourmet Salt Market Analysis By Distribution Channel

Supermarkets and hypermarkets are expected to lead the distribution channel segment with a 40% market share in 2025. Their wide consumer reach, organized shelf displays, and diverse product offerings make them the preferred retail format for purchasing gourmet salts, especially among health-conscious and premium product-seeking customers.

  • Availability of diverse gourmet salt formats supports consumer trial and adoption.
  • Prominent shelf placement boosts product visibility in organized retail environments.
  • In-store promotions and health-driven merchandising increase purchase frequency.

Top Gourmet Salt Market Dynamics

The global gourmet salt market is experiencing steady growth, driven by increasing consumer demand for premium, natural, and minimally processed food ingredients. Gourmet salts enhance flavor, visual appeal, and nutritional value, making them a preferred choice in culinary applications and premium food production.

Recent Trends in the Gourmet Salt Market

  • The growing popularity of clean-label and health-conscious products is boosting demand for unrefined, mineral-rich salts like Himalayan pink salt and fleur de sel.
  • Innovative flavored salts, such as truffle-infused or smoked varieties, are expanding gourmet applications across sauces, meats, and snacks.

Challenges in the Gourmet Salt Market

  • Higher prices compared to regular table salt limit widespread adoption, particularly in cost-sensitive regions and mass-market food production.
  • Inconsistent quality and lack of standardization across artisanal producers pose challenges in maintaining product authenticity and consumer trust.

Top Countries Manufacturing, Importing, Regulating, and Generating Demand for Gourmet Salt

Country Wise Analysis Of Gourmet Salt Market Cagr Analysis By Country

France leads the market among key OECD countries, driven by traditional culinary usage and strong demand for artisanal salts like fleur de sel. Germany and Japan maintain consistent momentum due to EU clean-label mandates and Japan’s alignment with premium culinary trends and functional food innovation.

The European Green Deal continues to support sustainable food production in Germany and France. In contrast, developed economies such as the USA (6.9% CAGR), UK (6.8% CAGR), and France (7.8% CAGR) are expected to growat a steady 0.91-0.96x of the global growth rate.

France shows the strongest growth in the market, supported by deep-rooted culinary traditions and rising demand for premium salts like fleur de sel. Germany follows, with demand fueled by bakery, dairy, and charcuterie applications under strict EU clean-label guidelines. The USA market is expanding steadily, driven by consumer interest in natural and non-GMO salt varieties used in grilling and health foods.

The UK shows stable progress, supported by increased use in bakery and frozen meals despite sourcing challenges. Japan records the slowest growth among these countries, though demand remains resilient due to preferences for mineral-rich salts in traditional cuisine.

The report covers in-depth analysis of 40+ countries, five top-performing OECD countries are highlighted below.

In-depth Analysis of Gourmet Salt Demand in Japan

The Japan gourmet salt market revenue is growing at a CAGR of 6.6% from 2025 to 2035. Growth is driven by consumer preference for authentic and mineral-rich salt varieties in traditional and fusion cuisines. As a high-income OECD market, Japan prioritizes clean-label and premium ingredients across food and beverage segments. While mass-market salt consumption is stable, demand for packaged Himalayan, smoked, and flavored salts is increasing across retail and foodservice channels.

  • High demand in processed seafood, ramen seasoning, and confectionery.
  • Preference for low-sodium, mineral-rich salt varieties.

Growth Outlook for Gourmet Salt in Germany

The sales of gourmet salt in Germany are expected to expandat 7.0% CAGR during the forecast period, close to the global average and heavily regulation led. EU sustainability goals and clean-label compliance are boosting premium salt usage in bakery, cheese, and cured meat applications. Germany emphasizes origin labeling, natural ingredients, and organic certification in gourmet salts. The market aligns closely with European culinary trends and consumer transparency expectations.

  • Strong demand in bakery, charcuterie, and dairy sectors.
  • EU-backed initiatives supporting clean-label ingredient sourcing.

France Gourmet Salt Demand Growth Outlook

The French gourmet salt market is projected to grow at a 7.8% CAGR during the forecast period, outpacing the global average. Growth is driven by traditional usage in culinary dishes and rising demand for high-end food experiences. French cuisine relies on fleur de sel and sea salt for authenticity, and domestic production of specialty salts supports the local market. The segment benefits from government support for artisanal producers and EU promotion of regional food identity.

  • High preference for locally produced fleur de sel and sea salt.
  • Increased demand in fine dining and gourmet meal kits.

Demand Trajectory for Gourmet Salt in the USA

The USA gourmet salt market is projected to grow at 6.9% CAGR from 2025 to 2035, translating to 0.96x the global rate. Demand is fueled by rising consumer interest in natural and unrefined ingredients, especially in premium retail, health food, and restaurant sectors. Himalayan salt, smoked salt, and infused salt blends are gaining popularity in meat rubs, snack seasoning, and sauces. Clean-label trends and non-GMO preferences continue to shape product development and packaging.

  • High demand in grilling, meat processing, and organic food segments.
  • Retailers focusing on variety, origin, and wellness positioning.

Gourmet Salt Trends in the UK

The UK gourmet salt revenue is projected to grow at a CAGR of 6.8% from 2025 to 2035, slightly below the global average at 0.94 times the global pace. Growth is supported by consumer focus on health, origin traceability, and reduced sodium options. Post-Brexit import adjustments have affected sourcing, but local distribution networks remain strong. Increasing demand for sea salt and flavored salts across bakery and frozen meals sustains volume growth.
  • Growing usage in frozen foods, bakery, and gourmet ready meals.
  • Sourcing diversification amid changing import regulations.

Leading Gourmet Salt Suppliers and Manufacturers

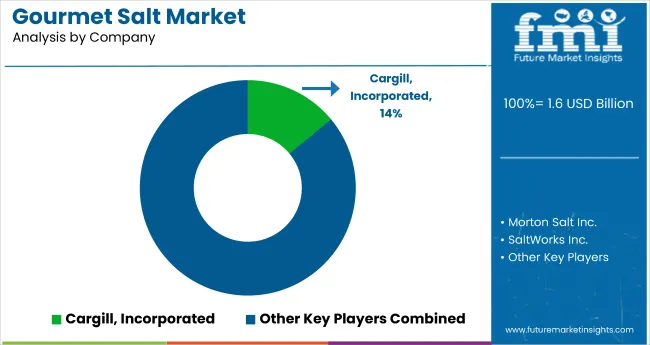
Gourmet Salt Market Analysis By Company

The global market is moderately fragmented, with key players such as Cargill, Incorporated, SaltWorks Inc., Amagansett Sea Salt Co., Murray River, and Morton Salt Inc. leading the industry. These companies offer a diverse range of premium salts tailored for culinary excellence, health-conscious consumers, and artisanal applications. Cargill, Incorporated focuses on large-scale natural salt production with sustainability in mind, while SaltWorks Inc. specializes in handcrafted, flavored, and mineral-rich gourmet salts.

Amagansett Sea Salt Co. and Alaska Pure Sea Salt Co. are known for small-batch, solar-evaporated sea salts, catering to niche gourmet markets. Morton Salt Inc. and Maldon Crystal Salt Company Limited maintain strong retail distribution networks and offer widely recognized gourmet salt brands. Other notable players such as Saltopia Artisan Infused Sea Salts, SüdwestdeutscheSalzwerke AG, SeaSalt Superstore LLC, The Savory Pantry, and The Meadow (Bitterman and Sons, Inc.) contribute by offering unique infusions, region-specific salts, and premium culinary-grade salt varieties.

Recent Gourmet Salt Industry News

  • In April 2024, Maldon Crystal Salt Company announced the expansion of its premium salt flake production facility in Essex, UK, to meet rising international demand. The move supports sustainability goals and enhances the availability of its iconic hand-harvested salt in North America and Europe.

Gourmet Salt Market Report Scope

Report Attributes Details
Market Size (2025) USD 1.6 billion
Projected Market Size (2035) USD 3.2 billion
CAGR (2025 to 2035) 7.2%
Base Year for Estimation 2024
Historical Period 2020 to 2024
Projections Period 2025 to 2035
Report Parameter USD billion for value/volume in metric tons
Product Types Analyzed Coarse Salt, Flake Salt, Fleur de Sel, Indian Black Salt, Italian Sea Salt, Sel Gris Sea Salt, Smoked Sea Salt, others (bamboo salt, truffle salt, Hawaiian red salt, and Persian blue salt)
Applications Analyzed Bakery & Confectionery, Meat & Poultry, Seafood, Sauces & Savory, Desserts & Frozen Food, others (snacks, ready-to-eat meals, beverages, and dairy products) .
Distribution Channels Analyzed B2B (Direct Sales), B2C (Indirect Sales), Store-based Retailing, Supermarket/Hypermarket, Convenience Stores, Groceries, Specialty Stores, Other Retailing Formats, Online Retailing
Regions Covered North America, Latin America, Western Europe, South Asia, East Asia, Eastern Europe, Middle East & Africa
Countries Covered United States, United Kingdom, Germany, France, Japan, China, India, Brazil, South Korea, Australia and 40+ countries
Key Players Influencing the Market Cargill, Incorporated, SaltWorks Inc., Amagansett Sea Salt Co., Murray River, Morton Salt Inc., Alaska Pure Sea Salt Co., Maldon Crystal Salt Company Limited, Saltopia Artisan Infused Sea Salts, Südwestdeutsche Salzwerke AG, SeaSalt Superstore LLC, The Savory Pantry, Evolution Salt Co., INFOSA, Salty Wahine Gourmet Hawaiian Sea Salts LLC, The Meadow (Bitterman and Sons, Inc.)
Additional Attributes Dollar sales by salt type, share by distribution channel, regional consumption trends, clean-label influence, artisanal product launches, competitive benchmarking

Key Segmentation

By Product Type:

  • Coarse salt
  • Flake Salt
  • Fleur de Sel
  • Indian Black Salt
  • Italian Sea Salt
  • Sel Griss Sea Salt
  • Smoked Sea Salt
  • Others

By Application:

  • Bakery & Confectionery
  • Meat & Poultry
  • Seafood
  • Sauces & Savory
  • Desserts & Frozen Food
  • Others

By Distribution Channel:

  • B2B (Direct Sales)
  • B2C (Indirect Sales)
  • Store-based Retailing
  • Supermarket/Hypermarket
  • Convenience Stores
  • Groceries
  • Speciality Stores
  • Other Retailing Formats
  • Online Retailing

By Region:

  • North America
    • USA and Canada
  • Latin America
    • Mexico, Brazil, Peru, Chile, and others
  • Western Europe
    • Germany, United Kingdom, France, Spain, Italy, Nordic countries, Belgium, Netherlands, and Luxembourg
  • Eastern Europe
    • Poland and Russia
  • Asia Pacific
    • China, India, Japan, ASEAN, Australia, and New Zealand
  • The Middle East and Africa
    • GCC, Southern Africa, and North Africa

Table of Content

  1. Executive Summary
    • Global Market Outlook
    • Demand-side Trends
    • Supply-side Trends
    • Technology Roadmap Analysis
    • Analysis and Recommendations
  2. Market Overview
    • Market Coverage / Taxonomy
    • Market Definition / Scope / Limitations
  3. Market Background
    • Market Dynamics
      • Drivers
      • Restraints
      • Opportunity
      • Trends
    • Scenario Forecast
      • Demand in Optimistic Scenario
      • Demand in Likely Scenario
      • Demand in Conservative Scenario
    • Opportunity Map Analysis
    • Product Life Cycle Analysis
    • Supply Chain Analysis
      • Supply Side Participants and their Roles
        • Producers
        • Mid-Level Participants (Traders/ Agents/ Brokers)
        • Wholesalers and Distributors
      • Value Added and Value Created at Node in the Supply Chain
      • List of Raw Material Suppliers
      • List of Existing and Potential Buyer’s
    • Investment Feasibility Matrix
    • Value Chain Analysis
      • Profit Margin Analysis
      • Wholesalers and Distributors
      • Retailers
    • PESTLE and Porter’s Analysis
    • Regulatory Landscape
      • By Key Regions
      • By Key Countries
    • Regional Parent Market Outlook
    • Production and Consumption Statistics
    • Import and Export Statistics
  4. Global Market Analysis 2020 to 2024 and Forecast, 2025 to 2035
    • Historical Market Size Value (USD Billion) & Volume (Metric Tons) Analysis, 2020 to 2024
    • Current and Future Market Size Value (USD Billion) & Volume (Metric Tons) Projections, 2025 to 2035
      • Y-o-Y Growth Trend Analysis
      • Absolute $ Opportunity Analysis
  5. Global Market Pricing Analysis 2020 to 2024 and Forecast 2025 to 2035
  6. Global Market Analysis 2020 to 2024 and Forecast 2025 to 2035, By Product Type
    • Introduction / Key Findings
    • Historical Market Size Value (USD Billion) & Volume (Metric Tons) Analysis By Product Type, 2020 to 2024
    • Current and Future Market Size Value (USD Billion) & Volume (Metric Tons) Analysis and Forecast By Product Type, 2025 to 2035
      • Coarse Salt
      • Flake Salt
      • Fleur de Sel
      • Indian Black Salt
      • Italian Sea Salt
      • Sel Griss Sea Salt
      • Smoked Sea Salt
      • Others (Bamboo Salt, Truffle Salt, Hawaiian Red Salt, Persian Blue Salt)
    • Y-o-Y Growth Trend Analysis By Product Type, 2020 to 2024
    • Absolute $ Opportunity Analysis By Product Type, 2025 to 2035
  7. Global Market Analysis 2020 to 2024 and Forecast 2025 to 2035, By Application
    • Introduction / Key Findings
    • Historical Market Size Value (USD Billion) & Volume (Metric Tons) Analysis By Application, 2020 to 2024
    • Current and Future Market Size Value (USD Billion) & Volume (Metric Tons) Analysis and Forecast By Application, 2025 to 2035
      • Bakery & Confectionery
      • Meat & Poultry
      • Seafood
      • Sauces & Savory
      • Desserts & Frozen Food
      • Others (Snacks, Ready-To-Eat Meals, Beverages, Dairy Products)
    • Y-o-Y Growth Trend Analysis By Application, 2020 to 2024
    • Absolute $ Opportunity Analysis By Application, 2025 to 2035
  8. Global Market Analysis 2020 to 2024 and Forecast 2025 to 2035, By Distribution Channel
    • Introduction / Key Findings
    • Historical Market Size Value (USD Billion) & Volume (Metric Tons) Analysis By Distribution Channel, 2020 to 2024
    • Current and Future Market Size Value (USD Billion) & Volume (Metric Tons) Analysis and Forecast By Distribution Channel, 2025 to 2035
      • B2B (Direct Sales)
      • B2C (Indirect Sales)
      • Store-based Retailing
      • Supermarket/Hypermarket
      • Convenience Stores
      • Groceries
      • Specialty Stores
      • Other Retailing Formats
      • Online Retailing
    • Y-o-Y Growth Trend Analysis By Distribution Channel, 2020 to 2024
    • Absolute $ Opportunity Analysis By Distribution Channel, 2025 to 2035
  9. Global Market Analysis 2020 to 2024 and Forecast 2025 to 2035, By Region
    • Introduction
    • Historical Market Size Value (USD Billion) & Volume (Metric Tons) Analysis By Region, 2020 to 2024
    • Current Market Size Value (USD Billion) & Volume (Metric Tons) Analysis and Forecast By Region, 2025 to 2035
      • North America
      • Latin America
      • Western Europe
      • Eastern Europe
      • East Asia
      • South Asia & Pacific
      • Middle East and Africa
    • Market Attractiveness Analysis By Region
  10. North America Market Analysis 2020 to 2024 and Forecast 2025 to 2035, By Country
    • Historical Market Size Value (USD Billion) & Volume (Metric Tons) Trend Analysis By Market Taxonomy, 2020 to 2024
    • Market Size Value (USD Billion) & Volume (Metric Tons) Forecast By Market Taxonomy, 2025 to 2035
      • By Country
        • USA
        • Canada
        • Mexico
      • By Product Type
      • By Application
      • By Distribution Channel
    • Market Attractiveness Analysis
      • By Country
      • By Product Type
      • By Application
      • By Distribution Channel
    • Key Takeaways
  11. Latin America Market Analysis 2020 to 2024 and Forecast 2025 to 2035, By Country
    • Historical Market Size Value (USD Billion) & Volume (Metric Tons) Trend Analysis By Market Taxonomy, 2020 to 2024
    • Market Size Value (USD Billion) & Volume (Metric Tons) Forecast By Market Taxonomy, 2025 to 2035
      • By Country
        • Brazil
        • Argentina
        • Rest of LATAM
      • By Product Type
      • By Application
      • By Distribution Channel
    • Market Attractiveness Analysis
      • By Country
      • By Product Type
      • By Application
      • By Distribution Channel
    • Key Takeaways
  12. Western Europe Market Analysis 2020 to 2024 and Forecast 2025 to 2035, By Country
    • Historical Market Size Value (USD Billion) & Volume (Metric Tons) Trend Analysis By Market Taxonomy, 2020 to 2024
    • Market Size Value (USD Billion) & Volume (Metric Tons) Forecast By Market Taxonomy, 2025 to 2035
      • By Country
        • Germany
        • Italy
        • France
        • UK
        • Spain
        • BENELUX
        • Nordic
        • Rest of W.Europe
      • By Product Type
      • By Application
      • By Distribution Channel
    • Market Attractiveness Analysis
      • By Country
      • By Product Type
      • By Application
      • By Distribution Channel
    • Key Takeaways
  13. Eastern Europe Market Analysis 2020 to 2024 and Forecast 2025 to 2035, By Country
    • Historical Market Size Value (USD Billion) & Volume (Metric Tons) Trend Analysis By Market Taxonomy, 2020 to 2024
    • Market Size Value (USD Billion) & Volume (Metric Tons) Forecast By Market Taxonomy, 2025 to 2035
      • By Country
        • Russia
        • Hungary
        • Poland
        • Balkan & Baltics
        • Rest of E. Europe
      • By Product Type
      • By Application
      • By Distribution Channel
    • Market Attractiveness Analysis
      • By Country
      • By Product Type
      • By Application
      • By Distribution Channel
    • Key Takeaways
  14. East Asia Market Analysis 2020 to 2024 and Forecast 2025 to 2035, By Country
    • Historical Market Size Value (USD Billion) & Volume (Metric Tons) Trend Analysis By Market Taxonomy, 2020 to 2024
    • Market Size Value (USD Billion) & Volume (Metric Tons) Forecast By Market Taxonomy, 2025 to 2035
      • By Country
        • China
        • Japan
        • South Korea
      • By Product Type
      • By Application
      • By Distribution Channel
    • Market Attractiveness Analysis
      • By Country
      • By Product Type
      • By Application
      • By Distribution Channel
    • Key Takeaways
  15. South Asia & Pacific Market Analysis 2020 to 2024 and Forecast 2025 to 2035, By Country
    • Historical Market Size Value (USD Billion) & Volume (Metric Tons) Trend Analysis By Market Taxonomy, 2020 to 2024
    • Market Size Value (USD Billion) & Volume (Metric Tons) Forecast By Market Taxonomy, 2025 to 2035
      • By Country
        • India
        • Australia & New Zealand
        • ASEAN
        • Rest of SAP
      • By Product Type
      • By Application
      • By Distribution Channel
    • Market Attractiveness Analysis
      • By Country
      • By Product Type
      • By Application
      • By Distribution Channel
    • Key Takeaways
  16. Middle East and Africa Market Analysis 2020 to 2024 and Forecast 2025 to 2035, By Country
    • Historical Market Size Value (USD Billion) & Volume (Metric Tons) Trend Analysis By Market Taxonomy, 2020 to 2024
    • Market Size Value (USD Billion) & Volume (Metric Tons) Forecast By Market Taxonomy, 2025 to 2035
      • By Country
        • GCC Countries
        • Northern Africa
        • South Africa
        • Turkiye
        • Rest of MEA
      • By Product Type
      • By Application
      • By Distribution Channel
    • Market Attractiveness Analysis
      • By Country
      • By Product Type
      • By Application
      • By Distribution Channel
    • Key Takeaways
  17. Key Countries Market Analysis
    • USA
      • Pricing Analysis
      • Market Share Analysis, 2024
        • By Product Type
        • By Application
        • By Distribution Channel
    • Canada
      • Pricing Analysis
      • Market Share Analysis, 2024
        • By Product Type
        • By Application
        • By Distribution Channel
    • Brazil
      • Pricing Analysis
      • Market Share Analysis, 2024
        • By Product Type
        • By Application
        • By Distribution Channel
    • Mexico
      • Pricing Analysis
      • Market Share Analysis, 2024
        • By Product Type
        • By Application
        • By Distribution Channel
    • Argentina
      • Pricing Analysis
      • Market Share Analysis, 2024
        • By Product Type
        • By Application
        • By Distribution Channel
  18. Market Structure Analysis
    • Competition Dashboard
    • Competition Benchmarking
    • Market Share Analysis of Top Players
      • By Regional
      • By Product Type
      • By Application
      • By Distribution Channel
  19. Competition Analysis
    • Competition Deep Dive
      • Cargill, Incorporated
        • Overview
        • Product Portfolio
        • Profitability by Market Segments (Product/Age /Sales Channel/Region)
        • Sales Footprint
        • Strategy Overview
          • Marketing Strategy
          • Product Strategy
          • Channel Strategy
      • SaltWorks Inc.
        • Overview
        • Product Portfolio
        • Profitability by Market Segments (Product/Age /Sales Channel/Region)
        • Sales Footprint
        • Strategy Overview
          • Marketing Strategy
          • Product Strategy
          • Channel Strategy
      • Amagansett Sea Salt Co.
        • Overview
        • Product Portfolio
        • Profitability by Market Segments (Product/Age /Sales Channel/Region)
        • Sales Footprint
        • Strategy Overview
          • Marketing Strategy
          • Product Strategy
          • Channel Strategy
      • Murray River
        • Overview
        • Product Portfolio
        • Profitability by Market Segments (Product/Age /Sales Channel/Region)
        • Sales Footprint
        • Strategy Overview
          • Marketing Strategy
          • Product Strategy
          • Channel Strategy
      • Morton Salt Inc.
        • Overview
        • Product Portfolio
        • Profitability by Market Segments (Product/Age /Sales Channel/Region)
        • Sales Footprint
        • Strategy Overview
          • Marketing Strategy
          • Product Strategy
          • Channel Strategy
      • Alaska Pure Sea Salt Co.
        • Overview
        • Product Portfolio
        • Profitability by Market Segments (Product/Age /Sales Channel/Region)
        • Sales Footprint
        • Strategy Overview
          • Marketing Strategy
          • Product Strategy
          • Channel Strategy
      • Maldon Crystal Salt Company Limited
        • Overview
        • Product Portfolio
        • Profitability by Market Segments (Product/Age /Sales Channel/Region)
        • Sales Footprint
        • Strategy Overview
          • Marketing Strategy
          • Product Strategy
          • Channel Strategy
      • Saltopia Artisan Infused Sea Salts
        • Overview
        • Product Portfolio
        • Profitability by Market Segments (Product/Age /Sales Channel/Region)
        • Sales Footprint
        • Strategy Overview
          • Marketing Strategy
          • Product Strategy
          • Channel Strategy
      • Südwestdeutsche Salzwerke AG
        • Overview
        • Product Portfolio
        • Profitability by Market Segments (Product/Age /Sales Channel/Region)
        • Sales Footprint
        • Strategy Overview
          • Marketing Strategy
          • Product Strategy
          • Channel Strategy
      • SeaSalt Superstore LLC
        • Overview
        • Product Portfolio
        • Profitability by Market Segments (Product/Age /Sales Channel/Region)
        • Sales Footprint
        • Strategy Overview
          • Marketing Strategy
          • Product Strategy
          • Channel Strategy
      • The Savory Pantry
        • Overview
        • Product Portfolio
        • Profitability by Market Segments (Product/Age /Sales Channel/Region)
        • Sales Footprint
        • Strategy Overview
          • Marketing Strategy
          • Product Strategy
          • Channel Strategy
      • Evolution Salt Co.
        • Overview
        • Product Portfolio
        • Profitability by Market Segments (Product/Age /Sales Channel/Region)
        • Sales Footprint
        • Strategy Overview
          • Marketing Strategy
          • Product Strategy
          • Channel Strategy
      • INFOSA
        • Overview
        • Product Portfolio
        • Profitability by Market Segments (Product/Age /Sales Channel/Region)
        • Sales Footprint
        • Strategy Overview
          • Marketing Strategy
          • Product Strategy
          • Channel Strategy
      • Salty Wahine Gourmet Hawaiian Sea Salts LLC
        • Overview
        • Product Portfolio
        • Profitability by Market Segments (Product/Age /Sales Channel/Region)
        • Sales Footprint
        • Strategy Overview
          • Marketing Strategy
          • Product Strategy
          • Channel Strategy
      • The Meadow (Bitterman and Sons, Inc.)
        • Overview
        • Product Portfolio
        • Profitability by Market Segments (Product/Age /Sales Channel/Region)
        • Sales Footprint
        • Strategy Overview
          • Marketing Strategy
          • Product Strategy
          • Channel Strategy
  20. Assumptions & Acronyms Used
  21. Research Methodology

List of Tables

  • Table 1: Global Market Value (USD Billion) Forecast by Region, 2020-2035
  • Table 2: Global Market Volume (Metric Tons) Forecast by Region, 2020-2035
  • Table 3: Global Market Value (USD Billion) Forecast by Product Type, 2020-2035
  • Table 4: Global Market Volume (Metric Tons) Forecast by Product Type, 2020-2035
  • Table 5: Global Market Value (USD Billion) Forecast by Application, 2020-2035
  • Table 6: Global Market Volume (Metric Tons) Forecast by Application, 2020-2035
  • Table 7: Global Market Value (USD Billion) Forecast by Distribution Channel, 2020-2035
  • Table 8: Global Market Volume (Metric Tons) Forecast by Distribution Channel, 2020-2035
  • Table 9: North America Market Value (USD Billion) Forecast by Country, 2020-2035
  • Table 10: North America Market Volume (Metric Tons) Forecast by Country, 2020-2035
  • Table 11: North America Market Value (USD Billion) Forecast by Product Type, 2020-2035
  • Table 12: North America Market Volume (Metric Tons) Forecast by Product Type, 2020-2035
  • Table 13: North America Market Value (USD Billion) Forecast by Application, 2020-2035
  • Table 14: North America Market Volume (Metric Tons) Forecast by Application, 2020-2035
  • Table 15: North America Market Value (USD Billion) Forecast by Distribution Channel, 2020-2035
  • Table 16: North America Market Volume (Metric Tons) Forecast by Distribution Channel, 2020-2035
  • Table 17: Latin America Market Value (USD Billion) Forecast by Country, 2020-2035
  • Table 18: Latin America Market Volume (Metric Tons) Forecast by Country, 2020-2035
  • Table 19: Latin America Market Value (USD Billion) Forecast by Product Type, 2020-2035
  • Table 20: Latin America Market Volume (Metric Tons) Forecast by Product Type, 2020-2035
  • Table 21: Latin America Market Value (USD Billion) Forecast by Application, 2020-2035
  • Table 22: Latin America Market Volume (Metric Tons) Forecast by Application, 2020-2035
  • Table 23: Latin America Market Value (USD Billion) Forecast by Distribution Channel, 2020-2035
  • Table 24: Latin America Market Volume (Metric Tons) Forecast by Distribution Channel, 2020-2035
  • Table 25: Western Europe Market Value (USD Billion) Forecast by Country, 2020-2035
  • Table 26: Western Europe Market Volume (Metric Tons) Forecast by Country, 2020-2035
  • Table 27: Western Europe Market Value (USD Billion) Forecast by Product Type, 2020-2035
  • Table 28: Western Europe Market Volume (Metric Tons) Forecast by Product Type, 2020-2035
  • Table 29: Western Europe Market Value (USD Billion) Forecast by Application, 2020-2035
  • Table 30: Western Europe Market Volume (Metric Tons) Forecast by Application, 2020-2035
  • Table 31: Western Europe Market Value (USD Billion) Forecast by Distribution Channel, 2020-2035
  • Table 32: Western Europe Market Volume (Metric Tons) Forecast by Distribution Channel, 2020-2035
  • Table 33: Eastern Europe Market Value (USD Billion) Forecast by Country, 2020-2035
  • Table 34: Eastern Europe Market Volume (Metric Tons) Forecast by Country, 2020-2035
  • Table 35: Eastern Europe Market Value (USD Billion) Forecast by Product Type, 2020-2035
  • Table 36: Eastern Europe Market Volume (Metric Tons) Forecast by Product Type, 2020-2035
  • Table 37: Eastern Europe Market Value (USD Billion) Forecast by Application, 2020-2035
  • Table 38: Eastern Europe Market Volume (Metric Tons) Forecast by Application, 2020-2035
  • Table 39: Eastern Europe Market Value (USD Billion) Forecast by Distribution Channel, 2020-2035
  • Table 40: Eastern Europe Market Volume (Metric Tons) Forecast by Distribution Channel, 2020-2035
  • Table 41: East Asia Market Value (USD Billion) Forecast by Country, 2020-2035
  • Table 42: East Asia Market Volume (Metric Tons) Forecast by Country, 2020-2035
  • Table 43: East Asia Market Value (USD Billion) Forecast by Product Type, 2020-2035
  • Table 44: East Asia Market Volume (Metric Tons) Forecast by Product Type, 2020-2035
  • Table 45: East Asia Market Value (USD Billion) Forecast by Application, 2020-2035
  • Table 46: East Asia Market Volume (Metric Tons) Forecast by Application, 2020-2035
  • Table 47: East Asia Market Value (USD Billion) Forecast by Distribution Channel, 2020-2035
  • Table 48: East Asia Market Volume (Metric Tons) Forecast by Distribution Channel, 2020-2035
  • Table 49: South Asia & Pacific Market Value (USD Billion) Forecast by Country, 2020-2035
  • Table 50: South Asia & Pacific Market Volume (Metric Tons) Forecast by Country, 2020-2035
  • Table 51: South Asia & Pacific Market Value (USD Billion) Forecast by Product Type, 2020-2035
  • Table 52: South Asia & Pacific Market Volume (Metric Tons) Forecast by Product Type, 2020-2035
  • Table 53: South Asia & Pacific Market Value (USD Billion) Forecast by Application, 2020-2035
  • Table 54: South Asia & Pacific Market Volume (Metric Tons) Forecast by Application, 2020-2035
  • Table 55: South Asia & Pacific Market Value (USD Billion) Forecast by Distribution Channel, 2020-2035
  • Table 56: South Asia & Pacific Market Volume (Metric Tons) Forecast by Distribution Channel, 2020-2035
  • Table 57: Middle East and Africa Market Value (USD Billion) Forecast by Country, 2020-2035
  • Table 58: Middle East and Africa Market Volume (Metric Tons) Forecast by Country, 2020-2035
  • Table 59: Middle East and Africa Market Value (USD Billion) Forecast by Product Type, 2020-2035
  • Table 60: Middle East and Africa Market Volume (Metric Tons) Forecast by Product Type, 2020-2035
  • Table 61: Middle East and Africa Market Value (USD Billion) Forecast by Application, 2020-2035
  • Table 62: Middle East and Africa Market Volume (Metric Tons) Forecast by Application, 2020-2035
  • Table 63: Middle East and Africa Market Value (USD Billion) Forecast by Distribution Channel, 2020-2035
  • Table 64: Middle East and Africa Market Volume (Metric Tons) Forecast by Distribution Channel, 2020-2035

List of Figures

  • Figure 1: Global Market Volume (Metric Tons) Forecast 2020-2035
  • Figure 2: Global Market Pricing Analysis
  • Figure 3: Global Market Value (USD Billion) Forecast 2020-2035
  • Figure 4: Global Market Value Share and BPS Analysis by Product Type, 2025 and 2035
  • Figure 5: Global Market Y-o-Y Growth Comparison by Product Type, 2025-2035
  • Figure 6: Global Market Attractiveness Analysis by Product Type
  • Figure 7: Global Market Value Share and BPS Analysis by Application, 2025 and 2035
  • Figure 8: Global Market Y-o-Y Growth Comparison by Application, 2025-2035
  • Figure 9: Global Market Attractiveness Analysis by Application
  • Figure 10: Global Market Value Share and BPS Analysis by Distribution Channel, 2025 and 2035
  • Figure 11: Global Market Y-o-Y Growth Comparison by Distribution Channel, 2025-2035
  • Figure 12: Global Market Attractiveness Analysis by Distribution Channel
  • Figure 13: Global Market Value (USD Billion) Share and BPS Analysis by Region, 2025 and 2035
  • Figure 14: Global Market Y-o-Y Growth Comparison by Region, 2025-2035
  • Figure 15: Global Market Attractiveness Analysis by Region
  • Figure 16: North America Market Incremental $ Opportunity, 2025-2035
  • Figure 17: Latin America Market Incremental $ Opportunity, 2025-2035
  • Figure 18: Western Europe Market Incremental $ Opportunity, 2025-2035
  • Figure 19: Eastern Europe Market Incremental $ Opportunity, 2025-2035
  • Figure 20: East Asia Market Incremental $ Opportunity, 2025-2035
  • Figure 21: South Asia & Pacific Market Incremental $ Opportunity, 2025-2035
  • Figure 22: Middle East and Africa Market Incremental $ Opportunity, 2025-2035
  • Figure 23: North America Market Value Share and BPS Analysis by Country, 2025 and 2035
  • Figure 24: North America Market Value Share and BPS Analysis by Product Type, 2025 and 2035
  • Figure 25: North America Market Y-o-Y Growth Comparison by Product Type, 2025-2035
  • Figure 26: North America Market Attractiveness Analysis by Product Type
  • Figure 27: North America Market Value Share and BPS Analysis by Application, 2025 and 2035
  • Figure 28: North America Market Y-o-Y Growth Comparison by Application, 2025-2035
  • Figure 29: North America Market Attractiveness Analysis by Application
  • Figure 30: North America Market Value Share and BPS Analysis by Distribution Channel, 2025 and 2035
  • Figure 31: North America Market Y-o-Y Growth Comparison by Distribution Channel, 2025-2035
  • Figure 32: North America Market Attractiveness Analysis by Distribution Channel
  • Figure 33: Latin America Market Value Share and BPS Analysis by Country, 2025 and 2035
  • Figure 34: Latin America Market Value Share and BPS Analysis by Product Type, 2025 and 2035
  • Figure 35: Latin America Market Y-o-Y Growth Comparison by Product Type, 2025-2035
  • Figure 36: Latin America Market Attractiveness Analysis by Product Type
  • Figure 37: Latin America Market Value Share and BPS Analysis by Application, 2025 and 2035
  • Figure 38: Latin America Market Y-o-Y Growth Comparison by Application, 2025-2035
  • Figure 39: Latin America Market Attractiveness Analysis by Application
  • Figure 40: Latin America Market Value Share and BPS Analysis by Distribution Channel, 2025 and 2035
  • Figure 41: Latin America Market Y-o-Y Growth Comparison by Distribution Channel, 2025-2035
  • Figure 42: Latin America Market Attractiveness Analysis by Distribution Channel
  • Figure 43: Western Europe Market Value Share and BPS Analysis by Country, 2025 and 2035
  • Figure 44: Western Europe Market Value Share and BPS Analysis by Product Type, 2025 and 2035
  • Figure 45: Western Europe Market Y-o-Y Growth Comparison by Product Type, 2025-2035
  • Figure 46: Western Europe Market Attractiveness Analysis by Product Type
  • Figure 47: Western Europe Market Value Share and BPS Analysis by Application, 2025 and 2035
  • Figure 48: Western Europe Market Y-o-Y Growth Comparison by Application, 2025-2035
  • Figure 49: Western Europe Market Attractiveness Analysis by Application
  • Figure 50: Western Europe Market Value Share and BPS Analysis by Distribution Channel, 2025 and 2035
  • Figure 51: Western Europe Market Y-o-Y Growth Comparison by Distribution Channel, 2025-2035
  • Figure 52: Western Europe Market Attractiveness Analysis by Distribution Channel
  • Figure 53: Eastern Europe Market Value Share and BPS Analysis by Country, 2025 and 2035
  • Figure 54: Eastern Europe Market Value Share and BPS Analysis by Product Type, 2025 and 2035
  • Figure 55: Eastern Europe Market Y-o-Y Growth Comparison by Product Type, 2025-2035
  • Figure 56: Eastern Europe Market Attractiveness Analysis by Product Type
  • Figure 57: Eastern Europe Market Value Share and BPS Analysis by Application, 2025 and 2035
  • Figure 58: Eastern Europe Market Y-o-Y Growth Comparison by Application, 2025-2035
  • Figure 59: Eastern Europe Market Attractiveness Analysis by Application
  • Figure 60: Eastern Europe Market Value Share and BPS Analysis by Distribution Channel, 2025 and 2035
  • Figure 61: Eastern Europe Market Y-o-Y Growth Comparison by Distribution Channel, 2025-2035
  • Figure 62: Eastern Europe Market Attractiveness Analysis by Distribution Channel
  • Figure 63: East Asia Market Value Share and BPS Analysis by Country, 2025 and 2035
  • Figure 64: East Asia Market Value Share and BPS Analysis by Product Type, 2025 and 2035
  • Figure 65: East Asia Market Y-o-Y Growth Comparison by Product Type, 2025-2035
  • Figure 66: East Asia Market Attractiveness Analysis by Product Type
  • Figure 67: East Asia Market Value Share and BPS Analysis by Application, 2025 and 2035
  • Figure 68: East Asia Market Y-o-Y Growth Comparison by Application, 2025-2035
  • Figure 69: East Asia Market Attractiveness Analysis by Application
  • Figure 70: East Asia Market Value Share and BPS Analysis by Distribution Channel, 2025 and 2035
  • Figure 71: East Asia Market Y-o-Y Growth Comparison by Distribution Channel, 2025-2035
  • Figure 72: East Asia Market Attractiveness Analysis by Distribution Channel
  • Figure 73: South Asia & Pacific Market Value Share and BPS Analysis by Country, 2025 and 2035
  • Figure 74: South Asia & Pacific Market Value Share and BPS Analysis by Product Type, 2025 and 2035
  • Figure 75: South Asia & Pacific Market Y-o-Y Growth Comparison by Product Type, 2025-2035
  • Figure 76: South Asia & Pacific Market Attractiveness Analysis by Product Type
  • Figure 77: South Asia & Pacific Market Value Share and BPS Analysis by Application, 2025 and 2035
  • Figure 78: South Asia & Pacific Market Y-o-Y Growth Comparison by Application, 2025-2035
  • Figure 79: South Asia & Pacific Market Attractiveness Analysis by Application
  • Figure 80: South Asia & Pacific Market Value Share and BPS Analysis by Distribution Channel, 2025 and 2035
  • Figure 81: South Asia & Pacific Market Y-o-Y Growth Comparison by Distribution Channel, 2025-2035
  • Figure 82: South Asia & Pacific Market Attractiveness Analysis by Distribution Channel
  • Figure 83: Middle East and Africa Market Value Share and BPS Analysis by Country, 2025 and 2035
  • Figure 84: Middle East and Africa Market Value Share and BPS Analysis by Product Type, 2025 and 2035
  • Figure 85: Middle East and Africa Market Y-o-Y Growth Comparison by Product Type, 2025-2035
  • Figure 86: Middle East and Africa Market Attractiveness Analysis by Product Type
  • Figure 87: Middle East and Africa Market Value Share and BPS Analysis by Application, 2025 and 2035
  • Figure 88: Middle East and Africa Market Y-o-Y Growth Comparison by Application, 2025-2035
  • Figure 89: Middle East and Africa Market Attractiveness Analysis by Application
  • Figure 90: Middle East and Africa Market Value Share and BPS Analysis by Distribution Channel, 2025 and 2035
  • Figure 91: Middle East and Africa Market Y-o-Y Growth Comparison by Distribution Channel, 2025-2035
  • Figure 92: Middle East and Africa Market Attractiveness Analysis by Distribution Channel
  • Figure 93: Global Market - Tier Structure Analysis
  • Figure 94: Global Market - Company Share Analysis

Frequently Asked Questions

What is the projected size of the gourmet salt market in 2025?

The market is valued at USD 1.6 billion in 2025.

What is the outlook on gourmet salt demand by 2035?

The market is forecasted to reach USD 3.2 billion by 2035, reflecting a CAGR of 7.2%.

Which segment leads the gourmet salt market by product type in 2025?

Fleur de Sel will lead the product type segment, accounting for 28% of the global market share in 2025.

What is the top distribution channel for the gourmet salt market in 2025?

Supermarkets and hypermarkets will dominate the distribution channel segment with a 40% share in 2025.

Which country is projected to have the fastest-growing gourmet salt market?

France is projected to grow at the fastest rate, with a CAGR of 7.8% from 2025 to 2035.

Explore Similar Insights

Future Market Insights

Gourmet Salt Market