

- Market Size (2026)
- USD 15.1 Bn
- Forecast (2036)
- USD 27.0 Bn
- CAGR (2026 to 2036)
- 6.0%
How big is Graphite Market in 2026?
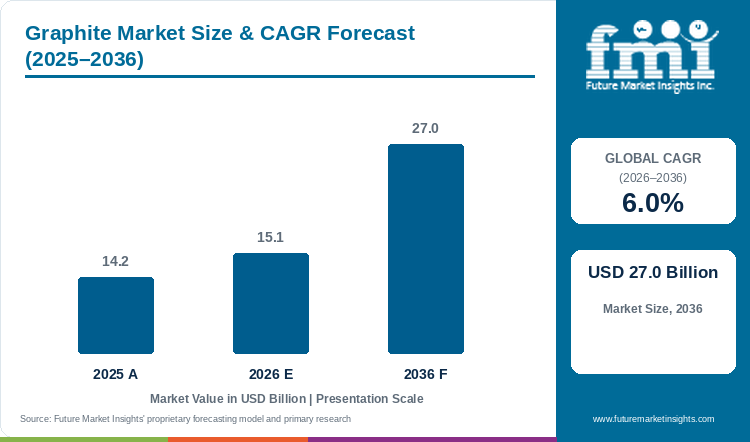
The graphite market is estimated at USD 14.2 billion in 2025 and is forecast to reach USD 15.1 billion in 2026. Sales of graphite are projected to grow at a 6% CAGR and reach USD 27.0 billion by 2036.
Sales of graphite are highest in steelmaking, as arc furnaces consume electrodes and refractories line every ladle. Graphite market size, at an estimated USD 14.2 billion in 2025, is expected to reach USD 15.1 billion in 2026 and USD 27.0 billion by 2036 on a 6% CAGR through 2036. SGL Carbon marked a capacity expansion for high-purity graphite products at St. Marys in the United States in October 2026, mainly for semiconductor makers and small modular reactor developers.[1] High-purity blocks sell at a premium, so tonnage moving to chip and reactor buyers raises sales value ahead of volume.
A heat map of graphite buyers puts steelmakers and battery anode plants in the hot zone. Metallurgy is estimated at 34.6% of 2026 end use sales and automotive and transportation, mostly battery anode material, at 21.3%, and both reorder monthly on long contracts. Electrical and electronics buyers, at 25%, rank warm with smaller high-purity lots. Energy generation, 11.8%, and other users, 7.3%, stay cool and buy by project. NOVONIX signed a memorandum of understanding with ACP Technologies in September 2026 to develop a fully domestic pitch-coated synthetic graphite anode material.[2] FMI estimates that anode and electrode contracts will give suppliers the steadiest volume through 2036, so producers outside Asia will court battery plants first.
Key Market Trends & Insights
- Synthetic graphite is estimated to lead product type with 58.5% in 2026, ahead of natural flake and amorphous graphite at 41.5%. Graphite One said in July 2026 that the United States remains fully import reliant for natural graphite.[3]
- Medium-purity grades of 85% to 95% carbon are expected to hold 43% of purity sales in 2026, with high-purity grades near 38.4% and low-purity grades about 18.6%.
- Steelmakers keep metallurgy first by end use at an estimated 34.6% in 2026, and electrical and electronics buyers follow at 25%. SGL Carbon raised the 2026 EBITDApre forecast to EUR 130 million to EUR 140 million in October 2026.[4]
Regional Highlights
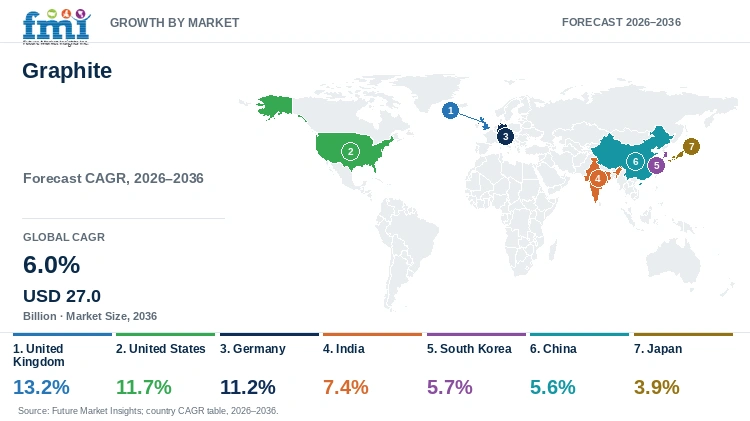
- Gigafactory supply chains give the United Kingdom 13.2% through 2036, ahead of the 6% global CAGR and the top profiled rate.
- The United States, on 11.7%, adds anode and high-purity plants. Germany is projected at 11.2%. India follows at 7.4%. Large existing anode bases hold South Korea at 5.7% and China at 5.6%, a little under the global rate. Japan comes last at 3.9%.
- China added artificial graphite anode materials and related equipment to the national dual-use export control list under Decision No. 58, issued on 9 October 2025.[5]
Market Size & Forecast
Table 1: Market Size and Forecast for the Graphite Market (USD billion and percentage), 2025 to 2036
| Metric | Value |
|---|---|
| 2025 Market Size | USD 14.2 billion |
| Estimated Market Size in 2026 | USD 15.1 billion |
| Projected Market Size by 2036 | USD 27.0 billion |
| CAGR, 2026 to 2036 | 6% |
| Added Revenue, 2026 to 2036 | USD 11.9 billion |
| Market Expansion Multiple | 1.8x |
Demand for graphite arrives through two buying cycles, as steel mills order electrodes against furnace hours and cell plants order anode material against qualified lines. Syrah Resources cited IEA forecasts that demand for graphite will double by 2040 and that China controls more than 90% of battery-grade graphite production and processing capacity.[6] SGL Carbon expects 2026 sales at the upper end of EUR 720 million to EUR 770 million.[4] Anode volume follows cell output, with an 8.5% CAGR through 2036 expected for the electric vehicle battery market. In FMI's estimate, graphite buyers will add USD 11.9 billion of purchases between 2026 and 2036, so the graphite market in 2036 would be about 1.8 times the 2026 base. Export controls on battery-grade material are the main supply risk for anode buyers outside Asia.
Anode Supply, High-Purity Grades and Trade Controls
Anode supply outside Asia is still small. Graphite One expects no delay to a 2029 production start at Graphite Creek in Alaska and is advancing a planned battery materials facility in Ohio.[3] NOVONIX said in September 2026 that there are limited viable US-based alternatives for anode materials.[2] Cell makers in North America will sign early offtakes with these projects to secure qualified supply.
High-purity grades are growing with chip and nuclear buyers. SGL Carbon invested about USD 100 million in St. Marys, which serves mainly the US market.[1] China restricted exports of artificial graphite anode materials, granulation, graphitization and coating equipment and related technology from 8 November 2025 under Decision No. 58.[5] Buyers relying on a single country for battery-grade graphite will add second sources in North America and Europe.
Table 2: Supply, Capacity and Policy Indicators for the Graphite Market (capacity, sales and policy), 2025 to 2026
| Indicator | Data Point | Relevance | Source |
|---|---|---|---|
| SGL Carbon St. Marys expansion, October 2026 | About USD 100 million invested; high-purity graphite | Semiconductor and nuclear demand in the United States | [1] |
| SGL Carbon 9M 2026 sales | About EUR 595 million; EBITDApre about EUR 106 million | Specialty graphite results in Germany | [4] |
| NOVONIX and ACP Technologies MOU, September 2026 | Domestic pitch-coated synthetic graphite anode | US anode supply | [2] |
| Graphite One, July 2026 | 2029 startup at Graphite Creek; US 100% import reliant | Natural graphite supply in the United States | [3] |
| Syrah Resources, July 2026 | IEA sees graphite demand doubling by 2040 | Long-term anode demand | [6] |
| MOFCOM Decision No. 58, October 2025 | Artificial graphite anode export controls from 8 November 2025 | Supply risk for anode buyers | [5] |
| AESC Sunderland, December 2025 | 15.8 GWh initial cell capacity | Anode demand in the United Kingdom | [7] |
Analyst Perspective
“I see battery anode plants in North America and Europe as the fastest-growing graphite buyers of the decade, as carmakers there want a second source next to Asian supply. Producers qualifying synthetic and coated natural grades with those cell makers will be unlocking a second supply lane for battery anode buyers, and I expect electrode demand to grow with electric arc steelmaking at a steadier pace.”
- Nikhil Kaitwade, Principal Consultant, Future Market Insights.
How is the graphite market segmented?
The market is segmented into product type, purity, end use, and region. Synthetic graphite is estimated to lead product type with 58.5% share in 2026, and medium-purity grades lead purity with 43%.
By product type: natural and synthetic.
By purity: high, medium, and low.
By end use: metallurgy, electrical and electronics, automotive and transportation, energy generation, and others.
By region: steel, battery, electronics and industrial buyers in North America, Latin America, Western Europe, Eastern Europe, East Asia, South Asia and Pacific, and Middle East and Africa.
Why does synthetic graphite lead graphite sales by product type?
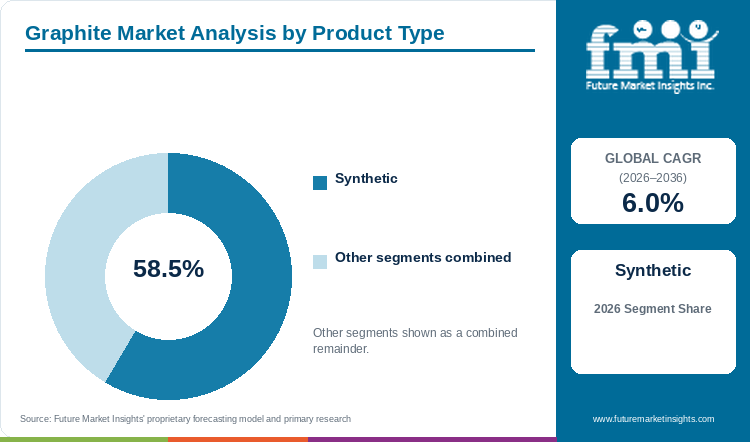
Synthetic graphite is estimated to lead product type sales with 58.5% share in 2026, against 41.5% for natural graphite.
Table 3: Product Type Share for the Graphite Market (percentage share), 2026
| Product Type | Estimated Share (2026) |
|---|---|
| Synthetic | 58.5% |
| Natural | 41.5% |
| Total | 100.0% |
Table 4: Product Type Leadership and Market Growth for the Graphite Market (segment and CAGR percentage), 2026 to 2036
| Metric | Value |
|---|---|
| Global CAGR (2026 to 2036) | 6% |
| Leading Segment | Synthetic |
Electrodes for electric arc furnaces, isostatic blocks for chip tools and most battery anode powder are made by baking and graphitizing petroleum or needle coke, so synthetic graphite is estimated to lead product type sales with a 58.5% share in 2026. Natural graphite, 41.5%, comes from flake, vein and amorphous mines and costs less per tonne, and refractory, foundry and lubricant users buy most natural tonnage, with coated spherical flake a growing share of anode supply. Natural flake needs purification and shaping before anode use, which adds cost and limits the number of qualified plants. NOVONIX makes synthetic graphite anode material and is working with ACP Technologies on domestic pitch.[2] Steel mills and chip toolmakers will keep buying synthetic grades, and anode buyers will split orders between both types.
- Graphite electrodes, isostatic blocks, anode powder and specialty shapes make up synthetic graphite volume.
- SGL Carbon marked new high-purity graphite capacity at St. Marys in the week before 13 October 2026.[1]
Why do medium-purity grades lead graphite sales by purity?
Medium-purity grades are expected to lead purity sales with 43% share in 2026, ahead of high-purity grades at an estimated 38.4% and low-purity grades at about 18.6%.
Table 5: Purity Share for the Graphite Market (percentage share), 2026
| Purity | Estimated Share (2026) |
|---|---|
| Medium | 43% |
| High | 38.4% |
| Low | 18.6% |
| Total | 100.0% |
Refractory bricks, crucibles, brake linings and foundry facings work with 85% to 95% carbon, and medium-purity grades are expected to lead purity sales with a 43% share in 2026. High-purity grades, an estimated 38.4%, above 99% carbon, go into battery anodes, semiconductor fixtures and nuclear parts, and each tonne needs chemical or thermal purification, so prices run far higher. Low-purity amorphous grades, about 18.6%, serve carbon raisers in steel and some lubricants at the lowest price. Graphite One noted that the United States remains fully import reliant for natural graphite.[3] Refractory and foundry buyers will stay with medium purity, and anode and chip buyers will pay for high purity.
- Refractories, foundry facings, brake linings and crucibles absorb most medium-purity graphite.
- Syrah Resources describes Vidalia in Louisiana as a commercial-scale active anode material plant supplying US buyers.[6]
Why does metallurgy lead graphite sales by end use?
Metallurgy is likely to lead end use sales with 34.6% share in 2026, ahead of electrical and electronics at 25% and automotive and transportation at an estimated 21.3%.
Table 6: End Use Share for the Graphite Market (percentage share), 2026
| End Use | Estimated Share (2026) |
|---|---|
| Metallurgy | 34.6% |
| Electrical & Electronics | 25% |
| Automotive & Transportation | 21.3% |
| Energy Generation | 11.8% |
| Others | 7.3% |
| Total | 100.0% |
Steel mills consume graphite electrodes, refractories and carbon raisers every day, so metallurgy is likely to lead end use with a 34.6% share in 2026. Electrical and electronics, 25%, covers semiconductor fixtures, brushes, heat spreaders and consumer battery anodes, and buyers there pay for purity. Automotive and transportation, an estimated 21.3%, is mostly anode material for traction batteries plus brake and clutch linings, and orders follow cell plant ramp-ups. Energy generation, 11.8%, includes nuclear graphite and anode material for grid storage, and a 9.1% CAGR expected for the battery energy storage system market adds grid anode orders. Others, 7.3%, include lubricants and fire retardants. Refractory linings also follow steel output, and the refractories market tracks that demand. AESC builds cells at Sunderland with 15.8 GWh of initial capacity.[7] Steelmakers will keep the largest share, and battery buyers will add the most new volume.
- Graphite electrodes for electric arc furnaces, refractory linings and carbon raisers make up metallurgy volume.
- SGL Carbon said in October 2026 that nine-month sales came to about EUR 595 million.[4]
What are the drivers, restraints, and opportunities in the graphite market?
Electric arc steelmaking and battery anode plants keep graphite orders growing. Concentrated supply and export controls create price and delivery risk, and new anode and high-purity plants outside Asia open long contracts.
- Driver: Every new cell factory needs a qualified anode supplier, and every electric arc furnace burns electrodes, so both build repeat buyers for graphite.
- Restraint: Battery-grade processing is concentrated in one country, and export licensing can delay deliveries and raise prices for anode buyers elsewhere.
- Opportunity: Carmakers and chip makers in North America and Europe want local graphite, which favours producers building anode and high-purity capacity there.
Cell Plants and Arc Furnaces Build Repeat Buyers
Adoption of graphite anodes follows cell plant openings. Exide Energy Solutions commissioned a 6 GWh first phase of a lithium-ion cell plant in Bengaluru in September 2026.[8] AESC opened 15.8 GWh of cell capacity at Sunderland in December 2025.[7] Each commissioned cell line becomes a monthly buyer of anode powder for the life of the plant, and cell output tracked in the lithium-ion battery market sets that anode volume.
Concentrated Supply Raises Delivery Risk
Key challenges for anode buyers start with the origin of the material. China issued Decision No. 58 on 9 October 2025, covering artificial graphite anode materials, blended anode materials and graphitization equipment.[5] Syrah Resources cited IEA analysis that more than USD 300 billion of downstream production outside China could be exposed to a full disruption of battery-grade graphite trade.[6] FMI data indicate that cell makers will hold larger safety stocks and pay premiums for qualified non-Chinese supply.
Local Anode and High-Purity Plants Open Long Contracts
Growth of the graphite market is also expected from new plants close to buyers in North America and Europe. Graphite One is advancing an Ohio battery materials facility and plans a 2029 start at Graphite Creek.[3] SGL Carbon serves semiconductor and small modular reactor customers from St. Marys.[1] Anode makers supplying cell plants also follow the wider buildout of battery materials, and the battery materials market sets the demand those plants serve.
Which country CAGRs are profiled in the graphite market?
Table 7: Country CAGR Comparison for the Graphite Market (CAGR percentage), 2026 to 2036
| Country | CAGR (2026 to 2036) |
|---|---|
| United Kingdom | 13.2% |
| United States | 11.7% |
| Germany | 11.2% |
| India | 7.4% |
| South Korea | 5.7% |
| China | 5.6% |
| Japan | 3.9% |
How do country-level CAGRs compare in the graphite market?
Cell production at Sunderland began with 15.8 GWh of capacity for the Nissan Leaf, and AESC has discussed expansion.[7] Gigafactory supply chains of this kind give the United Kingdom a 13.2% CAGR, the quickest in the table. On FMI's forecast, the United States grows at 11.7%, as anode and high-purity plants open to cut full import reliance. Germany, at 11.2%, gains from specialty graphite and cell plants. India, at 7.4%, adds electrodes and new cell lines. South Korea and China grow near the 6% global rate, at 5.7% and 5.6%, as large existing anode and electrode bases expand slowly. Japan is lowest at 3.9%, with a mature steel and electronics base.
- Gigafactories at Sunderland and planned cell plants are building demand for anode graphite in the United Kingdom.
- Domestic anode projects and chip-grade capacity carry growth in the United States.
- Specialty graphite makers and new cell plants support orders in Germany.
- Electrode exports and first cell lines add graphite use in India.
- Korean anode makers supply domestic cell plants and export lines.
- A very large existing base keeps growth in China close to the global rate.
- Mature steel and electronics buyers slow new demand in Japan.
Full report country CAGRs cover: Three Western countries well ahead of the 6% global pace, led by the United Kingdom, then India, then South Korea and China just below that pace and Japan last; remaining standard countries by region.
Country-wise Analysis
United Kingdom Graphite Market Outlook (2026 to 2036)
AESC opened a gigafactory at Sunderland with an initial 15.8 GWh of capacity for the third-generation Nissan Leaf and about 1,000 jobs once fully operational.[7] Anode material for those cells is imported today, and new cell lines will keep anode orders rising, which supports a 13.2% CAGR for the United Kingdom through 2036, the fastest in the table.
Key takeaway: Cell plants drive the United Kingdom.
United States Graphite Market Outlook (2026 to 2036)
The United States remains 100% import reliant for natural graphite, Graphite One said in July 2026, and the company expects no delay to a 2029 start at Graphite Creek.[3] NOVONIX and ACP Technologies agreed in September 2026 to develop a fully domestic pitch-coated synthetic graphite anode.[2] Those projects support an 11.7% CAGR for the United States.
Key takeaway: Domestic anode supply carries the United States.
Germany Graphite Market Outlook (2026 to 2036)
SGL Carbon, based in Wiesbaden, expects about EUR 595 million of sales for the first nine months of 2026 and raised the 2026 EBITDApre forecast to EUR 130 million to EUR 140 million.[4] Specialty graphite for semiconductor, industrial and battery customers keeps German demand growing, and FMI estimates Germany at 11.2%.
Key takeaway: Specialty graphite makers anchor Germany.
India Graphite Market Outlook (2026 to 2036)
Exide Energy Solutions commissioned the 6 GWh first phase of a lithium-ion cell plant in Bengaluru in September 2026, starting with LFP cells.[8] Electrode makers in India also supply electric arc furnaces at home and abroad, and the country is projected at 7.4%.
Key takeaway: New cell lines add to an electrode base in India.
South Korea Graphite Market Outlook (2026 to 2036)
Korean anode and cell makers buy natural and synthetic graphite for plants at home and overseas, and many are qualifying non-Chinese feedstock. FMI's model shows South Korea at 5.7%, close to the global rate, as existing anode lines expand step by step.
Key takeaway: Steady anode expansion defines South Korea.
China Graphite Market Outlook (2026 to 2036)
China issued export controls on artificial graphite anode materials and graphitization equipment on 9 October 2025, effective 8 November 2025.[5] China already holds most global anode processing capacity, so growth comes from a very large base, and China is projected at 5.6%.
Key takeaway: A large base slows the rate in China.
Japan Graphite Market Outlook (2026 to 2036)
Japanese steelmakers, electronics firms and electrode makers form a mature graphite base with few new furnaces or cell plants. In FMI's estimate, Japan grows at 3.9%, the lowest rate profiled, with fine-grain graphite for semiconductor tools the main growth line.
Key takeaway: A mature base slows Japan.
Who are the notable companies in the graphite market?
SGL Carbon, Imerys Graphite & Carbon, Graphite India, Tokai Carbon, AMG, Syrah Resources, NOVONIX, Graphite One, Northern Graphite, Qingdao Tianshengda Graphite, Lomiko Metals, Focus Graphite and Volt Resources are the profiled companies.
Electrode and specialty graphite makers lead sales, and the companies FMI profiles also include miners and anode developers. SGL Carbon put nine-month 2026 EBITDApre at about EUR 106 million.[4] Syrah Resources runs the Vidalia active anode material plant in Louisiana.[6] Imerys Graphite & Carbon, Graphite India, Tokai Carbon, AMG, NOVONIX, Graphite One, Northern Graphite, Qingdao Tianshengda Graphite, Lomiko Metals, Focus Graphite and Volt Resources complete the group.
- Electrode and specialty graphite makers: SGL Carbon, Graphite India, Tokai Carbon and Imerys Graphite & Carbon.
- Anode material producers: Syrah Resources, NOVONIX and AMG.
- Graphite miners and developers: Graphite One, Northern Graphite, Qingdao Tianshengda Graphite, Lomiko Metals, Focus Graphite and Volt Resources.
Competitive Benchmarking: Graphite Market
Table 8: Competitive Benchmarking for the Graphite Market (qualitative documentation ratings), 2026
| Company | Specialty Graphite | Anode Material | Natural Supply | Recency |
|---|---|---|---|---|
| SGL Carbon | High | Low | Low | High |
| Syrah Resources | Low | High | High | High |
| NOVONIX | Low | High | Low | High |
| Graphite One | Low | Medium | High | High |
| Tokai Carbon | Medium | Low | Low | Low |
Each score reflects how much dated 2025 and 2026 material a company released for that column, and none signals market share.
Key Developments in the Graphite Market
- On 13 October 2026, SGL Carbon announced a high-purity graphite capacity expansion at St. Marys, USA.[1]
- On 6 October 2026, SGL Carbon raised the 2026 EBITDApre forecast to EUR 130 million to EUR 140 million.[4]
- On 16 September 2026, NOVONIX and ACP Technologies signed a memorandum of understanding on domestic synthetic graphite anode material.[2]
- In September 2026, Exide Energy Solutions commissioned a 6 GWh cell plant in Bengaluru, Energetica India reported.[8]
- On 27 July 2026, Syrah Resources cited IEA forecasts that graphite demand will double by 2040.[6]
- On 9 July 2026, Graphite One said the Graphite Creek project expects no delay to a 2029 startup.[3]
- In December 2025, Battery-Tech Network reported first cell output at the AESC gigafactory in Sunderland, sized at 15.8 GWh.[7]
- On 9 October 2025, China issued Decision No. 58 on export controls for artificial graphite anode materials.[5]
Key Players in the Graphite Market
Electrode and Specialty Graphite Makers
- SGL Carbon
- Graphite India
- Tokai Carbon
- Imerys Graphite & Carbon
Anode Material Producers
- Syrah Resources
- NOVONIX
- AMG
Graphite Miners and Developers
- Graphite One
- Northern Graphite
- Qingdao Tianshengda Graphite
- Lomiko Metals
- Focus Graphite
- Volt Resources
Graphite Market - Report Scope
Table 9: Report Scope for the Graphite Market (coverage fields and definitions), 2026 to 2036
| Coverage field | Report scope |
|---|---|
| Market breakdown | Product type; purity; end use; region |
| Quantitative units | USD billion |
| Market definition | Natural flake, vein and amorphous graphite and synthetic graphite in powder, flake, block and electrode form, sold to steel, battery, electronics, automotive, energy and industrial users. |
| Regions covered | North America; Latin America; Western Europe; Eastern Europe; East Asia; South Asia and Pacific; Middle East and Africa |
| Countries covered | United States; Canada; Brazil; Mexico; Argentina; Chile; Germany; France; United Kingdom; Italy; Spain; Benelux; Nordics; Poland; Czech Republic; Romania; Hungary; China; Japan; South Korea; India; ASEAN; Australia and New Zealand; GCC Countries; South Africa; Türkiye; Israel |
| Key companies profiled | SGL Carbon, Imerys Graphite & Carbon, Graphite India, Tokai Carbon, AMG, Syrah Resources, NOVONIX, Graphite One, Northern Graphite, Qingdao Tianshengda Graphite, Lomiko Metals, Focus Graphite, Volt Resources |
| Forecast period | 2026 to 2036 |
Graphite Market - Research Methodology
Table 10: Research Methodology for the Graphite Market (research methods and approach), 2026 edition
| Method | Approach |
|---|---|
| Data Sources | Graphite producer and developer releases, cell plant announcements, legal notes on export controls and trade press from May 2025 onward. |
| Desk Research | Desk research covers electrode demand, anode supply, high-purity capacity, export controls and cell plant openings. |
| Market Sizing and Forecasting | Sizing starts from the 2026 base of USD 15.1 billion and the 6% CAGR for 2026 to 2036. |
| Data Validation | Capacity, sales and policy facts were checked against the release or note that first carried them. |
Graphite Market by Segments
Graphite Market segmented by Product Type:
- Natural
- Synthetic
Graphite Market segmented by Purity:
- High
- Medium
- Low
Graphite Market segmented by End Use:
- Metallurgy
- Electrical & Electronics
- Automotive & Transportation
- Energy Generation
- Others
Graphite Market by Region
- North America
- United States
- Canada
- Latin America
- Brazil
- Mexico
- Argentina
- Chile
- Western Europe
- Germany
- France
- United Kingdom
- Italy
- Spain
- Benelux
- Nordics
- Eastern Europe
- Poland
- Czech Republic
- Romania
- Hungary
- East Asia
- China
- Japan
- South Korea
- South Asia and Pacific
- India
- ASEAN
- Australia and New Zealand
- Middle East and Africa
- GCC Countries
- South Africa
- Türkiye
- Israel
Research Sources and Bibliography
- [1] SGL Carbon. (2026, October 13). SGL Carbon celebrates capacity expansion at its St. Marys site. https://www.sglcarbon.com/en/newsroom/news/press-report/sgl-carbon-celebrates-capacity-expansion-at-its-st-marys-site/
- [2] NOVONIX. (2026, September 16). NOVONIX and ACP Technologies Partner to Strengthen Domestic Supply Chain for Battery-Grade Anode Materials. https://www.novonixgroup.com/news/novonix-and-acp-technologies-partner-to-strengthen-domestic-supply-chain-for-battery-grade-anode-materials/
- [3] Graphite One. (2026, July 9). Graphite One Supports EIS Pathway for America's Largest Known Natural Graphite Deposit. https://www.graphiteoneinc.com/graphite-one-supports-eis-pathway-for-americas-largest-known-natural-graphite-deposit-no-anticipated-delay-to-2029-graphite-creek-project-startup-as-u-s-remains-100-import-reliant-for-natur/
- [4] SGL Carbon. (2026, October 6). Adhoc notification: SGL Carbon reports preliminary sales and earnings figures for the first nine months and raises its forecast for 2026. https://www.sglcarbon.com/en/newsroom/news/press-report/adhoc-notification-sgl-carbon-reports-preliminary-sales-and-earnings-figures-for-the-first-nine-months-and-raises-its-forecast-for-2026/
- [5] Herbert Smith Freehills Kramer. (2025, October 10). China export controls on lithium batteries and artificial graphite anode materials. https://www.hsfkramer.com/insights/2025-10/china-export-controls-lithium-batteries-and-artificial-graphite-anode-materials
- [6] Syrah Resources. (2026, July 27). IEA Outlook Reinforces Syrah's First-Mover Advantage in US Anode Markets. https://www.syrahresources.com.au/news/iea-outlook-reinforces-syrahs-first-mover-advantage-in-us-anode-markets
- [7] Battery-Tech Network. (2025, December 17). AESC Opens New Sunderland Gigafactory to Supply Nissan Leaf. https://battery-tech.net/battery-markets-news/aesc-opens-new-sunderland-gigafactory-to-supply-nissan-leaf/
- [8] Energetica India. (2026, September 28). Exide Commissions 6 GWh Phase I Lithium-Ion Cell Manufacturing Facility. https://www.energetica-india.net/news/exide-commissions-6-gwh-phase-i-lithium-ion-cell-manufacturing-facility
This bibliography is provided for reader reference. The full report contains the complete reference list and detailed citations.
This Report Answers
- How big is the graphite market during 2026?
- What market size is projected by 2036?
- Which product type holds notable share?
- Which purity holds notable share?
- Which countries have notable growth?
- Which companies are notable in the market?
Frequently Asked Questions
How large is the graphite market expected in 2026?
The graphite market is forecast at USD 15.1 billion in 2026 in FMI's estimate, up from USD 14.2 billion in 2025. Sales of graphite are projected to reach USD 27.0 billion by 2036.
What CAGR is projected for the graphite market through 2036?
The graphite market is projected to grow at a 6% CAGR from 2026 to 2036. Electric arc steelmaking and battery anode plants carry that growth.
Which product type holds a notable market share in 2026?
Synthetic graphite is estimated to lead with 58.5% share in 2026. Natural graphite holds 41.5%.
Which purity holds a notable market share in 2026?
Medium-purity grades are expected to lead with 43% share in 2026. High-purity grades follow at an estimated 38.4%.
Which country has a notable expansion outlook through 2036?
The United Kingdom comes first in FMI's country table with a 13.2% CAGR, as cell plants open. The United States follows at 11.7%.
Who are the key companies in the graphite market?
SGL Carbon, Graphite India, Tokai Carbon and Imerys Graphite & Carbon lead electrode and specialty graphite, and Syrah Resources, NOVONIX and AMG lead anode material. Graphite One, Northern Graphite, Qingdao Tianshengda Graphite, Lomiko Metals, Focus Graphite and Volt Resources complete the profiled companies.
Preview the report firsthand - request a free sample
Get SampleGet the brochure for pricing and purchase details.
Get PDFTable of Content
- Key Takeaways
- Market Size and CAGR
- Top Growth Driver
- Fastest Growing Segment
- Leading Region
- Key Companies
- Emerging Opportunities
- Executive Summary
- Global Market Outlook
- Demand-side Trends
- Supply-side Trends
- Technology Roadmap Analysis
- Analysis and Recommendations
- Analyst Perspective (What is happening? Why now? What should investors know?)
- Key Questions Answered
- How large is the market?
- What is the CAGR?
- What are key trends?
- Which region dominates?
- Who are the leaders?
- Market Overview
- Market Coverage / Taxonomy
- Market Definition / Scope / Limitations
- Research Methodology
- Chapter Orientation
- Analytical Lens and Working Hypotheses
- Market Structure, Signals, and Trend Drivers
- Benchmarking and Cross-market Comparability
- Market Sizing, Forecasting, and Opportunity Mapping
- Research Design and Evidence Framework
- Desk Research Programme (Secondary Evidence)
- Expert Input and Fieldwork (Primary Evidence)
- Tooling, Models, and Reference Databases
- Data Engineering and Model Build
- Quality Assurance and Audit Trail
- Market Background
- Market Dynamics (Drivers, Restraints, Opportunity, Trends)
- Scenario Forecast (Optimistic, Likely, Conservative)
- Impact Analysis
- AI Impact
- Sustainability Impact
- Regulatory Impact
- Technology Impact
- Consumer / Buyer Analysis
- Purchase Drivers
- Adoption Barriers
- Buyer Journey
- Opportunity Map Analysis
- Product Life Cycle Analysis
- Supply Chain Analysis
- Investment Feasibility Matrix
- Value Chain Analysis
- PESTLE and Porter's Analysis
- Regulatory Landscape
- Regional Parent Market Outlook
- Production and Consumption Statistics
- Import and Export Statistics
- Global Market Analysis and Forecast, 2021 to 2036
- Historical Market Size Value (USD Billion) Analysis, 2021 to 2025
- Current and Future Market Size Value (USD Billion) Projections, 2026 to 2036
- Y-o-Y Growth Trend Analysis
- Absolute $ Opportunity Analysis
- Global Market Pricing Analysis, 2021 to 2036
- Global Market Analysis and Forecast, By Product Type, 2021 to 2036
- Introduction / Key Findings
- Historical Market Size Value (USD Billion) Analysis By Product Type, 2021 to 2025
- Current and Future Market Size Value (USD Billion) Analysis and Forecast By Product Type, 2026 to 2036
- Natural
- Synthetic
- Y-o-Y Growth Trend Analysis By Product Type, 2021 to 2025
- Absolute $ Opportunity Analysis By Product Type, 2026 to 2036
- Global Market Analysis and Forecast, By Purity, 2021 to 2036
- Introduction / Key Findings
- Historical Market Size Value (USD Billion) Analysis By Purity, 2021 to 2025
- Current and Future Market Size Value (USD Billion) Analysis and Forecast By Purity, 2026 to 2036
- High
- Medium
- Low
- Y-o-Y Growth Trend Analysis By Purity, 2021 to 2025
- Absolute $ Opportunity Analysis By Purity, 2026 to 2036
- Global Market Analysis and Forecast, By End Use, 2021 to 2036
- Introduction / Key Findings
- Historical Market Size Value (USD Billion) Analysis By End Use, 2021 to 2025
- Current and Future Market Size Value (USD Billion) Analysis and Forecast By End Use, 2026 to 2036
- Metallurgy
- Electrical & Electronics
- Automotive & Transportation
- Energy Generation
- Others
- Y-o-Y Growth Trend Analysis By End Use, 2021 to 2025
- Absolute $ Opportunity Analysis By End Use, 2026 to 2036
- Global Market Analysis and Forecast, By Region, 2021 to 2036
- Introduction
- Historical Market Size Value (USD Billion) Analysis By Region, 2021 to 2025
- Current Market Size Value (USD Billion) Analysis and Forecast By Region, 2026 to 2036
- North America
- Latin America
- Western Europe
- Eastern Europe
- East Asia
- South Asia and Pacific
- Middle East and Africa
- Market Attractiveness Analysis By Region
- North America Market Analysis and Forecast, By Country, 2021 to 2036
- Historical Market Size Value (USD Billion) Trend Analysis By Market Taxonomy, 2021 to 2025
- Market Size Value (USD Billion) Forecast By Market Taxonomy, 2026 to 2036
- By Country
- United States
- Canada
- By Product Type
- By Purity
- By End Use
- By Country
- Market Attractiveness Analysis
- By Country
- By Product Type
- By Purity
- By End Use
- Key Takeaways
- Latin America Market Analysis and Forecast, By Country
- Historical Market Size Value (USD Billion) Trend Analysis By Market Taxonomy, 2021 to 2025
- Market Size Value (USD Billion) Forecast By Market Taxonomy, 2026 to 2036
- By Country
- Brazil
- Mexico
- Argentina
- Chile
- By Product Type
- By Purity
- By End Use
- By Country
- Market Attractiveness Analysis
- By Country
- By Product Type
- By Purity
- By End Use
- Key Takeaways
- Western Europe Market Analysis and Forecast, By Country
- Historical Market Size Value (USD Billion) Trend Analysis By Market Taxonomy, 2021 to 2025
- Market Size Value (USD Billion) Forecast By Market Taxonomy, 2026 to 2036
- By Country
- Germany
- France
- United Kingdom
- Italy
- Spain
- Benelux
- Nordics
- By Product Type
- By Purity
- By End Use
- By Country
- Market Attractiveness Analysis
- By Country
- By Product Type
- By Purity
- By End Use
- Key Takeaways
- Eastern Europe Market Analysis and Forecast, By Country
- Historical Market Size Value (USD Billion) Trend Analysis By Market Taxonomy, 2021 to 2025
- Market Size Value (USD Billion) Forecast By Market Taxonomy, 2026 to 2036
- By Country
- Poland
- Czech Republic
- Romania
- Hungary
- By Product Type
- By Purity
- By End Use
- By Country
- Market Attractiveness Analysis
- By Country
- By Product Type
- By Purity
- By End Use
- Key Takeaways
- East Asia Market Analysis and Forecast, By Country
- Historical Market Size Value (USD Billion) Trend Analysis By Market Taxonomy, 2021 to 2025
- Market Size Value (USD Billion) Forecast By Market Taxonomy, 2026 to 2036
- By Country
- China
- Japan
- South Korea
- By Product Type
- By Purity
- By End Use
- By Country
- Market Attractiveness Analysis
- By Country
- By Product Type
- By Purity
- By End Use
- Key Takeaways
- South Asia and Pacific Market Analysis and Forecast, By Country
- Historical Market Size Value (USD Billion) Trend Analysis By Market Taxonomy, 2021 to 2025
- Market Size Value (USD Billion) Forecast By Market Taxonomy, 2026 to 2036
- By Country
- India
- ASEAN
- Australia and New Zealand
- By Product Type
- By Purity
- By End Use
- By Country
- Market Attractiveness Analysis
- By Country
- By Product Type
- By Purity
- By End Use
- Key Takeaways
- Middle East and Africa Market Analysis and Forecast, By Country
- Historical Market Size Value (USD Billion) Trend Analysis By Market Taxonomy, 2021 to 2025
- Market Size Value (USD Billion) Forecast By Market Taxonomy, 2026 to 2036
- By Country
- GCC Countries
- South Africa
- Türkiye
- Israel
- By Product Type
- By Purity
- By End Use
- By Country
- Market Attractiveness Analysis
- By Country
- By Product Type
- By Purity
- By End Use
- Key Takeaways
- Key Countries Market Analysis
- United States
- Pricing Analysis
- Market Share Analysis, 2025
- By Product Type
- By Purity
- By End Use
- Canada
- Pricing Analysis
- Market Share Analysis, 2025
- By Product Type
- By Purity
- By End Use
- Mexico
- Pricing Analysis
- Market Share Analysis, 2025
- By Product Type
- By Purity
- By End Use
- Brazil
- Pricing Analysis
- Market Share Analysis, 2025
- By Product Type
- By Purity
- By End Use
- Chile
- Pricing Analysis
- Market Share Analysis, 2025
- By Product Type
- By Purity
- By End Use
- Germany
- Pricing Analysis
- Market Share Analysis, 2025
- By Product Type
- By Purity
- By End Use
- United Kingdom
- Pricing Analysis
- Market Share Analysis, 2025
- By Product Type
- By Purity
- By End Use
- Italy
- Pricing Analysis
- Market Share Analysis, 2025
- By Product Type
- By Purity
- By End Use
- Spain
- Pricing Analysis
- Market Share Analysis, 2025
- By Product Type
- By Purity
- By End Use
- France
- Pricing Analysis
- Market Share Analysis, 2025
- By Product Type
- By Purity
- By End Use
- India
- Pricing Analysis
- Market Share Analysis, 2025
- By Product Type
- By Purity
- By End Use
- ASEAN
- Pricing Analysis
- Market Share Analysis, 2025
- By Product Type
- By Purity
- By End Use
- Australia and New Zealand
- Pricing Analysis
- Market Share Analysis, 2025
- By Product Type
- By Purity
- By End Use
- China
- Pricing Analysis
- Market Share Analysis, 2025
- By Product Type
- By Purity
- By End Use
- Japan
- Pricing Analysis
- Market Share Analysis, 2025
- By Product Type
- By Purity
- By End Use
- South Korea
- Pricing Analysis
- Market Share Analysis, 2025
- By Product Type
- By Purity
- By End Use
- Poland
- Pricing Analysis
- Market Share Analysis, 2025
- By Product Type
- By Purity
- By End Use
- Hungary
- Pricing Analysis
- Market Share Analysis, 2025
- By Product Type
- By Purity
- By End Use
- Türkiye
- Pricing Analysis
- Market Share Analysis, 2025
- By Product Type
- By Purity
- By End Use
- South Africa
- Pricing Analysis
- Market Share Analysis, 2025
- By Product Type
- By Purity
- By End Use
- United States
- Market Structure Analysis
- Competition Dashboard
- Competition Benchmarking
- Market Share Analysis of Top Players
- By Regional
- By Product Type
- By Purity
- By End Use
- Emerging Startups
- Innovation Benchmarking
- Competition Analysis
- Competition Deep Dive
- SGL Carbon
- Overview
- Product Portfolio
- Profitability by Market Segments
- Sales Footprint
- Strategy Overview
- Marketing Strategy
- Product Strategy
- Channel Strategy
- Syrah Resources
- NOVONIX
- Graphite One
- Tokai Carbon
- Graphite India
- Imerys Graphite & Carbon
- AMG
- Northern Graphite
- Qingdao Tianshengda Graphite
- Lomiko Metals
- Focus Graphite
- Volt Resources
- SGL Carbon
- Case Studies
- Success Stories
- Recent Developments
- Competition Deep Dive
- Assumptions & Acronyms Used


