

- Market Size (2026)
- USD 1.8 Bn
- Forecast (2036)
- USD 11.1 Bn
- CAGR (2026 to 2036)
- 20.0%
How big is the HD Mapping & Localization for AVs Market in 2026?
USD 1.8 billion in 2026 and USD 11.1 billion by 2036 at a 20.0% CAGR.
Demand for HD mapping & localization for AVs is projected to expand at 20.0% CAGR between 2026 and 2036, increasing valuation from USD 1.8 billion in 2026 to USD 11.1 billion by 2036. Lane-level road models support positioning confidence across automotive software used for highway assistance and robotaxi operation. Automated freight programs extend corridor map requirements across connected fleets. International Organization of Motor Vehicle Manufacturers reported in April 2026 global vehicle production reaching 96.4 million units during 2025, expanding the installed base available for map-enabled driving systems.
United States and European Union vehicle programs favor documented map freshness and safety traceability. China and South Korea programs emphasize local data controls and dense urban validation. Japan programs prioritize coordinated infrastructure testing for autonomous vehicles and repeatable route evidence. California Department of Motor Vehicles reported in February 2026 autonomous vehicles covering more than 9 million miles during the reporting period ending November 2025, increasing route evidence available for localization updates.
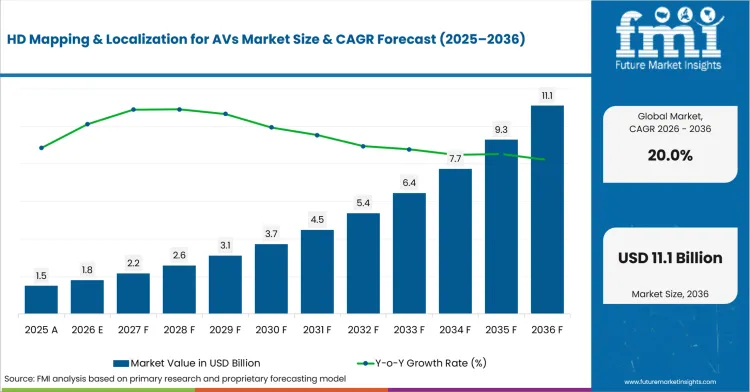
| Metric | Value |
|---|---|
| 2025 Market Size | USD 1.5 billion |
| 2026 Market Size | USD 1.8 billion |
| 2036 Market Size | USD 11.1 billion |
| Forecast CAGR (2026-2036) | 20.0% |
| Offering Focus | Data and Content Licensing |
| Data and Content Licensing Share (2026) | 48.0% |
| End-use Focus | Passenger Car OEMs |
| Passenger Car OEMs Share (2026) | 46.0% |
| Pricing Model Focus | Per-vehicle License |
| Per-vehicle License Share (2026) | 44.0% |
Summary of HD Mapping & Localization for AVs Market
| Market Signal | Commercial Impact |
|---|---|
| Demand and Growth Drivers | Automaker software programs increase map-content requirements for highway assistance and automated mobility. Commercial reviews focus on update frequency and positioning consistency.
|
| Product and Segment View | Segment direction is projected to favor data and content licensing followed by passenger car OEMs and per-vehicle licenses. Product review is estimated to focus on update frequency and vehicle-program coverage.
|
| Geography and Growth Outlook | Country activity is expected to differ according to test-road access and map-data rules. China is forecast to lead tracked expansion followed by United States and European Union.
|
| Competitive View | Competition is anticipated to center on geographic coverage and localization interfaces. Providers with established automaker programs are expected to receive greater review attention.
|
| Analyst Perspective | Lane-level maps extend vehicle awareness beyond immediate sensor range. Supplier performance reflects measurable update quality and dependable integration support.
|
Source: Future Market Insights analysis, 2026.
How is HD mapping & localization for AVs market segmented?
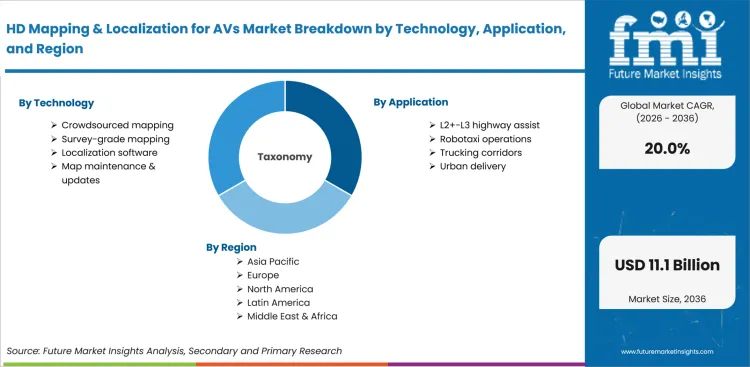
The HD mapping & localization for AVs sector is segmented by technology, application, offering, end-use, pricing model and region.
The HD mapping & localization for AVs market is segmented by technology, application, offering, end-use, pricing model and region. Technology includes crowdsourced mapping, survey-grade mapping, localization software, and map maintenance or updates. Application includes L2+-L3 highway assist, robotaxi operations, trucking corridors, and urban delivery. Offering includes data and content licensing, software, and services. End-use includes passenger car OEMs, AV developers, Tier-1 navigation suppliers, and commercial fleets. Pricing includes per-vehicle licenses, subscriptions, enterprise contracts, and pilot programs. Regional coverage includes North America, Latin America, Western Europe, Eastern Europe, East Asia, South Asia and Pacific, Middle East and Africa.
Why does crowdsourced mapping shape technology selection?
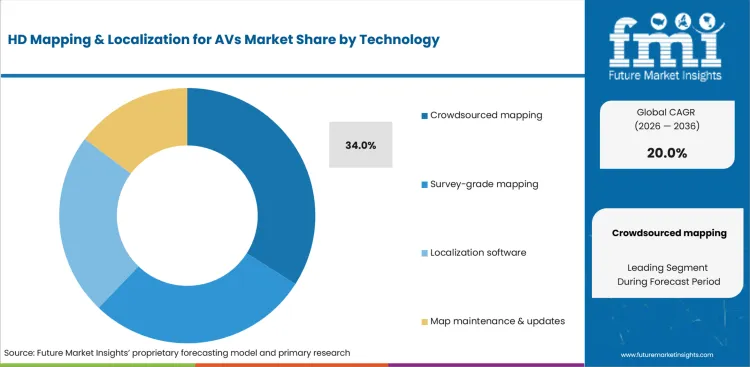
Crowdsourced mapping gathers road observations from production vehicles and connected fleets during regular journeys. Fleet observations expose lane changes and temporary restrictions requiring map review. Verified changes enter map-refresh systems, providing road references complementing automotive-grade inertial navigation system inputs during localization checks. Recurring vehicle feeds reduce dedicated survey activity for routine network maintenance since road conditions are recorded during normal fleet movement. Mobileye reported in June 2026 for more than 230 million vehicles built with EyeQ technology through 2025, illustrating an extensive observation base capable of supporting repeated map validation across numerous roads.
- Based on technology, crowdsourced mapping is likely to garner 34.0% share in 2026 due to recurring vehicle observations and scalable change detection. Providers compare sensor diversity and verification procedures prior to publishing road updates.
- Survey-grade mapping addresses routes requiring controlled precision and richer road detail. Localization software reconciles mapped lanes with onboard perception as maintenance services register network changes.
How does L2+-L3 highway assist shape application demand?
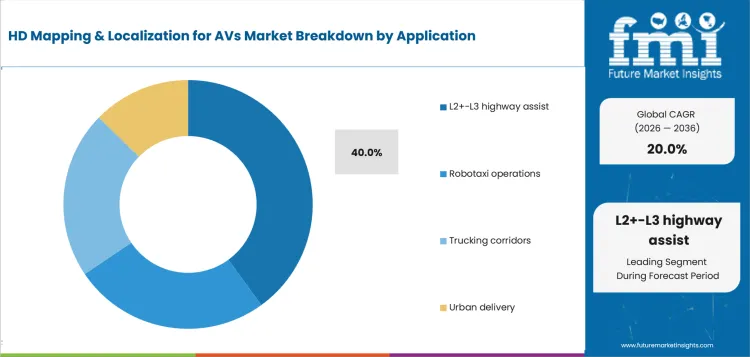
Waymo reported in May 2025 accounting for more than 250,000 paid trips each week, demonstrating an operating scale requiring continuous mapping and localization support across repeated passenger journeys. Highway assistance relies on lane boundaries and interchange geometry extending beyond standard navigation detail. Advance road information prepares automotive ADAS controls for approaching lane transitions and speed adjustments. Defined highway corridors permit repeated testing of mapped attributes under consistent operating conditions. Commercial automated-driving activity increases update requirements since every trip relies on accurate route geometry and dependable vehicle positioning.
- L2+-L3 highway assist is expected to account for 40.0% share of application in 2026, guided by controlled operating conditions and expanding vehicle availability. Automakers review lane-level data against automotive sensors during highway testing.
- Robotaxi operations require dense urban updates and precise curb-level positioning. Trucking corridors and urban delivery use solid state LiDAR sensor inputs with route maps for terminal access and city movement.
Why does data and content licensing lead offering selection?
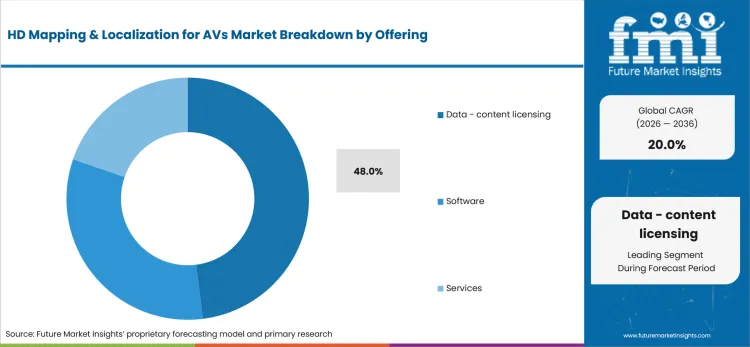
Data and content licensing delivers lane models and change-detection feeds through recurring access agreements. Recurring delivery keeps map attributes current throughout vehicle production and operating life. Updated content then supports location intelligence used for routing and automated-driving decisions. Resulting with automakers requiring providers capable of maintaining consistent coverage across numerous models and operating countries. HERE Technologies reported in November 2025 stating about 222 million vehicles shipped with its services, confirming delivery capacity suited to large automotive programs requiring continuing location content.
- By offering, data and content licensing is set to represent 48.0% share in 2026 since it reflects repeated map delivery across vehicle platforms and operating countries. Engineering teams compare freshness commitments and road coverage during provider reviews.
- Software supports localization and map matching inside automated-driving stacks. Integration services cover testing and data conversion for regional vehicle launches.
Why do passenger car OEMs lead end-use demand?
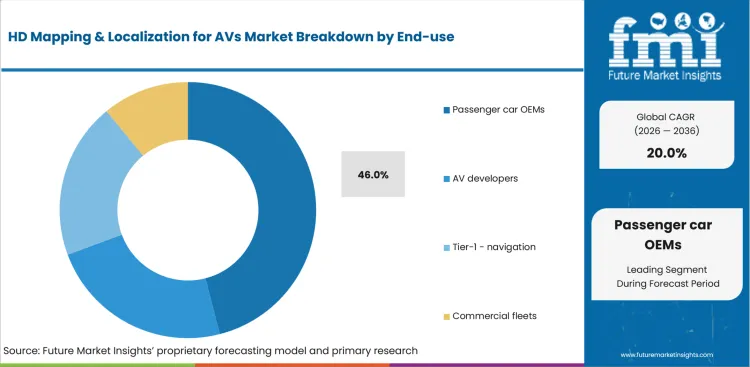
HERE Technologies stated in January 2025 noting for more than 53 million vehicles across Europe and North America having used its maps for ADAS and automated driving, confirming extensive production deployment across prominent automotive regions. Passenger car OEMs integrate lane-level maps into factory-installed highway assistance and automotive navigation system functions. Shared vehicle platforms allow one validated map architecture to support several models and regional launches. Wider model coverage increases the need for consistent road attributes and continuing updates throughout each production program. Established map deployment across large vehicle populations demonstrates whether providers possess sufficient technical and delivery capacity for OEM requirements.
- Passenger car OEMs are predicted to hold 46.0% share in 2026, aided by factory validation and production-linked map delivery. Vehicle teams assess regulatory coverage and sensor compatibility during program selection.
- AV developers use HD maps for robotaxi and shuttle operation inside defined service zones. Tier-1 suppliers and commercial fleets connect localization content with corridor automation and vehicle tracking system functions.
How does per-vehicle licensing shape pricing-model selection?
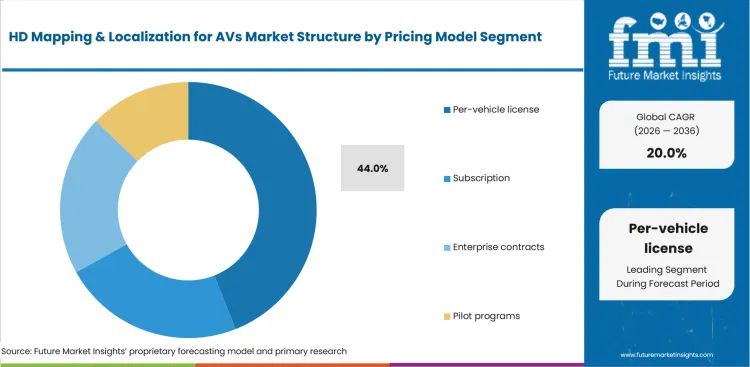
Per-vehicle licensing assigns map-content costs to each vehicle carrying an activated driving function. Unit-based pricing gives automakers predictable commercial terms across individual models and production volumes. Every connected vehicle is likely to also contribute anonymized road observations, expanding the information available for map maintenance. Larger production fleets therefore strengthen both licensed distribution and recurring map collection within the same commercial structure. Mobileye reported in January 2026 claiming for more than 8 million vehicles across 18 automotive brands and 50 vehicle models harvested anonymized REM data globally, demonstrating production deployment directly supporting per-vehicle licensing and continuing road-intelligence collection.
- In 2026, per-vehicle licenses are estimated to secure 44.0% share in 2026 owing to straightforward allocation across factory-installed systems. Contract reviews consider coverage rights and update duration for each vehicle program.
- Subscriptions support continuing map services for connected fleets and software products. Enterprise contracts serve large developers as pilot programs permit limited testing prior to commercial deployment.
What are drivers, restraints, and opportunities in HD mapping & localization for AVs market?
Production integration and lane-level positioning support HD mapping evaluation. Validation expense and regional data controls may delay provider selection.
- Driver: Production ADAS programs require lane-level context beyond immediate sensor range. Map updates preserve road geometry across vehicle software releases.
- Restraint: Validation work expands with road changes and reporting duties. Regional data rules add separate engineering reviews.
- Opportunity: Common map formats support vehicle launches across regulated territories. Simulation services extend HD data into development workflows.
Production integration supports recurring map delivery throughout model lifecycles. Mercedes-Benz reported in December 2024 DRIVE PILOT approval at speeds reaching 95 km/h, increasing lane geometry and speed-rule accuracy requirements.
Validation obligations raise documentation workloads across developers and map providers. National Highway Traffic Safety Administration stated in April 2025 qualifying crashes require reporting if automation operated within 30 seconds of crash onset, strengthening requirements for synchronized route and incident records.
Cross-border standards create access for providers with interoperable map formats. European Commission reported in April 2024 support for 19 connected and automated mobility projects, extending shared technical work across European transport programs.
How are country CAGRs aligned in HD mapping & localization for AVs market?
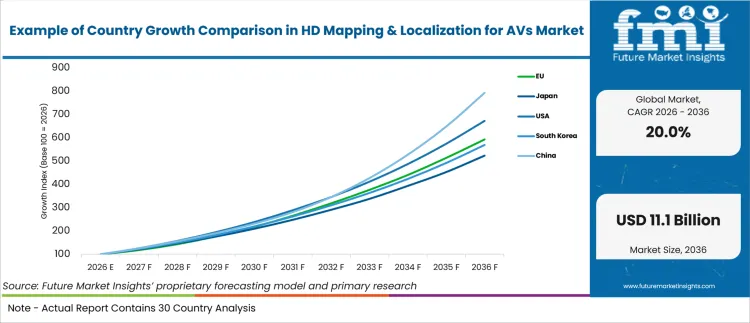
| Country or Market | CAGR |
|---|---|
| China | 23.0% |
| United States | 21.0% |
| European Union | 19.5% |
| South Korea | 19.0% |
| Japan | 18.0% |
Source: Future Market Insights analysis, 2026.
How do country-level CAGRs compare in HD mapping & localization for AVs market?
The country comparison shows a gradual step-down in growth across the markets covered. China occupies the upper end of the range, followed by the United States. The European Union and South Korea form a closely grouped middle tier. Japan remains at the lower end of the comparison. The five-point spread shows that all profiled markets share a positive growth outlook, although their relative positions indicate different levels of market momentum. The European Union figure represents a regional average, so individual member countries may record higher or lower growth.
- China leads the comparison and establishes East Asia as the principal growth cluster among the markets shown.
- The United States follows closely, indicating its forecast does not fall far behind the leading market.
- The European Union and South Korea form the next growth band and maintain a limited gap from the upper tier.
- Japan records the slowest growth among the listed markets, even though its forecast remains positive within the wider market context.
- The pattern resembles a gradual downward slope instead of a sharp separation between high-growth and lower-growth markets.
Markets carrying broadly similar CAGRs may present different entry conditions due to local mapping rules, test-road access, automotive software capability, and localization infrastructure. The full report provides country-level analysis across North America, Latin America, Europe, East Asia, South Asia and Pacific, and the Middle East and Africa.
Country-wise Analysis
- State Council Information Office reported in September 2025 more than 35,000 kilometers of test and demonstration roads opened nationwide, increasing map-validation coverage. Sector in China is anticipated to grow at 23.0% CAGR during the study period, guided by intelligent-vehicle pilots and domestic mapping capability. Local data controls encourage partnerships using approved road information
- Sales in the United States are predicted to expand at 21.0% CAGR between 2026 and 2036, due to public-road testing and vehicle-software programs support. Extensive road usage increases the volume of network changes requiring map maintenance. Federal Highway Administration reported in February 2026 total motor-vehicle travel reaching 3.294 trillion miles during 2024, illustrating the operating scale served by location content.
- Eurostat reported in February 2026 available-country data representing 93% of new European Union passenger-car registrations during 2024, supporting standardized regional map services. Shared requirements encourage common map attributes across principal launch countries. Adoption in the European Union is forecast to scale at 19.5% CAGR during the assessment period, reflected by coordinated vehicle rules and cross-border model programs.
- Industry in South Korea is projected to rise at 19.0% CAGR from 2026 to 2036, influenced by domestic vehicle software and pilot-zone operation. Public mobility services provide route evidence for continuing localization refinement. Ministry of Land, Infrastructure and Transport reported in February 2026 passenger counts rising 63% between January and June 2025 in a sampled autonomous service, promoting continuing route development.
- Sector in Japan is set to record 18.0% CAGR by 2036, driven by consortium-backed mapping and structured automation trials. Controlled locations permit detailed assessment of route geometry and positioning reliability. Toyota Industries Corporation reported in July 2024 a Level-4 airport tow-tractor trial using an approximately 2-kilometer route, demonstrating high-precision mapping inside restricted operations.
Who are notable companies in HD mapping & localization for AVs market?
Mobileye Global Inc. and HERE Technologies support crowdsourced road intelligence and automotive map delivery. TomTom N.V. and Dynamic Map Platform Co., Ltd. provide lane-level mapping and localization capabilities.
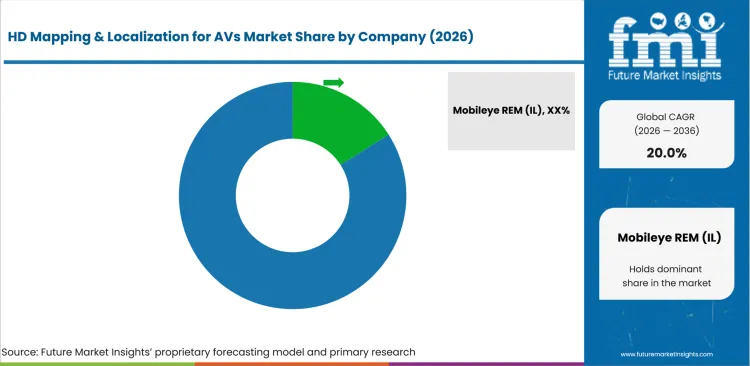
Competition in HD mapping & localization for AVs is anticipated to center on map freshness and localization accuracy. Vehicle integration and geographic compliance are expected to influence provider selection. Mobileye Global Inc. is projected to receive attention through REM road intelligence and EyeQ-based programs. HERE Technologies is estimated to compete due to automotive maps and established OEM relationships. TomTom N.V. is anticipated to support vehicle software through Orbis Maps. Dynamic Map Platform Co., Ltd. is likely to add high-precision data across regional programs.
- Mobileye Global Inc. and HERE Technologies are expected to compete based on production-vehicle observations and automotive integration. Engineering teams are likely to compare refresh evidence and regional service continuity.
- TomTom N.V. is projected to support automated-driving software depending on lane models and map interfaces. Automakers are anticipated to examine update frequency and platform compatibility.
- Dynamic Map Platform Co., Ltd. is forecast to contribute high-precision data and localization layers. International programs are expected to review geographic coverage and technical support.
Competitive Benchmarking: HD Mapping & Localization for AVs Market
| Company | Mapping Depth | Automotive Integration | Localization Capability | Service Reach |
|---|---|---|---|---|
| Mobileye Global Inc. | High | High | High | Global |
| HERE Technologies | High | High | High | Global |
| TomTom N.V. | High | High | High | Global |
| Dynamic Map Platform Co., Ltd. | High | Medium | High | Japan and international regions |
Source: Future Market Insights competitive analysis, 2026.
Key Developments in HD Mapping & Localization for AVs Market
- In April 2025, HERE Technologies and Lotus Robotics announced a Highway Navigation Pilot using HERE HD Live Map. Integrated map and perception support advanced highway functions for upcoming vehicle programs.
- In September 2025, Dynamic Map Platform Co., Ltd. and Space42 signed an agreement covering HD maps, localization layers, and data formats. International standards work supports autonomous mobility programs across new operating territories.
- In January 2026, TomTom N.V. announced CARIAD selected Orbis Maps for automated-driving systems. Map integration strengthens road-context delivery across Volkswagen Group software programs.
Key Players in HD Mapping & Localization for AVs Market
Crowdsourced mapping and road-intelligence providers
- Mobileye Global Inc.
- HERE Technologies
Lane-level mapping and vehicle-software platforms
- TomTom N.V.
High-precision data and localization providers
- Dynamic Map Platform Co., Ltd.
HD Mapping & Localization for AVs Market Report Scope
| Coverage field | Report scope |
|---|---|
| Market breakdown | HD mapping & localization for AVs market breakdown by technology, application, offering, end-use, pricing model and region |
| Quantitative Units | USD billion in 2026 to USD billion by 2036 at a CAGR |
| Market Definition | Commercial HD map data, localization software, map-update services, and integration used by ADAS and automated-driving programs |
| Regions Covered | North America and Latin America with Western Europe, Eastern Europe, East Asia, South Asia and Pacific, Middle East and Africa |
| Countries Covered | United States, China, European Union, South Korea, Japan, Canada, Brazil, Mexico, Germany, France, United Kingdom, Italy, Spain, India, ASEAN, Australia, GCC countries, South Africa and Türkiye |
| Key Companies Profiled | Mobileye Global Inc., HERE Technologies, TomTom N.V. and Dynamic Map Platform Co., Ltd. |
| Forecast Period | 2026 to 2036 |
| Approach | Hybrid bottom-up and top-down methodology using segment share, country CAGR, vehicle-program evidence, map coverage, and provider activity |
Source: Future Market Insights analysis, 2026.
HD Mapping & Localization for AVs Market - Research Methodology
| Method | Approach |
|---|---|
| Primary Research | FMI analysts gathered input from manufacturers, service providers, technology developers, distributors, end users, procurement teams, and subject-matter experts. Interviews examined purchasing decisions, product or service evaluation, adoption barriers, approval requirements, pricing considerations, and expectations for technical or commercial support. Respondents were also asked what evidence is required before a trial, pilot, or initial order develops into regular purchasing. |
| Desk Research | Desk research covered government statistics, regulatory publications, trade data, industry associations, technical literature, standards, company filings, product information, and official corporate announcements. Sources were reviewed for relevance, publication date, geographic coverage, and consistency with the defined market scope. Claims relating to performance, applications, approvals, capacity, investment, and commercial activity were retained only when supported by credible public evidence. |
| Market Sizing and Forecasting | The market model combined the baseline value with historical performance, segment structure, pricing and volume indicators, adoption levels, company participation, and country-level demand conditions. Forecast assumptions considered economic activity, investment trends, regulatory developments, technology adoption, purchasing cycles, supply availability, and barriers to wider market use. Segment and regional estimates were reconciled before the final market total was calculated. |
| Data Validation | Estimates were checked against multiple independent indicators, including public data, company activity, trade patterns, industry developments, and findings from primary interviews. Validation also tested whether products, services, applications, and company revenues fell within the defined market boundaries. Adjacent categories, unsupported claims, overlapping revenues, and activities without direct market relevance were excluded to reduce double counting and maintain consistency across segments and countries. |
Source: Future Market Insights analysis, 2026.
HD Mapping & Localization for AVs Market by Segments
HD Mapping & Localization for AVs Market segmented by Technology:
- Crowdsourced mapping
- Survey-grade mapping
- Localization software
- Map maintenance and updates
HD Mapping & Localization for AVs Market segmented by Application:
- L2+-L3 highway assist
- Robotaxi operations
- Trucking corridors
- Urban delivery
HD Mapping & Localization for AVs Market segmented by Offering:
- Data and content licensing
- Software
- Services
HD Mapping & Localization for AVs Market segmented by End-use:
- Passenger car OEMs
- AV developers
- Tier-1 and navigation suppliers
- Commercial fleets
HD Mapping & Localization for AVs Market segmented by Pricing Model:
- Per-vehicle license
- Subscription
- Enterprise contracts
- Pilot programs
HD Mapping & Localization for AVs Market segmented by Region:
- North America
- United States
- Canada
- Latin America
- Brazil
- Mexico
- Rest of Latin America
- Western Europe
- Germany
- France
- United Kingdom
- Italy
- Spain
- Rest of Western Europe
- Eastern Europe
- Poland
- Romania
- Czech Republic
- Rest of Eastern Europe
- East Asia
- China
- Japan
- South Korea
- South Asia and Pacific
- India
- ASEAN
- Australia and New Zealand
- Rest of South Asia and Pacific
- Middle East and Africa
- GCC countries
- South Africa
- Türkiye
- Rest of Middle East and Africa
Research Sources and Bibliography
- International Organization of Motor Vehicle Manufacturers. (2026, April 23). Auto industry growth shifted east in 2025 amid global repositioning.
- California Department of Motor Vehicles. (2026, February 20). Autonomous vehicle permit holders in California logged more than 9 million test miles between December 1, 2024 and November 30, 2025.
- Mobileye Global Inc. (2026, June 16). Mobileye to establish vertically integrated robotaxi business.
- Waymo LLC. (2025, May 5). Scaling our fleet through USA manufacturing.
- HERE Technologies. (2025, November 3). HERE Technologies and Amap form strategic alliance to deliver next-gen AI navigation for Chinese automakers worldwide.
- HERE Technologies. (2025, January 7). HERE and BMW Group extend partnership on AI-powered mapping system for automated driving and enhanced road safety.
- Mobileye Global Inc. (2026, January 5). Mobileye Surround ADAS adds second top 10 automaker.
- Mercedes-Benz Group AG. (2024, December 17). Mercedes-Benz increases top speed of its Level 3 automated driving system to 95 km/h.
- National Highway Traffic Safety Administration. (2025, April 24). Standing General Order on crash reporting.
- European Commission. (2024, April 17). Automated mobility in Europe: Where are we now?
- State Council Information Office of the People’s Republic of China. (2025, September 25). China establishes full industrial chain for key intelligent connected vehicle technologies.
- Federal Highway Administration. (2026, February). Annual vehicle distance traveled in miles and related data - 2024.
- Eurostat. (2026, February 20). Key figures on transport - passenger car registrations.
- Ministry of Land, Infrastructure and Transport. (2026, February 26). Autonomous driving vehicles to serve transportation-vulnerable areas.
- Toyota Industries Corporation. (2024, July 16). All Nippon Airways and Toyota Industries partner for Japan’s first-ever Level-4 airport cargo transportation.
- HERE Technologies. (2025, April 3). Lotus Robotics and HERE Technologies collaborate on Highway Navigation Pilot for automated driving.
- Dynamic Map Platform Co., Ltd. (2025, September 26). Dynamic Map Platform and Space42 to advance HD mapping and autonomous mobility.
- TomTom N.V. (2026, January 5). TomTom Orbis Maps to power CARIAD’s automated driving systems.
This bibliography is provided for reader reference and is not exhaustive. The full report contains the complete reference list and detailed citations.
This Report Answers
- What segments shape HD mapping & localization for AVs across technology, application, offering, end-use, and pricing model?
- How do automakers evaluate map freshness and localization accuracy during vehicle-program selection?
- How do country CAGRs differ across profiled automotive markets?
- What companies compete through road intelligence, lane models, and localization capability?
- How are forecasts validated through hybrid bottom-up and top-down analysis?
- What operating evidence supports crowdsourced and survey-grade mapping decisions?
- How do regulatory duties affect map validation and incident records?
- What provider capabilities support long-term automotive integration?
- How do simulation and data-format partnerships extend HD map applications?
Frequently Asked Questions
What supports demand in HD mapping & localization for AVs market?
Automated-driving programs require lane geometry and road-rule context beyond immediate sensor range. Continuing map updates preserve route accuracy across vehicle software releases.
Who are key players in HD mapping & localization for AVs market?
Mobileye Global Inc. and Dynamic Map Platform Co., Ltd. among others, support principal supplier activity. Competition reflects road-intelligence scale and automotive integration.
What restraint affects HD mapping & localization for AVs market?
Validation expense rises as roads change and regional data rules require separate evidence. Providers also maintain synchronized records for safety review and software updates.
Why do executives track HD mapping & localization for AVs market?
Executives track map capability since automated-driving performance relies on current road context. Provider continuity influences vehicle launch timing and geographic expansion.
What business problem does HD mapping & localization for AVs market address?
HD maps extend vehicle awareness beyond current sensor sightlines and support precise lane positioning. Localization software compares vehicle movement against mapped road features during automated operation.
What do engineering teams evaluate prior to selecting providers?
Engineering teams examine sensor compatibility and regional coverage. Integration support and documentation quality guide final provider reviews.
How do providers build long-term program confidence?
Providers build confidence through consistent map refreshes and automotive-grade interface support. Clear technical records and responsive issue resolution support recurring vehicle programs using automotive navigation solutions.
Preview the report firsthand - request a free sample
Get SampleGet the brochure for pricing and purchase details.
Get PDFTable of Content
- Key Takeaways
- Market Size and CAGR
- Top Growth Driver
- Fastest Growing Segment
- Leading Region
- Key Companies
- Emerging Opportunities
- Executive Summary
- Global Market Outlook
- Demand-side Trends
- Supply-side Trends
- Technology Roadmap Analysis
- Analysis and Recommendations
- Analyst Perspective (What is happening? Why now? What should investors know?)
- Key Questions Answered
- How large is the market?
- What is the CAGR?
- What are key trends?
- Which region dominates?
- Who are the leaders?
- Market Overview
- Market Coverage / Taxonomy
- Market Definition / Scope / Limitations
- Research Methodology
- Chapter Orientation
- Analytical Lens and Working Hypotheses
- Market Structure, Signals, and Trend Drivers
- Benchmarking and Cross-market Comparability
- Market Sizing, Forecasting, and Opportunity Mapping
- Research Design and Evidence Framework
- Desk Research Programme (Secondary Evidence)
- Expert Input and Fieldwork (Primary Evidence)
- Tooling, Models, and Reference Databases
- Data Engineering and Model Build
- Quality Assurance and Audit Trail
- Market Background
- Market Dynamics (Drivers, Restraints, Opportunity, Trends)
- Scenario Forecast (Optimistic, Likely, Conservative)
- Impact Analysis
- AI Impact
- Sustainability Impact
- Regulatory Impact
- Technology Impact
- Consumer / Buyer Analysis
- Purchase Drivers
- Adoption Barriers
- Buyer Journey
- Opportunity Map Analysis
- Product Life Cycle Analysis
- Supply Chain Analysis
- Investment Feasibility Matrix
- Value Chain Analysis
- PESTLE and Porter's Analysis
- Regulatory Landscape
- Regional Parent Market Outlook
- Production and Consumption Statistics
- Import and Export Statistics
- Global Market Analysis and Forecast, 2021 to 2036
- Historical Market Size Value (USD Bn) Analysis, 2021 to 2025
- Current and Future Market Size Value (USD Bn) Projections, 2026 to 2036
- Y-o-Y Growth Trend Analysis
- Absolute $ Opportunity Analysis
- Global Market Pricing Analysis, 2021 to 2036
- Global Market Analysis and Forecast, By Technology, 2021 to 2036
- Introduction / Key Findings
- Historical Market Size Value (USD Bn) Analysis By Technology, 2021 to 2025
- Current and Future Market Size Value (USD Bn) Analysis and Forecast By Technology, 2026 to 2036
- Crowdsourced mapping
- Survey-grade mapping
- Localization software
- Map maintenance & updates
- Crowdsourced mapping
- Y-o-Y Growth Trend Analysis By Technology, 2021 to 2025
- Absolute $ Opportunity Analysis By Technology, 2026 to 2036
- Global Market Analysis and Forecast, By Application, 2021 to 2036
- Introduction / Key Findings
- Historical Market Size Value (USD Bn) Analysis By Application, 2021 to 2025
- Current and Future Market Size Value (USD Bn) Analysis and Forecast By Application, 2026 to 2036
- L2+-L3 highway assist
- Robotaxi operations
- Trucking corridors
- Urban delivery
- L2+-L3 highway assist
- Y-o-Y Growth Trend Analysis By Application, 2021 to 2025
- Absolute $ Opportunity Analysis By Application, 2026 to 2036
- Global Market Analysis and Forecast, By Offering, 2021 to 2036
- Introduction / Key Findings
- Historical Market Size Value (USD Bn) Analysis By Offering, 2021 to 2025
- Current and Future Market Size Value (USD Bn) Analysis and Forecast By Offering, 2026 to 2036
- Data - content licensing
- Software
- Services
- Data - content licensing
- Y-o-Y Growth Trend Analysis By Offering, 2021 to 2025
- Absolute $ Opportunity Analysis By Offering, 2026 to 2036
- Global Market Analysis and Forecast, By End-use, 2021 to 2036
- Introduction / Key Findings
- Historical Market Size Value (USD Bn) Analysis By End-use, 2021 to 2025
- Current and Future Market Size Value (USD Bn) Analysis and Forecast By End-use, 2026 to 2036
- Passenger car OEMs
- AV developers
- Tier-1 - navigation
- Commercial fleets
- Passenger car OEMs
- Y-o-Y Growth Trend Analysis By End-use, 2021 to 2025
- Absolute $ Opportunity Analysis By End-use, 2026 to 2036
- Global Market Analysis and Forecast, By Pricing Model, 2021 to 2036
- Introduction / Key Findings
- Historical Market Size Value (USD Bn) Analysis By Pricing Model, 2021 to 2025
- Current and Future Market Size Value (USD Bn) Analysis and Forecast By Pricing Model, 2026 to 2036
- Per-vehicle license
- Subscription
- Enterprise contracts
- Pilot programs
- Per-vehicle license
- Y-o-Y Growth Trend Analysis By Pricing Model, 2021 to 2025
- Absolute $ Opportunity Analysis By Pricing Model, 2026 to 2036
- Global Market Analysis and Forecast, By Region, 2021 to 2036
- Introduction
- Historical Market Size Value (USD Bn) Analysis By Region, 2021 to 2025
- Current Market Size Value (USD Bn) Analysis and Forecast By Region, 2026 to 2036
- North America
- Latin America
- Western Europe
- Eastern Europe
- East Asia
- South Asia and Pacific
- Middle East & Africa
- Market Attractiveness Analysis By Region
- North America Market Analysis and Forecast, By Country, 2021 to 2036
- Historical Market Size Value (USD Bn) Trend Analysis By Market Taxonomy, 2021 to 2025
- Market Size Value (USD Bn) Forecast By Market Taxonomy, 2026 to 2036
- By Country
- USA
- Canada
- By Technology
- By Application
- By Offering
- By End-use
- By Pricing Model
- By Country
- Market Attractiveness Analysis
- By Country
- By Technology
- By Application
- By Offering
- By End-use
- By Pricing Model
- Key Takeaways
- Latin America Market Analysis and Forecast, By Country
- Historical Market Size Value (USD Bn) Trend Analysis By Market Taxonomy, 2021 to 2025
- Market Size Value (USD Bn) Forecast By Market Taxonomy, 2026 to 2036
- By Country
- Brazil
- Mexico
- Chile
- Rest of Latin America
- By Technology
- By Application
- By Offering
- By End-use
- By Pricing Model
- By Country
- Market Attractiveness Analysis
- By Country
- By Technology
- By Application
- By Offering
- By End-use
- By Pricing Model
- Key Takeaways
- Western Europe Market Analysis and Forecast, By Country
- Historical Market Size Value (USD Bn) Trend Analysis By Market Taxonomy, 2021 to 2025
- Market Size Value (USD Bn) Forecast By Market Taxonomy, 2026 to 2036
- By Country
- Germany
- UK
- Italy
- Spain
- France
- Nordic
- BENELUX
- Rest of Western Europe
- By Technology
- By Application
- By Offering
- By End-use
- By Pricing Model
- By Country
- Market Attractiveness Analysis
- By Country
- By Technology
- By Application
- By Offering
- By End-use
- By Pricing Model
- Key Takeaways
- Eastern Europe Market Analysis and Forecast, By Country
- Historical Market Size Value (USD Bn) Trend Analysis By Market Taxonomy, 2021 to 2025
- Market Size Value (USD Bn) Forecast By Market Taxonomy, 2026 to 2036
- By Country
- Russia
- Poland
- Hungary
- Balkan & Baltic
- Rest of Eastern Europe
- By Technology
- By Application
- By Offering
- By End-use
- By Pricing Model
- By Country
- Market Attractiveness Analysis
- By Country
- By Technology
- By Application
- By Offering
- By End-use
- By Pricing Model
- Key Takeaways
- East Asia Market Analysis and Forecast, By Country
- Historical Market Size Value (USD Bn) Trend Analysis By Market Taxonomy, 2021 to 2025
- Market Size Value (USD Bn) Forecast By Market Taxonomy, 2026 to 2036
- By Country
- China
- Japan
- South Korea
- By Technology
- By Application
- By Offering
- By End-use
- By Pricing Model
- By Country
- Market Attractiveness Analysis
- By Country
- By Technology
- By Application
- By Offering
- By End-use
- By Pricing Model
- Key Takeaways
- South Asia and Pacific Market Analysis and Forecast, By Country
- Historical Market Size Value (USD Bn) Trend Analysis By Market Taxonomy, 2021 to 2025
- Market Size Value (USD Bn) Forecast By Market Taxonomy, 2026 to 2036
- By Country
- India
- ASEAN
- Australia & New Zealand
- Rest of South Asia and Pacific
- By Technology
- By Application
- By Offering
- By End-use
- By Pricing Model
- By Country
- Market Attractiveness Analysis
- By Country
- By Technology
- By Application
- By Offering
- By End-use
- By Pricing Model
- Key Takeaways
- Middle East & Africa Market Analysis and Forecast, By Country
- Historical Market Size Value (USD Bn) Trend Analysis By Market Taxonomy, 2021 to 2025
- Market Size Value (USD Bn) Forecast By Market Taxonomy, 2026 to 2036
- By Country
- Kingdom of Saudi Arabia
- Other GCC Countries
- Türkiye
- South Africa
- Other African Union
- Rest of Middle East & Africa
- By Technology
- By Application
- By Offering
- By End-use
- By Pricing Model
- By Country
- Market Attractiveness Analysis
- By Country
- By Technology
- By Application
- By Offering
- By End-use
- By Pricing Model
- Key Takeaways
- Key Countries Market Analysis
- USA
- Pricing Analysis
- Market Share Analysis, 2025
- By Technology
- By Application
- By Offering
- By End-use
- By Pricing Model
- Canada
- Pricing Analysis
- Market Share Analysis, 2025
- By Technology
- By Application
- By Offering
- By End-use
- By Pricing Model
- Mexico
- Pricing Analysis
- Market Share Analysis, 2025
- By Technology
- By Application
- By Offering
- By End-use
- By Pricing Model
- Brazil
- Pricing Analysis
- Market Share Analysis, 2025
- By Technology
- By Application
- By Offering
- By End-use
- By Pricing Model
- Chile
- Pricing Analysis
- Market Share Analysis, 2025
- By Technology
- By Application
- By Offering
- By End-use
- By Pricing Model
- Germany
- Pricing Analysis
- Market Share Analysis, 2025
- By Technology
- By Application
- By Offering
- By End-use
- By Pricing Model
- UK
- Pricing Analysis
- Market Share Analysis, 2025
- By Technology
- By Application
- By Offering
- By End-use
- By Pricing Model
- Italy
- Pricing Analysis
- Market Share Analysis, 2025
- By Technology
- By Application
- By Offering
- By End-use
- By Pricing Model
- Spain
- Pricing Analysis
- Market Share Analysis, 2025
- By Technology
- By Application
- By Offering
- By End-use
- By Pricing Model
- France
- Pricing Analysis
- Market Share Analysis, 2025
- By Technology
- By Application
- By Offering
- By End-use
- By Pricing Model
- India
- Pricing Analysis
- Market Share Analysis, 2025
- By Technology
- By Application
- By Offering
- By End-use
- By Pricing Model
- ASEAN
- Pricing Analysis
- Market Share Analysis, 2025
- By Technology
- By Application
- By Offering
- By End-use
- By Pricing Model
- Australia & New Zealand
- Pricing Analysis
- Market Share Analysis, 2025
- By Technology
- By Application
- By Offering
- By End-use
- By Pricing Model
- China
- Pricing Analysis
- Market Share Analysis, 2025
- By Technology
- By Application
- By Offering
- By End-use
- By Pricing Model
- Japan
- Pricing Analysis
- Market Share Analysis, 2025
- By Technology
- By Application
- By Offering
- By End-use
- By Pricing Model
- South Korea
- Pricing Analysis
- Market Share Analysis, 2025
- By Technology
- By Application
- By Offering
- By End-use
- By Pricing Model
- Russia
- Pricing Analysis
- Market Share Analysis, 2025
- By Technology
- By Application
- By Offering
- By End-use
- By Pricing Model
- Poland
- Pricing Analysis
- Market Share Analysis, 2025
- By Technology
- By Application
- By Offering
- By End-use
- By Pricing Model
- Hungary
- Pricing Analysis
- Market Share Analysis, 2025
- By Technology
- By Application
- By Offering
- By End-use
- By Pricing Model
- Kingdom of Saudi Arabia
- Pricing Analysis
- Market Share Analysis, 2025
- By Technology
- By Application
- By Offering
- By End-use
- By Pricing Model
- Türkiye
- Pricing Analysis
- Market Share Analysis, 2025
- By Technology
- By Application
- By Offering
- By End-use
- By Pricing Model
- South Africa
- Pricing Analysis
- Market Share Analysis, 2025
- By Technology
- By Application
- By Offering
- By End-use
- By Pricing Model
- USA
- Market Structure Analysis
- Competition Dashboard
- Competition Benchmarking
- Market Share Analysis of Top Players
- By Regional
- By Technology
- By Application
- By Offering
- By End-use
- By Pricing Model
- Emerging Startups
- Innovation Benchmarking
- Competition Analysis
- Competition Deep Dive
- Mobileye REM (IL)
- Overview
- Product Portfolio
- Profitability by Market Segments
- Sales Footprint
- Strategy Overview
- Marketing Strategy
- Product Strategy
- Channel Strategy
- HERE (NL)
- TomTom (NL)
- Dynamic Map Platform (JP)
- Mobileye REM (IL)
- Case Studies
- Success Stories
- Recent Developments
- Competition Deep Dive
- Assumptions & Acronyms Used


