Solid State LiDAR Sensor Market Size and Share Forecast Outlook 2025 to 2035

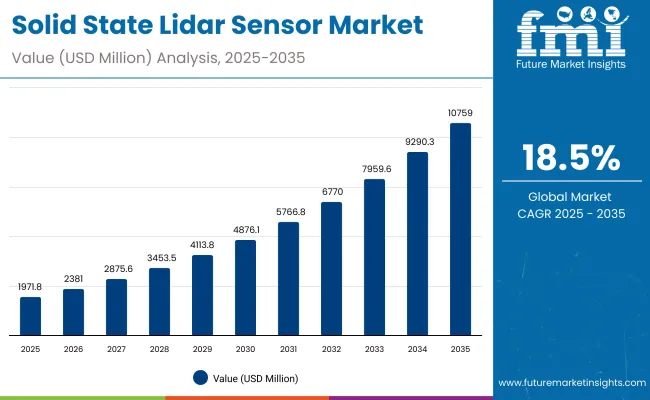
The global solid state LiDAR sensor market is estimated to grow from USD 1,971.8 million in 2025 to USD 10,759.0 million by 2035, representing an absolute increase of USD 8,787.2 million or 445.5% over the forecast period. The market is expected to expand at a compound annual growth rate (CAGR) of 18.5%, with the total market size increasing by nearly 5.5X between 2025 and 2035.
Quick Stats for Solid State LiDAR Sensor Market

  • Industry Value (2025): USD 1,971.8 million
  • Forecast Value (2035): USD 10,759.0 million
  • Forecast CAGR: 18.5%
  • Leading Technology (2025): MEMS LiDAR (35% share)
  • Key Growth Application: Autonomous Vehicles and ADAS (55% share)
  • Top Key Players:Hesai Technology Co., Ltd., Luminar Technologies, Inc., Innoviz Technologies Ltd., RoboSense, Ouster, Inc.

Solid State Lidar Sensor Market

Metric Value
Industry Size (2025E) USD 1,971.8 million
Industry Size (2035F) USD 10,759.0 million
CAGR (2025 to 2035) 18.5%

Between 2025 and 2030, the market is projected to increase from USD 1,971.8 million to USD 4,876.1 million, contributing an incremental value of USD 2,904.3 million. Growth during this phase will be largely driven by the accelerated deployment of advanced driver-assistance systems (ADAS) and autonomous driving features in premium passenger cars. Key OEMs are integrating solid state LiDAR sensors into forward-facing and surround-view systems, aiming to improve safety, lane keeping, and adaptive cruise control. Parallel expansion in autonomous last-mile delivery bots, shuttle vehicles, and mining trucks is also expected to support volume ramp-ups.

From 2030 to 2035, the market is set to rise from USD 4,876.1 million to USD 10,759.0 million, contributing an additional USD 5,882.9 million in value. This second phase of growth will be led by the integration of LiDAR into cost-sensitive mid-range vehicles, smart city infrastructure, robotics, and logistics automation. Mass-market electrification, 3D mapping for urban planning, and indoor/outdoor warehouse automation will support broader adoption. Cost declines from MEMS and optical phased array technologies will enable more compact, low-power, and ruggedized LiDAR platforms to enter mainstream applications across multiple sectors.

Between 2020 and 2025, the global solid state LiDAR sensor market expanded from USD 935.2 million to USD 1,971.8 million, marking a total increase of USD 1,036.6 million or 110.9%, at a compound annual growth rate (CAGR) of 16.0%. This rapid early-stage expansion was fueled by escalating demand for reliable and cost-efficient LiDAR technologies that could meet the durability and scalability requirements of automotive, robotics, and industrial automation environments.

A significant shift occurred during this period as manufacturers transitioned from bulky, mechanical LiDARs to chip-based and MEMS-enabled solid state formats. These systems offered enhanced resilience, lower production costs, and the ability to be integrated into the body structure of vehicles and robots without moving parts. Automakers such as Volvo, Mercedes-Benz, and Honda initiated pilot integrations of solid state LiDAR units for limited-level autonomous driving features, especially in highway scenarios.

Technological milestones included the commercial availability of solid state LiDARs based on flash and optical phased array (OPA) architectures, offering increased resolution and a wider field of view. Players like Innoviz Technologies, Aeva, and Luminar introduced units with improved point density, detection range, and multi-object tracking capabilities. Meanwhile, chipmakers and sensor integrators began developing edge-processing-enabled LiDAR modules for real-time 3D perception tasks.

Regulatory bodies in the USA, Europe, and East Asia began supporting the use of LiDAR in new vehicle safety standards and traffic automation guidelines, giving a strong signal to OEMs and Tier 1 suppliers to accelerate R&D investments. Non-automotive applications such as security surveillance, warehouse automation, and smart agriculture also began to adopt compact LiDAR sensors for cost-sensitive use cases.

By the end of 2025, the solid state LiDAR sensor market positioned itself as a foundational sensor technology across both advanced mobility systems and intelligent infrastructure, establishing a robust platform for accelerated deployment in the coming decade.

Why the Market is Growing?

The global solid state LiDAR sensor market is growing at a strong pace due to its increasing deployment in safety-critical systems, autonomous mobility, and next-generation industrial automation. Unlike mechanical LiDARs, solid state variants offer greater durability, cost efficiency, and integration flexibility, which make them suitable for high-volume applications. The push for full autonomy in passenger vehicles, robotaxis, and commercial fleets has placed solid state LiDAR at the center of perception system strategies.

Demand is also expanding in non-automotive sectors, where smart infrastructure projects, robotic platforms, and warehouse automation systems are adopting solid state LiDAR to enable 3D sensing, obstacle detection, and high-accuracy mapping. These use cases are driving volume-based manufacturing and price rationalization, encouraging adoption across medium- and low-tier applications. The growth trajectory is further reinforced by VC investments, strategic OEM partnerships, and regulatory incentives.

High-resolution scanning, lower latency, edge-processing capabilities, and increasing compatibility with AI-based platforms are also enabling solid state LiDAR to move beyond niche markets. Tier 1 suppliers are consolidating their sensor portfolios around scalable, solid state architectures that are compact, power-efficient, and optimized for software-defined vehicles.

Segmentation Overview

The market is segmented by type into MEMS LiDAR, Flash LiDAR, Optical Phased Array LiDAR, and Scanning/Phased Array LiDAR. Each type offers distinct advantages in terms of beam steering method, cost, and integration feasibility, making them suitable for varied autonomy levels and robotic functions. Range capabilities are classified into short, medium, and long range, each catering to specific applications such as indoor navigation, highway autopilot, or large-scale mapping.

Application-wise, the market spans autonomous vehicles and ADAS, robotics, drones and UAVs, industrial automation, and various infrastructure and environmental monitoring tasks. At the component level, the value chain comprises laser sources, receivers, optics, and processing units, which together enable precision scanning, real-time perception, and advanced decision-making.
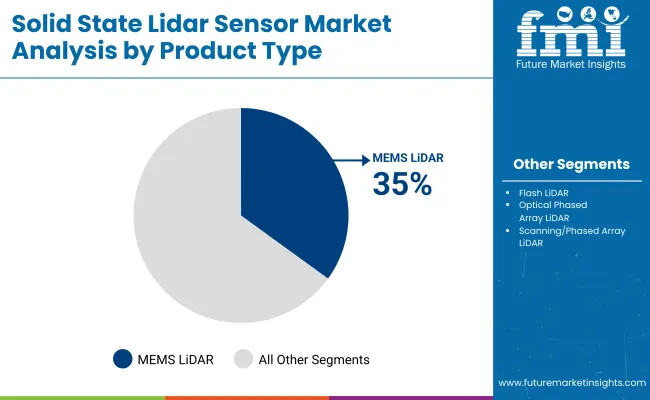
MEMS LiDAR to remain dominant owing to compact structure and scalability

Solid State Lidar Sensor Market By Product Type

MEMS-based solid state LiDAR systems are expected to command 35% of the global market share in 2025. Their compact architecture, low power consumption, and cost-efficient design make them ideal for integration into autonomous vehicles and driver assistance systems. MEMS LiDAR enables beam steering without mechanical components, improving reliability and reducing maintenance.

OEMs prefer MEMS variants due to their scalability for Level 2 to Level 4 autonomy in passenger and commercial vehicles. The increasing rollout of electric robotaxis and shuttles has further supported adoption, particularly across China, Japan, and parts of the USA Additionally, suppliers are enhancing MEMS packaging with robust thermal management, enabling outdoor deployment in drones and robotics.
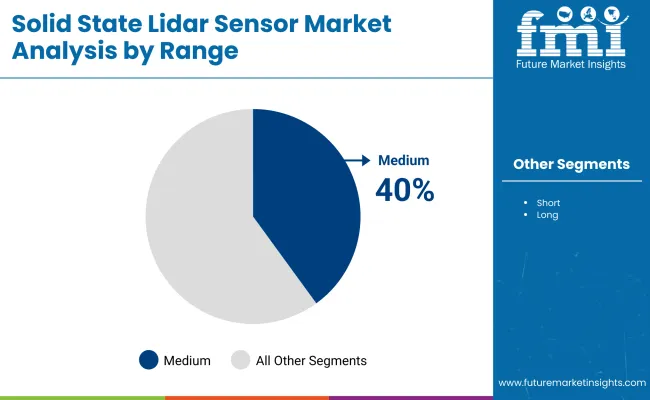
Medium-range sensors to lead as balanced coverage and cost optimization align with ADAS needs

Solid State Lidar Sensor Market By Range

Medium-range solid state LiDAR systems are projected to hold a 40% share of the total market in 2025, emerging as the preferred option for highway and urban driving assistance. These sensors typically operate within 20 to 100 meters, balancing detection distance with high-resolution object tracking. OEMs have increasingly integrated medium-range sensors in blind spot detection, lane change assistance, and collision warning modules.

Their use is also expanding in last-mile autonomous delivery bots and warehouse robots requiring navigation in confined zones. The continued advancement in ASIC integration and real-time signal processing is improving frame rates and resolution at medium range, contributing to faster object classification. Medium-range sensors are now being co-located with radar and vision sensors for enhanced 360-degree awareness in ADAS platforms.
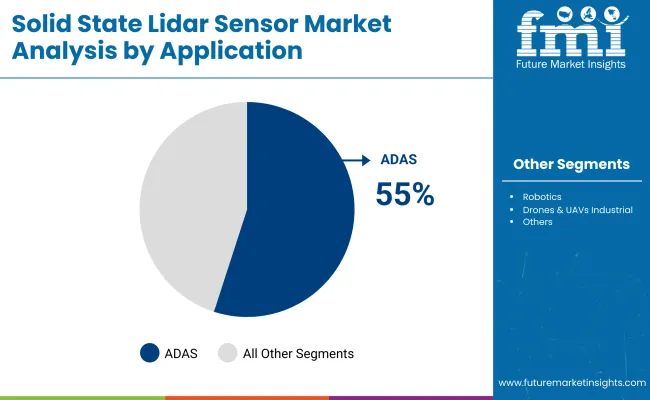
Autonomous vehicles and ADAS drive the majority of sensor installations globally

Solid State Lidar Sensor Market By Application

The autonomous vehicle and ADAS segment is expected to contribute 55% to the global demand for solid state LiDAR sensors in 2025. This segment is witnessing widespread adoption of LiDAR as a critical redundancy sensor for camera and radar-based systems. OEMs are increasingly deploying LiDAR across Level 2+ and Level 3 platforms, particularly in highway pilot and self-parking modules.

Expansion of sensor suites in premium models and rising regulatory pressure for active safety systems are accelerating demand. Automakers like Volvo, Honda, and Hyundai have committed to integrating LiDAR as a standard component in upcoming autonomous-ready models. Additionally, collaborations between LiDAR manufacturers and automotive chipmakers are enhancing sensor-fusion capabilities for real-time environmental modeling.
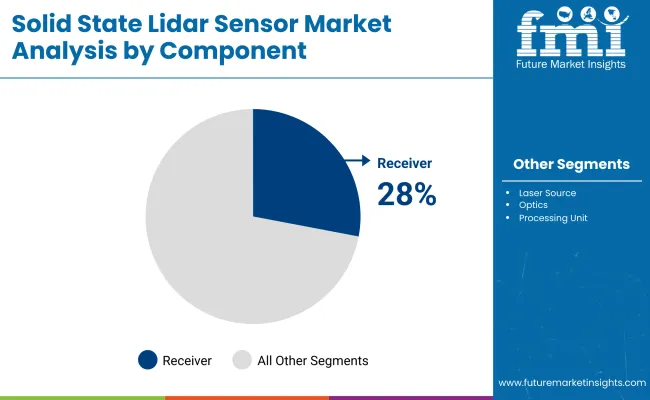
Laser sources and processing units jointly lead LiDAR component demand

Solid State Lidar Sensor Market By Component

Laser sources and processing units are projected to collectively represent 28% of component-level demand in 2025, each holding approximately 25%. The laser source is central to the LiDAR’s performance, determining beam wavelength, divergence, and eye safety. Suppliers are innovating with eye-safe 905nm and 1550nm lasers to enable longer range without compromising user safety.

On the other hand, processing units have emerged as key differentiators, supporting advanced algorithms for object detection, segmentation, and classification. Edge AI capabilities are increasingly integrated within LiDAR systems to enable real-time processing directly on the sensor. Partnerships with chipmakers like NVIDIA and Qualcomm are helping LiDAR vendors embed greater processing power into smaller footprints, essential for automotive and drone applications.

Key Trends Shaping the Market

The global solid state LiDAR market is being driven by a combination of performance improvements, production scalability, and integration readiness across mobility, industrial, and infrastructure domains. Solid state architectures eliminate moving parts, resulting in higher mechanical reliability and extended service life. This attribute makes them highly suitable for autonomous vehicles, drones, and robotic systems where consistent environmental sensing is crucial.

Automotive Integration Shifts Toward Cost-Efficient LiDARs

OEMs are actively moving toward affordable LiDAR integration across Level 2+ and Level 3 autonomous platforms. Solid state variants are increasingly chosen over mechanical alternatives due to their compact design, lower BOM (bill of materials), and ease of embedded positioning in bumpers, headlamps, and rooftop modules. Automakers in Europe, China, and North America are partnering with LiDAR suppliers for tailored modules aligned with ADAS and highway pilot requirements.

Industrial and Infrastructure Adoption on the Rise

Warehousing, smart cities, and industrial automation sectors are deploying solid state LiDARs for tasks including asset localization, perimeter detection, and traffic flow optimization. Fixed-mount LiDARs with wide field-of-view (FoV) and edge AI processing capabilities are being incorporated into smart intersections, ports, and railway safety systems, broadening the market beyond automotive.

M&A and Strategic Investments Accelerating Commercialization

Industry consolidation is reshaping the supplier ecosystem. Key LiDAR firms are entering into mergers or forming partnerships with Tier 1 automotive suppliers, chipmakers, or contract manufacturers to scale operations and reduce per-unit costs. For instance, LiDAR startups with proprietary ASICs or proprietary beam-steering tech are being acquired to secure patent portfolios and accelerate time to market.

Software-Defined Perception Systems Enhancing Value Proposition

Increasing reliance on software-defined sensors is making LiDAR units smarter, more adaptable, and upgradable over time. Solid state LiDARs now come bundled with perception algorithms, enabling features like object classification, lane modeling, and 3D semantic segmentation. These functionalities increase the utility of LiDAR data in real-time decision-making across mobility and robotics.

Europe Market Split by Country

The Europe solid state LiDAR market is projected to expand from USD 488.1 million in 2025 to USD 2,160.4 million by 2035, growing at a CAGR of 16.0%. Germany, France, and the UK are poised to lead regional adoption, driven by strong automotive manufacturing bases and early-stage ADAS regulation enforcement.

Germany is expected to increase its share from 22.0% in 2025 to 25.2% by 2035 due to its leadership in autonomous mobility and partnerships between OEMs and LiDAR startups. France and the UK are projected to maintain consistent shares, supported by logistics automation and smart infrastructure initiatives. BENELUX countries are witnessing fast adoption in port logistics and smart city pilot deployments, while Rest of Europe is expected to contribute a quarter of the regional demand by 2035 due to broader integration into industrial automation and rail safety applications.
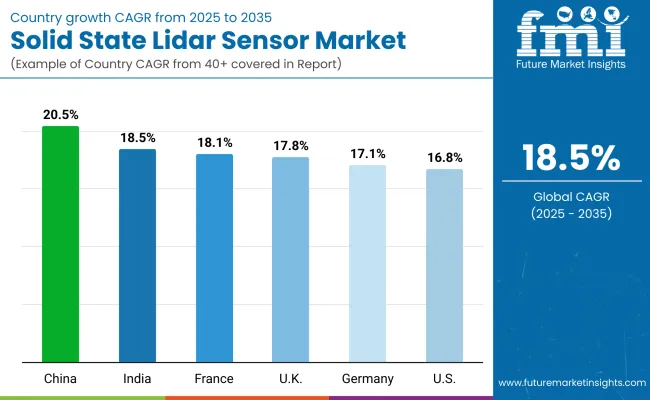
Key Countries Growth Outlook

Country Wise Analysis Solid State Lidar Sensor Market

Rapid Adoption Across China to Cement Global Lead

China is forecast to record the highest CAGR of 20.5% during the 2025 to 2035 period, driven by large-scale deployment in autonomous mobility pilots, smart city initiatives, and industrial robotics. A rising number of government-backed projects, together with cost declines in domestic lidar manufacturing, is accelerating adoption. Partnerships between lidar suppliers and domestic EV brands are further reinforcing the country’s position as a volume leader.

  • Strong investments in AI-integrated mobility programs
  • High-volume electric vehicle manufacturing base
  • Rising sensor export demand from Asia and Europe
  • Aggressive pricing and localization by domestic brands

India’s Digital Mobility Push to Drive Market Expansion

India is expected to grow at a CAGR of 18.5% over the forecast period, benefitting from its expanding electric vehicle ecosystem and progressive safety regulations. Government incentives under FAME-II, along with domestic electronics manufacturing schemes, are supporting lidar integration in passenger vehicles, metro infrastructure, and UAV navigation platforms.

  • Government incentives boosting sensor-enabled mobility
  • Rise in UAV adoption for precision agriculture and logistics
  • Urban transport modernization with autonomous safety layers
  • Growth in lidar-enabled industrial inspection platforms

France Ramping Up Deployment in Automotive and Rail

France is projected to witness a CAGR of 18.1% between 2025 and 2035, led by demand from automotive OEMs and public transport authorities. Increasing investment in autonomous trams and metro systems, alongside retrofitting in logistics hubs and airports, is supporting sustained demand. The market is further bolstered by favorable data privacy and safety compliance frameworks.

  • Growth in autonomous mobility trials and infrastructure retrofits
  • Strong alignment with EU safety and data policies
  • Funding for domestic lidar R&D consortia
  • Lidar adoption in last-mile logistics

UK Strengthening Lidar Use in Smart Infrastructure

The United Kingdom is projected to grow at a CAGR of 17.8%, with key growth stemming from smart city integration, drone-based surveying, and defense applications. The UK’s focus on resilient infrastructure and vehicle safety technologies is increasing procurement of solid state lidar systems by public agencies and OEMs alike.

  • Strong institutional support for autonomous trials
  • Lidar deployment in rail networks and road condition monitoring
  • Growth in defense tech with advanced terrain scanning systems
  • Public-private R&D partnerships on automotive safety

Germany Driving Steady Integration in Premium Vehicle Segment

Germany is expected to grow at a CAGR of 17.1%, with premium automotive manufacturers integrating solid state lidar sensors in upcoming EV models. OEM collaborations with sensor tech firms are targeting long-range, high-precision lidar for highway autonomy and advanced ADAS. Industrial robotics and factory safety also offer additional growth levers.

  • Tier-1 OEM demand for long-range lidar
  • Rise in Level 3 ADAS integration across luxury brands
  • Industry 4.0 deployments in precision robotics
  • Collaborations with optics and photonics companies

USA Market Shifting Toward Industrial and Security Applications

The United States is projected to register a CAGR of 16.8%, with strong interest in solid state lidar for security surveillance, warehouse automation, and autonomous fleets. While AV testing slowed temporarily, lidar demand has pivoted to logistics, port monitoring, and facility perimeter detection systems. Partnerships with federal agencies continue to shape long-term demand.

  • Resurgence of lidar interest in warehouse and security verticals
  • High-volume lidar usage in robotics and drones
  • Government investment in critical infrastructure monitoring
  • Startups driving price innovation and compact format designs

Medium Range Solutions Dominate Lidar Deployments in Japan

Japan’s solid state lidar market is led by medium-range sensors, which are estimated to hold a 47% share in 2025. These sensors are increasingly favored in urban mobility applications, including autonomous shuttles, robo-taxis, and ADAS for passenger vehicles operating in high-traffic city environments. Short-range lidar, with a 28% share, is primarily utilized in robotic arms, forklifts, and manufacturing floor automation, while long-range lidar (25%) is gradually being integrated into next-generation highway-driving systems in Japanese EV platforms.

  • Focus on urban mobility requires high-resolution, medium-range lidar
  • Short-range lidar integrated in service robots and logistics automation
  • Long-range adoption rising for highway assistance and Level 3 ADAS
  • Localization and miniaturization efforts driving market penetration

MEMS-Based LiDAR to Lead South Korean Sensor Landscape

In South Korea, MEMS (Micro-Electro-Mechanical Systems) LiDAR is projected to dominate with a 38% share in 2025, driven by its compact form factor and high manufacturability. These systems are favored in electric vehicles and consumer-grade robots. Flash LiDAR follows with a 26% share, supported by demand in mobile robotics and automated indoor navigation. Optical Phased Array (OPA) LiDAR, holding 20%, is gaining ground in precision applications, especially in surveillance and AR systems. Scanning/Phased Array LiDAR, accounting for 16%, is witnessing limited but specialized deployment in automotive R&D and defense-grade mapping systems.
  • MEMS LiDAR leveraged for its size, cost, and energy efficiency
  • Flash LiDAR prominent in warehouse automation and robotics
  • OPA LiDAR suited for compact, high-precision AR/VR applications
  • Scanning lidar being tested in smart highway and perimeter monitoring

Competition Outlook

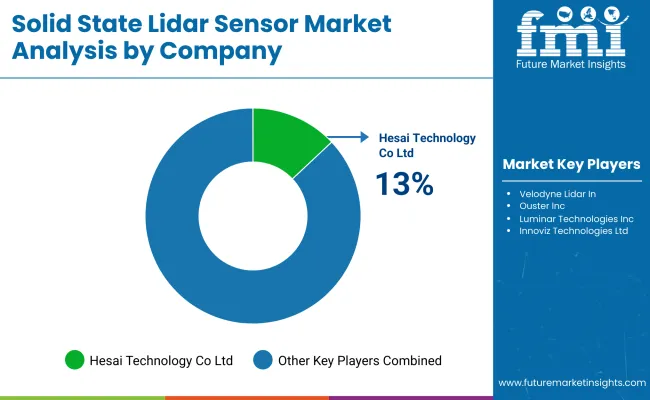
Solid State Lidar Sensor Market By Company

Competition in the solid-state LiDAR market is being driven by rapid technological advancements and strategic product launches. Companies are introducing sensors with MEMS-based mirrors, Time-of-Flight integration, and advanced beam-steering technologies to enhance detection accuracy, reliability, and range for ADAS, autonomous vehicles, industrial automation, and robotics.

The market is witnessing intensified rivalry as firms focus on compact, high-precision designs, in-house software stacks, and proprietary chip integration to differentiate offerings. Simultaneously, early commercialization of automotive- and consumer-grade systems is accelerating adoption, while investments in sensor miniaturization, cost reduction, and interoperability are shaping the competitive landscape across global LiDAR applications.

  • In March 2024, Infineon Technologies introduced a new solid-state LiDAR platform integrating MEMS mirrors and Time-of-Flight (ToF) technology. The solution aims to improve detection in ADAS and autonomous driving systems.
  • In May 2024, Lumotive and Hokuyo jointly announced the commercial release of the world’s first 3D LiDAR sensor featuring true solid-state beam steering, marking a milestone in industrial-grade LiDAR systems for automation and mobile robotics.
  • In May 2025, Namuga unveiled its STELLA 2 compact solid-state LiDAR system at the Embedded Vision Summit. The sensor is powered by Lumotive’s Light Control Metasurface (LCM) beam steering technology, delivering precise 3D sensing for consumer electronics, automotive, and robotics.
  • In January 2025, RoboSense launched its next-generation RS-LiDAR-E1, a true solid-state LiDAR designed for automotive-grade deployment. It features advanced perception capabilities for L3+ autonomous vehicles and is built with RoboSense’s in-house chip and software stack.

Companies

  • Hesai Technology Co., Ltd.
  • Velodyne Lidar, Inc.
  • Ouster, Inc.
  • Luminar Technologies, Inc.
  • Innoviz Technologies Ltd.
  • RoboSense (Suteng Innovation Technology Co., Ltd.
  • MicroVision,Inc.
  • LeddarTech Inc.
  • Quanergy Systems, Inc.
  • Blickfeld GmbH
  • Aeva Technologies, Inc.
  • Xenomatix
  • Cepton Technologies, Inc.
  • Livox Technology Limited
  • Benewake (Beijing) Co., Ltd.

Scope of the Report

Item Value
Quantitative Units Volume (Units), Value (USD Million), CAGR (%), Y-o-Y Growth (%)
By Type MEMS LiDAR, Flash LiDAR, Optical Phased Array LiDAR, Scanning/Phased Array LiDAR
By Range Short Range, Medium Range, Long Range
By Application Automotive, Robotics & Automation, Consumer Electronics, Industrial Equipment, Mapping & Surveying, Others
Market Participants OEMs, Tier 1 Suppliers, Technology Integrators, Research Institutes
By Region North America, Latin America, Eastern Europe, Western Europe, East Asia, South Asia & Pacific, Middle East & Africa
Countries Covered USA, Canada, Mexico, Brazil, Germany, UK, France, Italy, Spain, BENELUX, Russia, Poland, Hungary, China, Japan, South Korea, India, Türkiye , GCC, South Africa

Key Segments

By Product Type:

  • MEMS LiDAR
  • Flash LiDAR
  • Optical Phased Array LiDAR
  • Scanning/Phased Array LiDAR

By Application:

  • ADAS
  • Robotics
  • Drones & UAVs
  • Industrial
  • Others

By Component:

  • Laser Source
  • Receiver
  • Optics
  • Processing Value (USD Million) & Volume (Units)

By Range:

  • Short Range
  • Medium Range
  • Long Range

By Region:

  • North America
  • Latin America
  • Western Europe
  • East Asia
  • South Asia & Pacific
  • Eastern Europe
  • MEA

Table of Content

  1. Executive Summary
    • Global Market Outlook
    • Demand-side Trends
    • Supply-side Trends
    • Technology Roadmap Analysis
    • Analysis and Recommendations
  2. Market Overview
    • Market Coverage / Taxonomy
    • Market Definition / Scope / Limitations
  3. Market Background
    • Market Dynamics
      • Drivers
      • Restraints
      • Opportunity
      • Trends
    • Scenario Forecast
      • Demand in Optimistic Scenario
      • Demand in Likely Scenario
      • Demand in Conservative Scenario
    • Supply Side Participants and their Roles
      • Producers
      • Mid-Level Participants
      • Wholesalers and Distributors
  4. Value Chain Analysis
    • Profit Margin Analysis
    • Wholesalers and Distributors
    • Retailers
    • PESTLE and Porter’s Analysis
    • Regulatory Landscape
    • Regional Parent Market Outlook
  5. Global Analysis 2020 to 2024 and Forecast, 2025 to 2035
    • Historical Market Size Value (USD Million) & Volume (Units) Analysis, 2020 to 2024
    • Current and Future Market Size Value (USD Million) & Volume (Units) Projections, 2025 to 2035
      • Y-o-Y Growth Trend Analysis
      • Absolute $ Opportunity Analysis
  6. Global Pricing Analysis 2020 to 2024 and Forecast 2025 to 2035
  7. Global Analysis 2020 to 2024 and Forecast 2025 to 2035, By Product Type
    • Introduction / Key Findings
    • Historical Market Size Value (USD Million) & Volume (Units) Analysis By Product Type, 2020 to 2024
    • Current and Future Market Size Value (USD Million) & Volume (Units) Analysis and Forecast By Product Type, 2025 to 2035
      • MEMS LiDAR
      • Flash LiDAR
      • Optical Phased Array LiDAR
      • Scanning/Phased Array LiDAR
    • Y-o-Y Growth Trend Analysis By Product Type, 2020 to 202
    • Absolute $ Opportunity Analysis By Product Type, 2025 to 2035
  8. Global Analysis 2020 to 2024 and Forecast 2025 to 2035, By Application
    • Introduction / Key Findings
    • Historical Market Size Value (USD Million) & Volume (Units) Analysis By Application, 2020 to 2024
    • Current and Future Market Size Value (USD Million) & Volume (Units) Analysis and Forecast By Application, 2025 to 2035
      • ADAS
      • Robotics
      • Drones & UAVs
      • Industrial
      • Others
    • Y-o-Y Growth Trend Analysis By Application, 2020 to 2024
    • Absolute $ Opportunity Analysis By Application, 2025 to 2035
  9. Global Analysis 2020 to 2024 and Forecast 2025 to 2035, By Component
    • Introduction / Key Findings
    • Historical Market Size Value (USD Million) & Volume (Units) Analysis By Component, 2020 to 2024
    • Current and Future Market Size Value (USD Million) & Volume (Units) Analysis and Forecast By Component, 2025 to 2035
      • Laser Source
      • Receiver
      • Optics
      • Processing Value (USD Million) & Volume (Units)
    • Y-o-Y Growth Trend Analysis By Component, 2020 to 2024
    • Absolute $ Opportunity Analysis By Component, 2025 to 2035
  10. Global Analysis 2020 to 2024 and Forecast 2025 to 2035, By Range
    • Introduction / Key Findings
    • Historical Market Size Value (USD Million) & Volume (Units) Analysis By Range, 2020 to 2024
    • Current and Future Market Size Value (USD Million) & Volume (Units) Analysis and Forecast By Range, 2025 to 2035
      • Short Range
      • Medium Range
      • Long Range
    • Y-o-Y Growth Trend Analysis By Range, 2020 to 2024
    • Absolute $ Opportunity Analysis By Range, 2025 to 2035
  11. Global Analysis 2020 to 2024 and Forecast 2025 to 2035, By Region
    • Introduction
    • Historical Market Size Value (USD Million) & Volume (Units) Analysis By Region, 2020 to 2024
    • Current Market Size Value (USD Million) & Volume (Units) Analysis and Forecast By Region, 2025 to 2035
      • North America
      • Latin America
      • Western Europe
      • East Asia
      • South Asia & Pacific
      • Eastern Europe
      • MEA
    • Market Attractiveness Analysis By Region
  12. North America Analysis 2020 to 2024 and Forecast 2025 to 2035, By Country
    • Historical Market Size Value (USD Million) & Volume (Units) Trend Analysis By Market Taxonomy, 2020 to 2024
    • Market Size Value (USD Million) & Volume (Units) Forecast By Market Taxonomy, 2025 to 2035
      • By Country
        • USA
        • Canada
        • Mexico
      • By Product Type
      • By Application
      • By Component
      • By Range
    • Market Attractiveness Analysis
      • By Country
      • By Product Type
      • By Application
      • By Component
      • By Range
    • Key Takeaways
  13. Latin America Analysis 2020 to 2024 and Forecast 2025 to 2035, By Country
    • Historical Market Size Value (USD Million) & Volume (Units) Trend Analysis By Market Taxonomy, 2020 to 2024
    • Market Size Value (USD Million) & Volume (Units) Forecast By Market Taxonomy, 2025 to 2035
      • By Country
        • Brazil
        • Argentina
        • Rest of Latin America
      • By Product Type
      • By Application
      • By Component
      • By Range
    • Market Attractiveness Analysis
      • By Country
      • By Product Type
      • By Application
      • By Component
      • By Range
    • Key Takeaways
  14. Western Europe Analysis 2020 to 2024 and Forecast 2025 to 2035, By Country
    • Historical Market Size Value (USD Million) & Volume (Units) Trend Analysis By Market Taxonomy, 2020 to 2024
    • Market Size Value (USD Million) & Volume (Units) Forecast By Market Taxonomy, 2025 to 2035
      • By Country
        • Germany
        • Italy
        • France
        • UK
        • Spain
        • BENELUX
        • Rest of W.Europe
      • By Product Type
      • By Application
      • By Component
      • By Range
    • Market Attractiveness Analysis
      • By Country
      • By Product Type
      • By Application
      • By Component
      • By Range
    • Key Takeaways
  15. East Asia Analysis 2020 to 2024 and Forecast 2025 to 2035, By Country
    • Historical Market Size Value (USD Million) & Volume (Units) Trend Analysis By Market Taxonomy, 2020 to 2024
    • Market Size Value (USD Million) & Volume (Units) Forecast By Market Taxonomy, 2025 to 2035
      • By Country
        • China
        • Japan
        • South Korea
      • By Product Type
      • By Application
      • By Component
      • By Range
    • Market Attractiveness Analysis
      • By Country
      • By Product Type
      • By Application
      • By Component
      • By Range
    • Key Takeaways
  16. South Asia & Pacific Analysis 2020 to 2024 and Forecast 2025 to 2035, By Country
    • Historical Market Size Value (USD Million) & Volume (Units) Trend Analysis By Market Taxonomy, 2020 to 2024
    • Market Size Value (USD Million) & Volume (Units) Forecast By Market Taxonomy, 2025 to 2035
      • By Country
        • India
        • ASEAN
        • ANZ
        • Rest of SAP
      • By Product Type
      • By Application
      • By Component
      • By Range
    • Market Attractiveness Analysis
      • By Country
      • By Product Type
      • By Application
      • By Component
      • By Range
    • Key Takeaways
  17. Eastern Europe Analysis 2020 to 2024 and Forecast 2025 to 2035, By Country
    • Historical Market Size Value (USD Million) & Volume (Units) Trend Analysis By Market Taxonomy, 2020 to 2024
    • Market Size Value (USD Million) & Volume (Units) Forecast By Market Taxonomy, 2025 to 2035
      • By Country
        • Russia
        • Hungary
        • Poland
        • Rest of E.Europe
      • By Product Type
      • By Application
      • By Component
      • By Range
    • Market Attractiveness Analysis
      • By Country
      • By Product Type
      • By Application
      • By Component
      • By Range
    • Key Takeaways
  18. MEA Analysis 2020 to 2024 and Forecast 2025 to 2035, By Country
    • Historical Market Size Value (USD Million) & Volume (Units) Trend Analysis By Market Taxonomy, 2020 to 2024
    • Market Size Value (USD Million) & Volume (Units) Forecast By Market Taxonomy, 2025 to 2035
      • By Country
        • GCC
        • Rest of MEA
      • By Product Type
      • By Application
      • By Component
      • By Range
    • Market Attractiveness Analysis
      • By Country
      • By Product Type
      • By Application
      • By Component
      • By Range
    • Key Takeaways
  19. Key Countries Analysis
    • USA
      • Pricing Analysis
      • Market Share Analysis, 2024
        • By Product Type
        • By Application
        • By Component
        • By Range
    • Canada
      • Pricing Analysis
      • Market Share Analysis, 2024
        • By Product Type
        • By Application
        • By Component
        • By Range
    • Mexico
      • Pricing Analysis
      • Market Share Analysis, 2024
        • By Product Type
        • By Application
        • By Component
        • By Range
    • Brazil
      • Pricing Analysis
      • Market Share Analysis, 2024
        • By Product Type
        • By Application
        • By Component
        • By Range
    • Argentina
      • Pricing Analysis
      • Market Share Analysis, 2024
        • By Product Type
        • By Application
        • By Component
        • By Range
    • Germany
      • Pricing Analysis
      • Market Share Analysis, 2024
        • By Product Type
        • By Application
        • By Component
        • By Range
    • Italy
      • Pricing Analysis
      • Market Share Analysis, 2024
        • By Product Type
        • By Application
        • By Component
        • By Range
    • France
      • Pricing Analysis
      • Market Share Analysis, 2024
        • By Product Type
        • By Application
        • By Component
        • By Range
    • UK
      • Pricing Analysis
      • Market Share Analysis, 2024
        • By Product Type
        • By Application
        • By Component
        • By Range
    • Spain
      • Pricing Analysis
      • Market Share Analysis, 2024
        • By Product Type
        • By Application
        • By Component
        • By Range
    • BENELUX
      • Pricing Analysis
      • Market Share Analysis, 2024
        • By Product Type
        • By Application
        • By Component
        • By Range
    • Nordics
      • Pricing Analysis
      • Market Share Analysis, 2024
        • By Product Type
        • By Application
        • By Component
        • By Range
    • Russia
      • Pricing Analysis
      • Market Share Analysis, 2024
        • By Product Type
        • By Application
        • By Component
        • By Range
    • Hungary
      • Pricing Analysis
      • Market Share Analysis, 2024
        • By Product Type
        • By Application
        • By Component
        • By Range
    • Poland
      • Pricing Analysis
      • Market Share Analysis, 2024
        • By Product Type
        • By Application
        • By Component
        • By Range
    • China
      • Pricing Analysis
      • Market Share Analysis, 2024
        • By Product Type
        • By Application
        • By Component
        • By Range
    • Japan
      • Pricing Analysis
      • Market Share Analysis, 2024
        • By Product Type
        • By Application
        • By Component
        • By Range
    • South Korea
      • Pricing Analysis
      • Market Share Analysis, 2024
        • By Product Type
        • By Application
        • By Component
        • By Range
    • India
      • Pricing Analysis
      • Market Share Analysis, 2024
        • By Product Type
        • By Application
        • By Component
        • By Range
    • ANZ
      • Pricing Analysis
      • Market Share Analysis, 2024
        • By Product Type
        • By Application
        • By Component
        • By Range
    • ASEAN
      • Pricing Analysis
      • Market Share Analysis, 2024
        • By Product Type
        • By Application
        • By Component
        • By Range
    • Turkiye
      • Pricing Analysis
      • Market Share Analysis, 2024
        • By Product Type
        • By Application
        • By Component
        • By Range
    • South Africa
      • Pricing Analysis
      • Market Share Analysis, 2024
        • By Product Type
        • By Application
        • By Component
        • By Range
    • GCC Countries
      • Pricing Analysis
      • Market Share Analysis, 2024
        • By Product Type
        • By Application
        • By Component
        • By Range
  20. Market Structure Analysis
    • Competition Dashboard
    • Competition Benchmarking
    • Market Share Analysis of Top Players
      • By Regional
      • By Product Type
      • By Application
      • By Component
      • By Range
  21. Competition Analysis
    • Competition Deep Dive
      • Hesai Technology Co., Ltd.
        • Overview
        • Product Portfolio
        • Profitability by Market Segments (Product/Age /Sales Channel/Region)
        • Sales Footprint
        • Strategy Overview
      • Velodyne Lidar, Inc.
      • Ouster, Inc.
      • Luminar Technologies, Inc.
      • Innoviz Technologies Ltd.
      • RoboSense (Suteng Innovation Technology Co., Ltd.
      • MicroVision,Inc.
      • LeddarTech Inc.
      • Quanergy Systems, Inc.
      • Blickfeld GmbH
      • Aeva Technologies, Inc.
      • Xenomatix
      • Cepton Technologies, Inc.
      • Livox Technology Limited
      • Benewake (Beijing) Co., Ltd.
  22. Assumptions & Acronyms Used
  23. Research Methodology

List of Tables

  • Table 1: Global Value (USD Million) Forecast by Region, 2020-2035
  • Table 2: Global Volume (Units) Forecast by Region, 2020-2035
  • Table 3: Global Value (USD Million) Forecast by Product Type, 2020-2035
  • Table 4: Global Volume (Units) Forecast by Product Type, 2020-2035
  • Table 5: Global Value (USD Million) Forecast by Application, 2020-2035
  • Table 6: Global Volume (Units) Forecast by Application, 2020-2035
  • Table 7: Global Value (USD Million) Forecast by Component, 2020-2035
  • Table 8: Global Volume (Units) Forecast by Component, 2020-2035
  • Table 9: Global Value (USD Million) Forecast by Range, 2020-2035
  • Table 10: Global Volume (Units) Forecast by Range, 2020-2035
  • Table 11: North America Value (USD Million) Forecast by Country, 2020-2035
  • Table 12: North America Volume (Units) Forecast by Country, 2020-2035
  • Table 13: North America Value (USD Million) Forecast by Product Type, 2020-2035
  • Table 14: North America Volume (Units) Forecast by Product Type, 2020-2035
  • Table 15: North America Value (USD Million) Forecast by Application, 2020-2035
  • Table 16: North America Volume (Units) Forecast by Application, 2020-2035
  • Table 17: North America Value (USD Million) Forecast by Component, 2020-2035
  • Table 18: North America Volume (Units) Forecast by Component, 2020-2035
  • Table 19: North America Value (USD Million) Forecast by Range, 2020-2035
  • Table 20: North America Volume (Units) Forecast by Range, 2020-2035
  • Table 21: Latin America Value (USD Million) Forecast by Country, 2020-2035
  • Table 22: Latin America Volume (Units) Forecast by Country, 2020-2035
  • Table 23: Latin America Value (USD Million) Forecast by Product Type, 2020-2035
  • Table 24: Latin America Volume (Units) Forecast by Product Type, 2020-2035
  • Table 25: Latin America Value (USD Million) Forecast by Application, 2020-2035
  • Table 26: Latin America Volume (Units) Forecast by Application, 2020-2035
  • Table 27: Latin America Value (USD Million) Forecast by Component, 2020-2035
  • Table 28: Latin America Volume (Units) Forecast by Component, 2020-2035
  • Table 29: Latin America Value (USD Million) Forecast by Range, 2020-2035
  • Table 30: Latin America Volume (Units) Forecast by Range, 2020-2035
  • Table 31: Western Europe Value (USD Million) Forecast by Country, 2020-2035
  • Table 32: Western Europe Volume (Units) Forecast by Country, 2020-2035
  • Table 33: Western Europe Value (USD Million) Forecast by Product Type, 2020-2035
  • Table 34: Western Europe Volume (Units) Forecast by Product Type, 2020-2035
  • Table 35: Western Europe Value (USD Million) Forecast by Application, 2020-2035
  • Table 36: Western Europe Volume (Units) Forecast by Application, 2020-2035
  • Table 37: Western Europe Value (USD Million) Forecast by Component, 2020-2035
  • Table 38: Western Europe Volume (Units) Forecast by Component, 2020-2035
  • Table 39: Western Europe Value (USD Million) Forecast by Range, 2020-2035
  • Table 40: Western Europe Volume (Units) Forecast by Range, 2020-2035
  • Table 41: East Asia Value (USD Million) Forecast by Country, 2020-2035
  • Table 42: East Asia Volume (Units) Forecast by Country, 2020-2035
  • Table 43: East Asia Value (USD Million) Forecast by Product Type, 2020-2035
  • Table 44: East Asia Volume (Units) Forecast by Product Type, 2020-2035
  • Table 45: East Asia Value (USD Million) Forecast by Application, 2020-2035
  • Table 46: East Asia Volume (Units) Forecast by Application, 2020-2035
  • Table 47: East Asia Value (USD Million) Forecast by Component, 2020-2035
  • Table 48: East Asia Volume (Units) Forecast by Component, 2020-2035
  • Table 49: East Asia Value (USD Million) Forecast by Range, 2020-2035
  • Table 50: East Asia Volume (Units) Forecast by Range, 2020-2035
  • Table 51: South Asia & Pacific Value (USD Million) Forecast by Country, 2020-2035
  • Table 52: South Asia & Pacific Volume (Units) Forecast by Country, 2020-2035
  • Table 53: South Asia & Pacific Value (USD Million) Forecast by Product Type, 2020-2035
  • Table 54: South Asia & Pacific Volume (Units) Forecast by Product Type, 2020-2035
  • Table 55: South Asia & Pacific Value (USD Million) Forecast by Application, 2020-2035
  • Table 56: South Asia & Pacific Volume (Units) Forecast by Application, 2020-2035
  • Table 57: South Asia & Pacific Value (USD Million) Forecast by Component, 2020-2035
  • Table 58: South Asia & Pacific Volume (Units) Forecast by Component, 2020-2035
  • Table 59: South Asia & Pacific Value (USD Million) Forecast by Range, 2020-2035
  • Table 60: South Asia & Pacific Volume (Units) Forecast by Range, 2020-2035
  • Table 61: Eastern Europe Value (USD Million) Forecast by Country, 2020-2035
  • Table 62: Eastern Europe Volume (Units) Forecast by Country, 2020-2035
  • Table 63: Eastern Europe Value (USD Million) Forecast by Product Type, 2020-2035
  • Table 64: Eastern Europe Volume (Units) Forecast by Product Type, 2020-2035
  • Table 65: Eastern Europe Value (USD Million) Forecast by Application, 2020-2035
  • Table 66: Eastern Europe Volume (Units) Forecast by Application, 2020-2035
  • Table 67: Eastern Europe Value (USD Million) Forecast by Component, 2020-2035
  • Table 68: Eastern Europe Volume (Units) Forecast by Component, 2020-2035
  • Table 69: Eastern Europe Value (USD Million) Forecast by Range, 2020-2035
  • Table 70: Eastern Europe Volume (Units) Forecast by Range, 2020-2035
  • Table 71: MEA Value (USD Million) Forecast by Country, 2020-2035
  • Table 72: MEA Volume (Units) Forecast by Country, 2020-2035
  • Table 73: MEA Value (USD Million) Forecast by Product Type, 2020-2035
  • Table 74: MEA Volume (Units) Forecast by Product Type, 2020-2035
  • Table 75: MEA Value (USD Million) Forecast by Application, 2020-2035
  • Table 76: MEA Volume (Units) Forecast by Application, 2020-2035
  • Table 77: MEA Value (USD Million) Forecast by Component, 2020-2035
  • Table 78: MEA Volume (Units) Forecast by Component, 2020-2035
  • Table 79: MEA Value (USD Million) Forecast by Range, 2020-2035
  • Table 80: MEA Volume (Units) Forecast by Range, 2020-2035

List of Figures

  • Figure 1: Global Volume (Units) Forecast 2020-2035
  • Figure 2: Global Pricing Analysis
  • Figure 3: Global Value (USD Million) Forecast 2020-2035
  • Figure 4: Global Value Share and BPS Analysis by Product Type, 2025 and 2035
  • Figure 5: Global Y-o-Y Growth Comparison by Product Type, 2025-2035
  • Figure 6: Global Attractiveness Analysis by Product Type
  • Figure 7: Global Value Share and BPS Analysis by Application, 2025 and 2035
  • Figure 8: Global Y-o-Y Growth Comparison by Application, 2025-2035
  • Figure 9: Global Attractiveness Analysis by Application
  • Figure 10: Global Value Share and BPS Analysis by Component, 2025 and 2035
  • Figure 11: Global Y-o-Y Growth Comparison by Component, 2025-2035
  • Figure 12: Global Attractiveness Analysis by Component
  • Figure 13: Global Value Share and BPS Analysis by Range, 2025 and 2035
  • Figure 14: Global Y-o-Y Growth Comparison by Range, 2025-2035
  • Figure 15: Global Attractiveness Analysis by Range
  • Figure 16: Global Value (USD Million) Share and BPS Analysis by Region, 2025 and 2035
  • Figure 17: Global Y-o-Y Growth Comparison by Region, 2025-2035
  • Figure 18: Global Attractiveness Analysis by Region
  • Figure 19: North America Incremental $ Opportunity, 2025-2035
  • Figure 20: Latin America Incremental $ Opportunity, 2025-2035
  • Figure 21: Western Europe Incremental $ Opportunity, 2025-2035
  • Figure 22: East Asia Incremental $ Opportunity, 2025-2035
  • Figure 23: South Asia & Pacific Incremental $ Opportunity, 2025-2035
  • Figure 24: Eastern Europe Incremental $ Opportunity, 2025-2035
  • Figure 25: MEA Incremental $ Opportunity, 2025-2035
  • Figure 26: North America Value Share and BPS Analysis by Country, 2025 and 2035
  • Figure 27: North America Value Share and BPS Analysis by Product Type, 2025 and 2035
  • Figure 28: North America Y-o-Y Growth Comparison by Product Type, 2025-2035
  • Figure 29: North America Attractiveness Analysis by Product Type
  • Figure 30: North America Value Share and BPS Analysis by Application, 2025 and 2035
  • Figure 31: North America Y-o-Y Growth Comparison by Application, 2025-2035
  • Figure 32: North America Attractiveness Analysis by Application
  • Figure 33: North America Value Share and BPS Analysis by Component, 2025 and 2035
  • Figure 34: North America Y-o-Y Growth Comparison by Component, 2025-2035
  • Figure 35: North America Attractiveness Analysis by Component
  • Figure 36: North America Value Share and BPS Analysis by Range, 2025 and 2035
  • Figure 37: North America Y-o-Y Growth Comparison by Range, 2025-2035
  • Figure 38: North America Attractiveness Analysis by Range
  • Figure 39: Latin America Value Share and BPS Analysis by Country, 2025 and 2035
  • Figure 40: Latin America Value Share and BPS Analysis by Product Type, 2025 and 2035
  • Figure 41: Latin America Y-o-Y Growth Comparison by Product Type, 2025-2035
  • Figure 42: Latin America Attractiveness Analysis by Product Type
  • Figure 43: Latin America Value Share and BPS Analysis by Application, 2025 and 2035
  • Figure 44: Latin America Y-o-Y Growth Comparison by Application, 2025-2035
  • Figure 45: Latin America Attractiveness Analysis by Application
  • Figure 46: Latin America Value Share and BPS Analysis by Component, 2025 and 2035
  • Figure 47: Latin America Y-o-Y Growth Comparison by Component, 2025-2035
  • Figure 48: Latin America Attractiveness Analysis by Component
  • Figure 49: Latin America Value Share and BPS Analysis by Range, 2025 and 2035
  • Figure 50: Latin America Y-o-Y Growth Comparison by Range, 2025-2035
  • Figure 51: Latin America Attractiveness Analysis by Range
  • Figure 52: Western Europe Value Share and BPS Analysis by Country, 2025 and 2035
  • Figure 53: Western Europe Value Share and BPS Analysis by Product Type, 2025 and 2035
  • Figure 54: Western Europe Y-o-Y Growth Comparison by Product Type, 2025-2035
  • Figure 55: Western Europe Attractiveness Analysis by Product Type
  • Figure 56: Western Europe Value Share and BPS Analysis by Application, 2025 and 2035
  • Figure 57: Western Europe Y-o-Y Growth Comparison by Application, 2025-2035
  • Figure 58: Western Europe Attractiveness Analysis by Application
  • Figure 59: Western Europe Value Share and BPS Analysis by Component, 2025 and 2035
  • Figure 60: Western Europe Y-o-Y Growth Comparison by Component, 2025-2035
  • Figure 61: Western Europe Attractiveness Analysis by Component
  • Figure 62: Western Europe Value Share and BPS Analysis by Range, 2025 and 2035
  • Figure 63: Western Europe Y-o-Y Growth Comparison by Range, 2025-2035
  • Figure 64: Western Europe Attractiveness Analysis by Range
  • Figure 65: East Asia Value Share and BPS Analysis by Country, 2025 and 2035
  • Figure 66: East Asia Value Share and BPS Analysis by Product Type, 2025 and 2035
  • Figure 67: East Asia Y-o-Y Growth Comparison by Product Type, 2025-2035
  • Figure 68: East Asia Attractiveness Analysis by Product Type
  • Figure 69: East Asia Value Share and BPS Analysis by Application, 2025 and 2035
  • Figure 70: East Asia Y-o-Y Growth Comparison by Application, 2025-2035
  • Figure 71: East Asia Attractiveness Analysis by Application
  • Figure 72: East Asia Value Share and BPS Analysis by Component, 2025 and 2035
  • Figure 73: East Asia Y-o-Y Growth Comparison by Component, 2025-2035
  • Figure 74: East Asia Attractiveness Analysis by Component
  • Figure 75: East Asia Value Share and BPS Analysis by Range, 2025 and 2035
  • Figure 76: East Asia Y-o-Y Growth Comparison by Range, 2025-2035
  • Figure 77: East Asia Attractiveness Analysis by Range
  • Figure 78: South Asia & Pacific Value Share and BPS Analysis by Country, 2025 and 2035
  • Figure 79: South Asia & Pacific Value Share and BPS Analysis by Product Type, 2025 and 2035
  • Figure 80: South Asia & Pacific Y-o-Y Growth Comparison by Product Type, 2025-2035
  • Figure 81: South Asia & Pacific Attractiveness Analysis by Product Type
  • Figure 82: South Asia & Pacific Value Share and BPS Analysis by Application, 2025 and 2035
  • Figure 83: South Asia & Pacific Y-o-Y Growth Comparison by Application, 2025-2035
  • Figure 84: South Asia & Pacific Attractiveness Analysis by Application
  • Figure 85: South Asia & Pacific Value Share and BPS Analysis by Component, 2025 and 2035
  • Figure 86: South Asia & Pacific Y-o-Y Growth Comparison by Component, 2025-2035
  • Figure 87: South Asia & Pacific Attractiveness Analysis by Component
  • Figure 88: South Asia & Pacific Value Share and BPS Analysis by Range, 2025 and 2035
  • Figure 89: South Asia & Pacific Y-o-Y Growth Comparison by Range, 2025-2035
  • Figure 90: South Asia & Pacific Attractiveness Analysis by Range
  • Figure 91: Eastern Europe Value Share and BPS Analysis by Country, 2025 and 2035
  • Figure 92: Eastern Europe Value Share and BPS Analysis by Product Type, 2025 and 2035
  • Figure 93: Eastern Europe Y-o-Y Growth Comparison by Product Type, 2025-2035
  • Figure 94: Eastern Europe Attractiveness Analysis by Product Type
  • Figure 95: Eastern Europe Value Share and BPS Analysis by Application, 2025 and 2035
  • Figure 96: Eastern Europe Y-o-Y Growth Comparison by Application, 2025-2035
  • Figure 97: Eastern Europe Attractiveness Analysis by Application
  • Figure 98: Eastern Europe Value Share and BPS Analysis by Component, 2025 and 2035
  • Figure 99: Eastern Europe Y-o-Y Growth Comparison by Component, 2025-2035
  • Figure 100: Eastern Europe Attractiveness Analysis by Component
  • Figure 101: Eastern Europe Value Share and BPS Analysis by Range, 2025 and 2035
  • Figure 102: Eastern Europe Y-o-Y Growth Comparison by Range, 2025-2035
  • Figure 103: Eastern Europe Attractiveness Analysis by Range
  • Figure 104: MEA Value Share and BPS Analysis by Country, 2025 and 2035
  • Figure 105: MEA Value Share and BPS Analysis by Product Type, 2025 and 2035
  • Figure 106: MEA Y-o-Y Growth Comparison by Product Type, 2025-2035
  • Figure 107: MEA Attractiveness Analysis by Product Type
  • Figure 108: MEA Value Share and BPS Analysis by Application, 2025 and 2035
  • Figure 109: MEA Y-o-Y Growth Comparison by Application, 2025-2035
  • Figure 110: MEA Attractiveness Analysis by Application
  • Figure 111: MEA Value Share and BPS Analysis by Component, 2025 and 2035
  • Figure 112: MEA Y-o-Y Growth Comparison by Component, 2025-2035
  • Figure 113: MEA Attractiveness Analysis by Component
  • Figure 114: MEA Value Share and BPS Analysis by Range, 2025 and 2035
  • Figure 115: MEA Y-o-Y Growth Comparison by Range, 2025-2035
  • Figure 116: MEA Attractiveness Analysis by Range
  • Figure 117: Global - Tier Structure Analysis
  • Figure 118: Global - Company Share Analysis

Frequently Asked Questions

What is the projected size of the Solid State Lidar Market by 2035?

The global market is projected to reach USD 10,759.0 million by 2035, growing at a CAGR of 18.5% from 2025 to 2035.

Which region is expected to contribute most to market growth?

East Asia, led by China and Japan, is expected to register the highest absolute value growth due to aggressive EV deployment and L3-L5 autonomy integration.

What type of lidar is most commonly used in automotive applications?

MEMS-based LiDAR is most popular in automotive use cases due to its compact size, durability, and ability to handle high-speed object detection.

What are the major applications of solid state lidar beyond automotive?

Key non-automotive applications include industrial robotics, mobile mapping systems, drones, and augmented reality (AR) devices.

What is driving demand for medium-range lidar sensors?

Demand is rising due to their optimal balance of range, resolution, and cost, making them suitable for autonomous shuttles, robotic forklifts, and smart infrastructure systems.

Explore Similar Insights

Future Market Insights

Solid State LiDAR Sensor Market