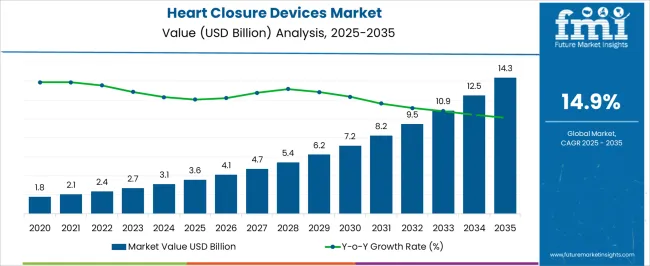
The Heart Closure Devices Market is estimated to be valued at USD 3.6 billion in 2025 and is projected to reach USD 14.3 billion by 2035, registering a compound annual growth rate (CAGR) of 14.9% over the forecast period.

| Metric | Value |
|---|---|
| Heart Closure Devices Market Estimated Value in (2025 E) | USD 3.6 billion |
| Heart Closure Devices Market Forecast Value in (2035 F) | USD 14.3 billion |
| Forecast CAGR (2025 to 2035) | 14.9% |
The heart closure devices market is advancing steadily due to the growing prevalence of structural heart diseases, increasing adoption of minimally invasive procedures, and rising awareness among healthcare providers regarding advanced closure technologies. Improved access to interventional cardiology and a strong emphasis on reducing post operative complications have accelerated the deployment of specialized closure systems.
Technological enhancements in delivery systems, device biocompatibility, and real time imaging have supported precision based therapies, particularly in pediatric and high risk patients. Public and private sector investments in cardiac infrastructure and early defect diagnosis programs are further shaping the growth landscape.
The market outlook remains favorable as patient safety, recovery time, and long term procedural outcomes become central to cardiovascular treatment strategies across global healthcare systems.
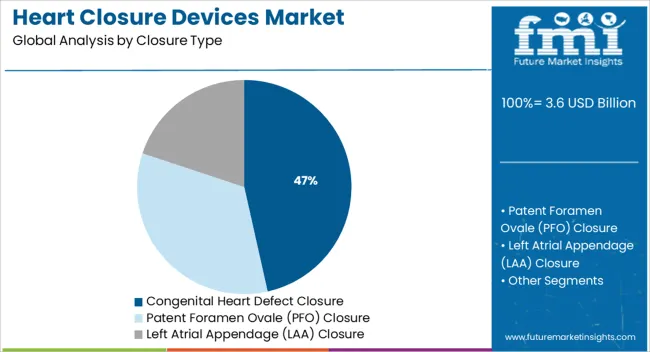
The market is segmented by Closure Type and region. By Closure Type, the market is divided into Congenital Heart Defect Closure, Patent Foramen Ovale (PFO) Closure, and Left Atrial Appendage (LAA) Closure. Regionally, the market is classified into North America, Latin America, Western Europe, Eastern Europe, Balkan & Baltic Countries, Russia & Belarus, Central Asia, East Asia, South Asia & Pacific, and the Middle East & Africa.

The congenital heart defect closure segment is projected to account for 46.50% of total market revenue by 2025 under the closure type category, positioning it as the leading segment. This dominance is driven by the increasing incidence of congenital heart anomalies detected at birth and the clinical shift toward early intervention using non surgical methods.
Devices in this category are designed to offer precise occlusion with minimal trauma and reduced recovery time, making them preferred across both pediatric and adult populations. Advances in device flexibility, material safety, and catheter based delivery have contributed to their widespread adoption.
Furthermore, rising awareness among healthcare practitioners and patients about early closure benefits has reinforced procedural volumes. The combination of targeted innovation and expanding access to cardiology services continues to sustain the leadership of this segment in the heart closure devices market.
The global demand for heart closure devices is projected to increase at a CAGR of 14.9% during the forecast period between 2025 and 2035, reaching a total of USD 14.3 Billion in 2035, according to a report from Future Market Insights (FMI). From 2020 to 2025, sales witnessed significant growth, registering a CAGR of 6.6%. According to Future Market Insights, a market research and competitive intelligence provider, the Heart Closure Devices market was valued at USD 3.6 Billion in 2025.
Patients who suffer from advanced stages of heart disease repeatedly require technologically advanced diagnostic and therapeutic cardiovascular devices. This is due to the growing awareness and high demand for coronary stents and other medical devices with better safety features. The patient demand includes devices that do not cause adverse reactions like infections, which are caused by several types of stents, such as bare-metal stents.
Moreover, there is a demand for devices with advanced features such as remote cardiac monitoring features, due to current technological advancements. These characteristics provide individuals with a practical and accurate treatment plan, also allowing them ease of usability.
Increasing Availability of Efficient Devices to Fuel the Market Growth
The pervasiveness of heart diseases globally has observed a noticeable increase, which fuels the demand for efficient heart devices. The accessibility of advanced devices has led to the adoption of these devices in many countries. Also, adopted initiatives catering to the rise in demand for these devices in emerging economies have propelled the market. In addition, investors are focused on expanding the availability of economical heart closure devices in countries such as India, China, Mexico, and others. This, in turn, is expected to attract a huge heart closure devices market share in the forthcoming years.
For instance, in February 2024, AliveCor, a leading AI-based ECG technology, and enterprise cardiac solution provider announced the launch of KardiaMobile, which is used to record, store and transfer single-channel electrocardiogram rhythms in the Mexico region from the Federal Commission for the Protection against Sanitary Risk. This launch is the result of the partnership between AliveCor and Inpharamo, a Mexico-based medical solutions company.
Rise in Prevalence of Cardiovascular Diseases to Accelerate the Market Growth
The increasing occurrence of heart diseases in patients is the highest in regard to cost and healthcare services. The rise in the occurrence of chronic cardiovascular diseases like heart failure and coronary artery disease (CAD) is one of the major factors which promote market growth. One of the most critical cardiovascular devices is Coronary or cardiac stents. These devices help treat life-threatening cardiac conditions such as heart attack, coronary heart disease, atrial fibrillation, and the opening of narrowed arteries. The prevalence of cardiac diseases augments the need for advanced heart devices in the world.
According to the Centers for Disease Control and Prevention (CDC) estimates in 2020, cardiovascular diseases are the leading cause of death in the USA region, eventually contributing to an estimated 1 in 4 deaths every year. According to the World Health Organization, heart diseases cause an estimated 17.9 million deaths each year.
Additionally, the upsurge in approvals for new devices by regulatory authorities also provides major traction to the growth of the heart closure devices market. Numerous initiatives adopted by public authorities to enable the availability of cardiovascular devices to a large population in developing regions will probably steer the over the analysis period.
High Cost of Heart Closure Devices to Restrain the Market Growth
Heart Closure Devices are relatively high-priced devices, as compared to manual compression devices. The average price of a heart closure device is about USD 150-250, while that of a manual compression device is about USD 15-25. The cost of HCDs essentially adds up to the patient’s hospitalization bill, increases the per-patient cost for hospitals, and simultaneously reduces profits.
The costs associated with manual compression devices, on the other hand, are very low compared to heart closure devices. Thus, the high cost of heart defect closure devices acts as a major factor restraining market growth. Hospitals are also not reimbursed for heart closure devices, which is another major factor hindering the demand for these devices.
Increasing Barriers in Research and Development Activities to Limit the Market Growth
Limitations involved in the advancement of innovative and technologically advanced heart closure devices are a strong Research and Development environment. Various key players are focused on their capacity to invest in futuristic Research and Development programs related to these devices, due to the ineffective processes within the reimbursement models. For instance, in the countries that advocate the policies of price caps on life-saving stents, manufacturers might be less inclined towards the development of new products or even in introducing advanced cardiac devices with high costs in these markets.
Additionally, apart from barriers in Research and Development programs in this market, rigid regulatory policies are also one of the major factors that are anticipated to hamper the market growth. The devices innovated by the key players without complying with regulatory guidelines cannot be launched in the market for commercial use resulting in a loss of significant investment by the manufacturers.

High Adoption of Advanced Devices in the Region to Fuel the Market Growth
The heart closure devices market in Asia Pacific is expected to accumulate the highest market share of 53% in 2025. Asia Pacific is the most lucrative region along with the highest market share. Factors such as the growing prevalence of chronic cardiovascular diseases and the high adoption of advanced devices in the region are expected to boost the growth of the heart closure devices market during the forecast period.
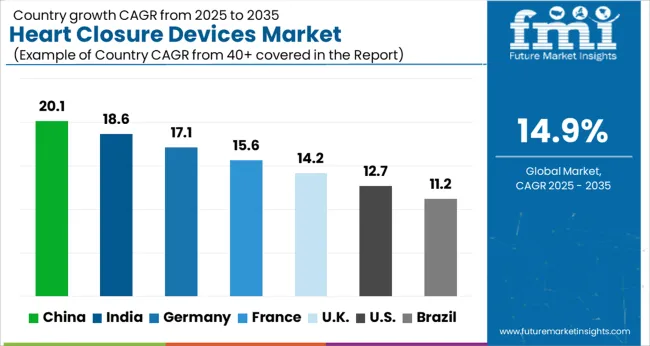
For instance, in February 2020, in India, the government confirmed that the price controls on the stents are expected to continue, especially on the drug-eluting stents. These stents have a substantially lower rate, as compared to international markets such as the USA. Such an established regulatory scenario for cardiovascular devices is expected to boost the expansion of the market in Asia Pacific over the analysis period. The region is expected to hold the highest CAGR of 14.8% during the forecast period.
High Research and Development Investments and Trials in the Region to Fuel the Market Growth
The heart closure devices market in North America is expected to accumulate the highest market share of 51% in 2025. North America is the most lucrative region along with the highest market share. Factors such as high Research and Development investments and trials in this region are expected to accelerate the regional market growth during the forecast period. For instance, the Lifetech Scientific-sponsored IDE study on LAmbre, and to establish safety and effectiveness data, the LAmbre device would be evaluated in this clinical trial among the USA population. Positive clinical results might boost the adoption of the LAA closure device in the USA as many physicians in the country are influenced by clinical studies.
Moreover, in North America, heart closure devices have been commercially available for more than a decade, which has allowed for the development of stronger healthcare infrastructure for performing minimally invasive heart defect closure treatments, resulting in further boosting the industry expansion. The region is expected to hold the highest CAGR of 14.7% during the forecast period.
Left Atrial Appendage (LAA) Closure Segment to beat Competition in Untiring Market
On the basis of closure type, the left atrial appendage (LAA) closure segment is expected to account for a share of 49%. The growing number of nonvalvular AF patients who have been shown to be at high risk for stroke and also in whom oral anticoagulants are ineffective.
For instance, data from the Journal of Arrhythmia from 2020 shows that the number of cases is largest in densely populated nations like China and India, which would eventually increase the demand for LAAC. The segment is expected to hold a CAGR of 14.7% over the analysis period.
Hospitals Segment to Drive the Heart Closure Devices Market
Based on the End-User, the hospital's segment is expected to accumulate a revenue share of 47% in 2025, and the trend is expected to continue during the forecast period. This growth is attributed to the requirement of trained medical professionals to insert critical cardiovascular devices such as stents. Also, hospitals also help in the reduction of adverse reactions in patients during critical medical procedures.
For instance, the Cardiovascular Care Center at the Charlton Memorial Hospital announced that they had added a new electrophysiology lab. They also announced the complete renovation of the cardiac catheterization lab for elective as well as emergency treatments. The segment is expected to hold a CAGR of 14.6% over the analysis period.

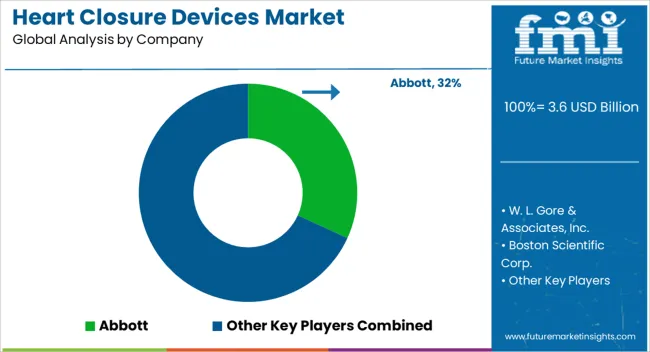
Prominent players in the heart closure devices market are Abbott Laboratories, W. L. Gore & Associates, Inc, Boston Scientific Corp., Occlutech, Heartstitch, SMT, Cardia, Inc., Lifetech Scientific Corp., Lepu Medical Technology (Beijing)Co., Ltd., and AtriCure Inc., among others.
Recent Developments:
| Report Attribute | Details |
|---|---|
| Growth Rate | CAGR of 14.9% from 2025 to 2035 |
| Market Value in 2025 | USD 3.6 billion |
| Market Value in 2035 | USD 14.3 billion |
| Base Year for Estimation | 2025 |
| Historical Data | 2020 to 2025 |
| Forecast Period | 2025 to 2035 |
| Quantitative Units | Revenue in USD Billion and CAGR from 2025 to 2035 |
| Report Coverage | Revenue Forecast, Company Ranking, Competitive Landscape, Growth Factors, Trends, and Pricing Analysis |
| Segments Covered | Closure Type, Region |
| Regions Covered | North America; Europe; Asia Pacific; Latin America; Middle East and Africa (MEA) |
| Key Countries Profiled | USA, Canada, Brazil, Mexico, Germany, United Kingdom, France, Spain, Italy, Russia, China, Japan, India, South Korea, Australia, Saudi Arabia, United Arab Emirates(UAE), South Africa, Israel |
| Key Companies Profiled | Abbott; W. L. Gore & Associates, Inc.; Boston Scientific Corp.; Occlutech; Heartstitch; SMT; Cardia, Inc.; Lifetech Scientific Corp.; Lepu Medical Technology; AtriCure Inc. |
| Customization & Pricing | Available upon Request |
The global heart closure devices market is estimated to be valued at USD 3.6 billion in 2025.
The market size for the heart closure devices market is projected to reach USD 14.3 billion by 2035.
The heart closure devices market is expected to grow at a 14.9% CAGR between 2025 and 2035.
The key product types in heart closure devices market are congenital heart defect closure, _atrial septal defect (asd), _patent ductus arteriosus (pda), _ventricular septal defect (vsd), patent foramen ovale (pfo) closure and left atrial appendage (laa) closure.
In terms of , segment to command 0.0% share in the heart closure devices market in 2025.


Our Research Products

The "Full Research Suite" delivers actionable market intel, deep dives on markets or technologies, so clients act faster, cut risk, and unlock growth.

The Leaderboard benchmarks and ranks top vendors, classifying them as Established Leaders, Leading Challengers, or Disruptors & Challengers.

Locates where complements amplify value and substitutes erode it, forecasting net impact by horizon

We deliver granular, decision-grade intel: market sizing, 5-year forecasts, pricing, adoption, usage, revenue, and operational KPIs—plus competitor tracking, regulation, and value chains—across 60 countries broadly.

Spot the shifts before they hit your P&L. We track inflection points, adoption curves, pricing moves, and ecosystem plays to show where demand is heading, why it is changing, and what to do next across high-growth markets and disruptive tech

Real-time reads of user behavior. We track shifting priorities, perceptions of today’s and next-gen services, and provider experience, then pace how fast tech moves from trial to adoption, blending buyer, consumer, and channel inputs with social signals (#WhySwitch, #UX).

Partner with our analyst team to build a custom report designed around your business priorities. From analysing market trends to assessing competitors or crafting bespoke datasets, we tailor insights to your needs.
Supplier Intelligence
Discovery & Profiling
Capacity & Footprint
Performance & Risk
Compliance & Governance
Commercial Readiness
Who Supplies Whom
Scorecards & Shortlists
Playbooks & Docs
Category Intelligence
Definition & Scope
Demand & Use Cases
Cost Drivers
Market Structure
Supply Chain Map
Trade & Policy
Operating Norms
Deliverables
Buyer Intelligence
Account Basics
Spend & Scope
Procurement Model
Vendor Requirements
Terms & Policies
Entry Strategy
Pain Points & Triggers
Outputs
Pricing Analysis
Benchmarks
Trends
Should-Cost
Indexation
Landed Cost
Commercial Terms
Deliverables
Brand Analysis
Positioning & Value Prop
Share & Presence
Customer Evidence
Go-to-Market
Digital & Reputation
Compliance & Trust
KPIs & Gaps
Outputs
Full Research Suite comprises of:
Market outlook & trends analysis
Interviews & case studies
Strategic recommendations
Vendor profiles & capabilities analysis
5-year forecasts
8 regions and 60+ country-level data splits
Market segment data splits
12 months of continuous data updates
DELIVERED AS:
PDF EXCEL ONLINE
Vascular Closure Devices Analysis by Product Type by Product, By Age Group and by Distribution Channel through 2035
Structural Heart Devices Market Size and Share Forecast Outlook 2025 to 2035
Transradial Closure Devices Market Size and Share Forecast Outlook 2025 to 2035
Cranial Closure And Fixation Devices Market Size and Share Forecast Outlook 2025 to 2035
Heart Pump Device Market Forecast and Outlook 2025 to 2035
Heart Beat Sensor Market Size and Share Forecast Outlook 2025 to 2035
APAC Heart Health Functional Food Market Size and Share Forecast Outlook 2025 to 2035
Heart Block Therapeutics Market Size and Share Forecast Outlook 2025 to 2035
Heart Beat Irregularity Detection Device Market Trends - Growth & Forecast 2025 to 2035
Heart Beat Monitor and Sensor Market
Heart Failure Testing Market
Enclosure Support Arm Systems Market Size and Share Forecast Outlook 2025 to 2035
Bag Closure Clips Market Size and Share Forecast Outlook 2025 to 2035
Bag Closures Market Size and Share Forecast Outlook 2025 to 2035
Competitive Breakdown of Bag Closure Clip Providers
Case Closures and Sealers Market Analysis - Size and Share Forecast Outlook 2025 to 2035
Tube Closures Market Size and Share Forecast Outlook 2025 to 2035
FBAR Devices Market
Cap and Closure Market Trends - Growth & Demand 2025-2035
T-Top Closures Market - Growth & Demand 2025 to 2035

Thank you!
You will receive an email from our Business Development Manager. Please be sure to check your SPAM/JUNK folder too.
Chat With
MaRIA