Heart Pump Device Market Size and Share Forecast Outlook From 2024 to 2034

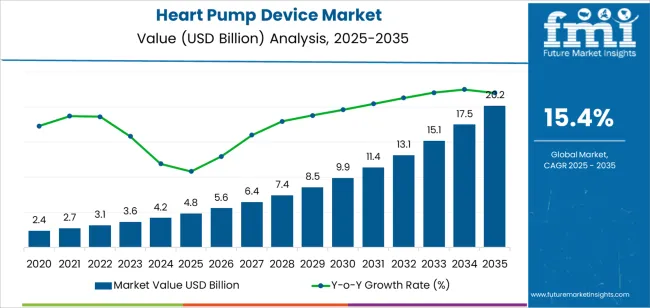
The global Heart Pump Device Market is expected to rise from USD 4.0 billion in 2024 to USD 25.4 billion by 2034. By 2034, the market is projected to surge at 20.4% CAGR.

Attributes Key Insights
Estimated Global Heart Pump Device Market Size (2024E) USD 4.0 billion
Projected Heart Pump Device Market Value (2034F) USD 25.4 billion
Value-based CAGR (2024 to 2034) 20.4%

Top Heart Pump Device Market Dynamics and Industry Trends

  • The rising prevalence of cardiovascular illnesses and the aging population are two key factors that are anticipated to fuel growth of the heart pump device market during the forecast period.
  • The growing market penetration of industry participants is predicted to slow down the market expansion for heart pump devices.
  • Post pandemic, patients with pre-existing cardiac diseases who contracted COVID-19 are more likely to suffer from a severe sickness, which led to a rising demand for heart pump devices.

Comparison of Historical vs Future Outlook on Changing Consumer Trends for Heart Pump Devices

The global heart pump device sales grew at a CAGR of 24.0% from 2019 to 2023. The growth of heart pump devices from 2019 to 2023 can be attributed to a convergence of factors:

  • In the 2020s, ventricular assist devices (VADs) became a key development in mechanical circulatory support.
  • VADs were first created as short-term support devices, but they have now matured into practical solutions for patients with end-stage heart failure who require long-term care.
  • The engineering and design of heart pump therapy devices have seen tremendous technological advances.
  • Innovations, including wireless monitoring capabilities, compacted devices, and magnetically levitated centrifugal flow pumps, have improved device performance, durability, and patient outcomes.
  • Clinical research and trials have advanced the field of mechanical circulatory support significantly.
  • Extensive clinical trials have produced data regarding heart pump devices' effectiveness, safety, and long-term consequences, influencing treatment choices and developing clinical practice standards.

By 2034, the market for heart pump devices is expected to rise at 20.4% CAGR.

  • Patient-centric care, which encompasses individualized treatment plans catered to each patient's needs, is gaining traction in the healthcare sector.
  • Companies are creating remote monitoring programs and customizable heart pump systems that let medical professionals give the best possible care for their patients and achieve better results.
  • Leading economies are focusing on healthcare infrastructure advancement. This offers substantial prospects for market growth for heart pump device producers, particularly as these areas deal with the rising prevalence of cardiovascular illnesses.

Key Trends Shaping the Global Heart Pump Device Market

  • Substantial technological developments in the heart pump device market aim to enhance devices' effectiveness, longevity, and patient outcomes. These include creating smaller, more effective devices as well as improving control systems and the materials used to build them.
  • Heart failure is becoming a more common illness worldwide as a result of aging populations and increased rates of cardiovascular diseases.
  • Less invasive methods are gaining traction among patients and medical professionals to treat cardiac diseases. This tendency impacts the creation of less invasive implantable cardiac pumps, which, compared to open heart surgery, have lower risks and faster recovery times.

Factors Restraining the Demand for Heart Pump Devices

  • Even with the latest technological breakthroughs, heart pump systems are still susceptible to complications such as thrombosis, infection, and device malfunctioning.
  • Several healthcare facilities need more knowledge or resources to implement & maintain cardiac pump devices safely and efficiently. This restriction limits the broad use of heart pump devices, especially in underserved or rural locations.
  • The most effective treatment for end-stage heart failure is still heart transplantation. However, there is a shortage of appropriate donor hearts, which causes transplant candidates to have to wait a lengthy time for a transplant.

Analysis of Top Countries, Developing, Certifying, and Using Heart Pump Devices

The table below shows the estimated growth rates of the top five countries. South Korea, the United Kingdom, and China are set to record high CAGRs of 22.2%, 21.5%, and 21.7%, respectively, through 2034.

Countries Projected CAGR (2034)
United States 20.7%
United Kingdom 21.5%
China 21.7%
South Korea 22.2%
Japan 18.6%

The table below explains the heart pump device market size of the top five countries for 2034. Among them, the United States is anticipated to remain at the forefront by reaching a valuation of USD 4.5 billion. Japan is expected to reach around USD 2.3 billion by 2034, less than China's USD 4.3 billion.

Countries Market Values
United States USD 4.5 billion
United Kingdom USD 1 billion
China USD 4.3 billion
South Korea USD 1.5 billion
Japan USD 2.3 billion

Rising Prevalence of Obesity and Hypertension to Boost the United States

The United States heart pump device industry is poised to exhibit a CAGR of 20.7% during the assessment period. By 2034, the United States market is expected to reach USD 4.5 billion. The key factors supporting the market growth are:

  • With a sizable percentage of the population suffering from heart failure and illness, it is still a major public health concern in the United States.
  • Heart pump devices are gaining traction in the United States as a therapeutic alternative as the population ages, and risk factors like obesity and hypertension become more common.
  • The most popular heart pump device in the United States is the Left Ventricular Assist Device (LVAD).
  • The growing use of LVADs results from wider indications for usage, better patient outcomes, and developments in device technology.

Growing Clinical Research and Trials Propelling Demand in China

Heart pump device demand in China is anticipated to rise at a steady CAGR of 21.7% during the forecast period. This is attributable to a combination of factors, including:

  • The acceptance and use of heart pump devices in China are heavily influenced by reimbursement guidelines and coverage choices made by commercial insurers & government payers.
  • Clinical research and trials in China are essential to advancing heart pump technology.
  • The report generated by clinical studies regarding device safety, effectiveness, and long-term results influences clinical practice guidelines and treatment decisions.
  • China's regulatory environment is changing to guarantee the effectiveness and safety of medical devices, particularly heart pump devices.

Technological Innovations in Japan Paving the Road for Success

Japan's heart pump device market is expected to reach a valuation of around USD 2.3 billion by 2034. Top factors supporting the market expansion in the country include:

  • Japan is spending more on healthcare to advance cutting-edge medical technologies, increase access to healthcare services, and enhance healthcare infrastructure.
  • Technological development in the device’s design is set to stimulate market expansion and adoption by enhancing device performance, dependability, and patient outcomes.

Growing Consumer Knowledge and Acceptance Upscaling the United Kingdom

The demand for heart pump devices is increasing in the United Kingdom, with a projected CAGR of 21.5% through 2034. Emerging patterns in the United Kingdom market are as follows:

  • The advantages of heart pump devices in treating advanced heart failure are becoming widely known among patients and healthcare professionals in the United Kingdom.
  • Heart pump devices are increasingly accepted and used as therapeutic options in the United Kingdom, particularly when traditional treatments do not work.

Rising Local and Foreign Firms in South Korea Boost Heart Pump Device Adoption

The heart pump device market is projected to increase in South Korea at a CAGR of 22.2% through 2034. The factors driving the market growth are as follows:

  • Local and foreign firms are vying for market share in South Korea's heart pump technology industry.
  • Domestic companies are investing more in research and development to compete with well-established multinational firms and create cutting-edge products in South Korea.
  • Technological advancements, including downsized devices, magnetically levitated centrifugal-flow pumps, and remote monitoring capabilities, are propelling the market's expansion and enhancing the standard of care for patients.

Heart Pump Device Industry Analysis by Top Investment Segments

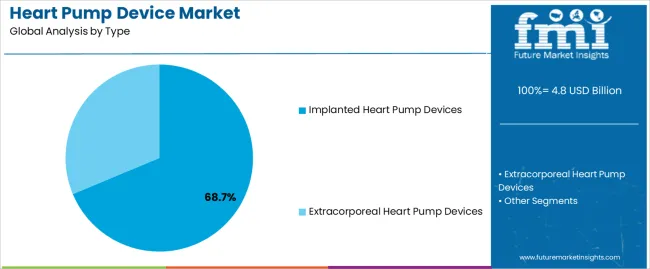
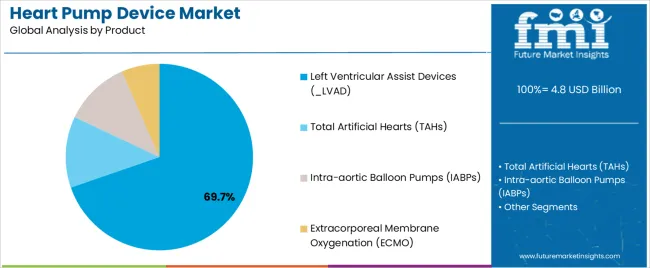
The section below shows the implanted heart pump devices segment dominating by type. The segment is predicted to surge at a 20.0% CAGR through 2034. Based on the product, the ventricular assist devices (VADs) segment is anticipated to generate a dominant share through 2024. It is expected to rise at a CAGR of 19.6% through 2034.

Segment CAGR (2034)
Implanted Heart Pump Devices [Type] 20.0%
Ventricular Assist Devices (VADs) [Product] 19.6%

Implanted Heart Pump Devices to Dominate the Market through 2034

Based on type, the demand for implanted heart pump devices is expected to remain high during the evaluation period.

  • Implanted heart pump devices are gaining traction among heart failure patients who are not eligible for heart transplantation.
  • Technological developments and product innovations in heart pump implantation are expected to fuel this segment's continued expansion.
  • With smaller, more effective devices that require less invasive procedures being developed by manufacturers, implanted heart pump devices use as a therapy option for heart failure patients is predicted to rise.

Ventricular Assist Devices (VADs) Top the Product Category

Based on the product, ventricular assist devices (VADs) are expected to surge at a CAGR of 19.6% through 2034.

  • Due to the growing prevalence of heart failure and developments in device technology, the demand for VADs is rising.
  • As the population ages and the prevalence of heart failure increases, the market for VADs is anticipated to expand further.
  • Continuous technical development aimed at enhancing device performance, longevity, and patient outcomes characterizes the VAD market.
  • Miniaturized devices, wireless monitoring capabilities, and magnetically levitated centrifugal flow pumps are examples of innovations that are improving device reliability and decreasing difficulties.

Leading Suppliers of Heart Pump Devices

Collaborations between medical device companies, research institutions, and healthcare providers are becoming increasingly common. These partnerships facilitate the exchange of knowledge and resources, accelerating the development and adoption of innovative heart pump devices.

Key firms are pursuing strategic initiatives to optimize their market domination, such as acquisitions, mergers, and collaborations. They are introducing cutting-edge products at competitive rates.

For instance

  • In December 2022, Johnson & Johnson acquired Abiomed, Inc. It is expected to operate independently within Johnson & Johnson's MedTech segment.
  • In 2022, Abiomed declared that the FDA approved two clinical research projects involving Impella heart pumps in individuals suffering from acute myocardial infarction (AMI) and cardiogenic shock.
  • In 2022, the School of Medical Research and Technology (SMRT) at IIT Kanpur announced the opening of Hridyantra, a challenge-based initiative to create a cutting-edge artificial heart.

Key Players and Market Concentration in the Heart Pump Device Industry

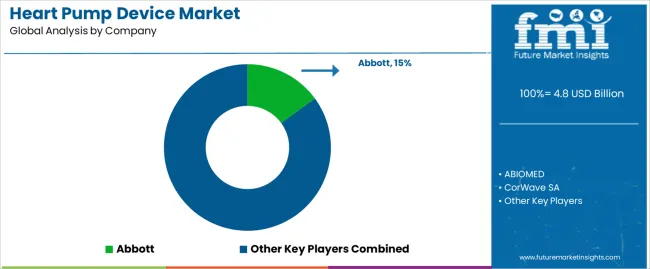
  • Abbott
  • ABIOMED
  • CorWave SA
  • LivaNova PLC
  • Berlin Heart
  • SynCardia Systems
  • LLC
  • Jarvik Heart
  • BiVACOR Inc.

Top Segments Studied in the Heart Pump Device Market

By Type:

  • Implanted Heart Pump Devices
  • Extracorporeal Heart Pump Devices

By Product:

  • Ventricular Assist Devices (VADs)
    • Left Ventricular Assist Devices (LVAD)
    • Right Ventricular Assist Devices (RVAD)
    • Bi-ventricular Assist Devices (BiVAD)
    • Percutaneous Ventricular Assist Devices (PVAD)
  • Total Artificial Hearts (TAHs)
  • Intra-aortic Balloon Pumps (IABPs)
  • Extracorporeal Membrane Oxygenation (ECMO)

By End-use:

  • Hospitals
  • Cardiac Centers
  • Others

By Region:

  • North America
  • Latin America
  • Europe
  • East Asia
  • South Asia
  • Oceania
  • Middle East and Africa

Table of Content

  • 1. Executive Summary
  • 2. Market Overview
  • 3. Market Background
  • 4. Global Market Analysis 2019 to 2023 and Forecast, 2024 to 2034
  • 5. Global Market Analysis 2019 to 2023 and Forecast 2024 to 2034, By Type
    • 5.1. Implanted Heart Pump Devices
    • 5.2. Extracorporeal Heart Pump Devices
  • 6. Global Market Analysis 2019 to 2023 and Forecast 2024 to 2034, By Product
    • 6.1. Ventricular Assist Devices (VADs)
      • 6.1.1. Left Ventricular Assist Devices (LVAD)
      • 6.1.2. Right Ventricular Assist Devices (RVAD)
      • 6.1.3. Bi-ventricular Assist Devices (BiVAD)
      • 6.1.4. Percutaneous Ventricular Assist Devices (PVAD)
    • 6.2. Total Artificial Hearts (TAHs)
    • 6.3. Intra-aortic Balloon Pumps (IABPs)
    • 6.4. Extracorporeal Membrane Oxygenation (ECMO)
  • 7. Global Market Analysis 2019 to 2023 and Forecast 2024 to 2034, By End-use
    • 7.1. Hospitals
    • 7.2. Cardiac Centers
    • 7.3. Others
  • 8. Global Market Analysis 2019 to 2023 and Forecast 2024 to 2034, By Region
    • 8.1. North America
    • 8.2. Latin America
    • 8.3. Western Europe
    • 8.4. Eastern Europe
    • 8.5. South Asia and Pacific
    • 8.6. East Asia
    • 8.7. Middle East and Africa
  • 9. North America Market Analysis 2019 to 2023 and Forecast 2024 to 2034, By Country
  • 10. Latin America Market Analysis 2019 to 2023 and Forecast 2024 to 2034, By Country
  • 11. Western Europe Market Analysis 2019 to 2023 and Forecast 2024 to 2034, By Country
  • 12. Eastern Europe Market Analysis 2019 to 2023 and Forecast 2024 to 2034, By Country
  • 13. South Asia and Pacific Market Analysis 2019 to 2023 and Forecast 2024 to 2034, By Country
  • 14. East Asia Market Analysis 2019 to 2023 and Forecast 2024 to 2034, By Country
  • 15. Middle East and Africa Market Analysis 2019 to 2023 and Forecast 2024 to 2034, By Country
  • 16. Key Countries Market Analysis
  • 17. Market Structure Analysis
  • 18. Competition Analysis
    • 18.1. Abbott
    • 18.2. ABIOMED
    • 18.3. CorWave SA
    • 18.4. LivaNova PLC
    • 18.5. Berlin Heart
    • 18.6. SynCardia Systems, LLC
    • 18.7. Jarvik Heart
    • 18.8. BiVACOR Inc.
    • 18.9. Leviticus Cardio
    • 18.10. Evaheart, Inc.
    • 18.11. Teleflex Incorporated
    • 18.12. Getinge AB
    • 18.13. CARMAT
  • 19. Assumptions & Acronyms Used
  • 20. Research Methodology

List of Tables

Table 1: Global Market Value (US$ billion) Forecast by Region, 2019 to 2034

Table 2: Global Market Volume (Units) Forecast by Region, 2019 to 2034

Table 3: Global Market Value (US$ billion) Forecast by Type, 2019 to 2034

Table 4: Global Market Volume (Units) Forecast by Type, 2019 to 2034

Table 5: Global Market Value (US$ billion) Forecast by Product, 2019 to 2034

Table 6: Global Market Volume (Units) Forecast by Product, 2019 to 2034

Table 7: Global Market Value (US$ billion) Forecast by End-use, 2019 to 2034

Table 8: Global Market Volume (Units) Forecast by End-use, 2019 to 2034

Table 9: North America Market Value (US$ billion) Forecast by Country, 2019 to 2034

Table 10: North America Market Volume (Units) Forecast by Country, 2019 to 2034

Table 11: North America Market Value (US$ billion) Forecast by Type, 2019 to 2034

Table 12: North America Market Volume (Units) Forecast by Type, 2019 to 2034

Table 13: North America Market Value (US$ billion) Forecast by Product, 2019 to 2034

Table 14: North America Market Volume (Units) Forecast by Product, 2019 to 2034

Table 15: North America Market Value (US$ billion) Forecast by End-use, 2019 to 2034

Table 16: North America Market Volume (Units) Forecast by End-use, 2019 to 2034

Table 17: Latin America Market Value (US$ billion) Forecast by Country, 2019 to 2034

Table 18: Latin America Market Volume (Units) Forecast by Country, 2019 to 2034

Table 19: Latin America Market Value (US$ billion) Forecast by Type, 2019 to 2034

Table 20: Latin America Market Volume (Units) Forecast by Type, 2019 to 2034

Table 21: Latin America Market Value (US$ billion) Forecast by Product, 2019 to 2034

Table 22: Latin America Market Volume (Units) Forecast by Product, 2019 to 2034

Table 23: Latin America Market Value (US$ billion) Forecast by End-use, 2019 to 2034

Table 24: Latin America Market Volume (Units) Forecast by End-use, 2019 to 2034

Table 25: Western Europe Market Value (US$ billion) Forecast by Country, 2019 to 2034

Table 26: Western Europe Market Volume (Units) Forecast by Country, 2019 to 2034

Table 27: Western Europe Market Value (US$ billion) Forecast by Type, 2019 to 2034

Table 28: Western Europe Market Volume (Units) Forecast by Type, 2019 to 2034

Table 29: Western Europe Market Value (US$ billion) Forecast by Product, 2019 to 2034

Table 30: Western Europe Market Volume (Units) Forecast by Product, 2019 to 2034

Table 31: Western Europe Market Value (US$ billion) Forecast by End-use, 2019 to 2034

Table 32: Western Europe Market Volume (Units) Forecast by End-use, 2019 to 2034

Table 33: Eastern Europe Market Value (US$ billion) Forecast by Country, 2019 to 2034

Table 34: Eastern Europe Market Volume (Units) Forecast by Country, 2019 to 2034

Table 35: Eastern Europe Market Value (US$ billion) Forecast by Type, 2019 to 2034

Table 36: Eastern Europe Market Volume (Units) Forecast by Type, 2019 to 2034

Table 37: Eastern Europe Market Value (US$ billion) Forecast by Product, 2019 to 2034

Table 38: Eastern Europe Market Volume (Units) Forecast by Product, 2019 to 2034

Table 39: Eastern Europe Market Value (US$ billion) Forecast by End-use, 2019 to 2034

Table 40: Eastern Europe Market Volume (Units) Forecast by End-use, 2019 to 2034

Table 41: South Asia and Pacific Market Value (US$ billion) Forecast by Country, 2019 to 2034

Table 42: South Asia and Pacific Market Volume (Units) Forecast by Country, 2019 to 2034

Table 43: South Asia and Pacific Market Value (US$ billion) Forecast by Type, 2019 to 2034

Table 44: South Asia and Pacific Market Volume (Units) Forecast by Type, 2019 to 2034

Table 45: South Asia and Pacific Market Value (US$ billion) Forecast by Product, 2019 to 2034

Table 46: South Asia and Pacific Market Volume (Units) Forecast by Product, 2019 to 2034

Table 47: South Asia and Pacific Market Value (US$ billion) Forecast by End-use, 2019 to 2034

Table 48: South Asia and Pacific Market Volume (Units) Forecast by End-use, 2019 to 2034

Table 49: East Asia Market Value (US$ billion) Forecast by Country, 2019 to 2034

Table 50: East Asia Market Volume (Units) Forecast by Country, 2019 to 2034

Table 51: East Asia Market Value (US$ billion) Forecast by Type, 2019 to 2034

Table 52: East Asia Market Volume (Units) Forecast by Type, 2019 to 2034

Table 53: East Asia Market Value (US$ billion) Forecast by Product, 2019 to 2034

Table 54: East Asia Market Volume (Units) Forecast by Product, 2019 to 2034

Table 55: East Asia Market Value (US$ billion) Forecast by End-use, 2019 to 2034

Table 56: East Asia Market Volume (Units) Forecast by End-use, 2019 to 2034

Table 57: Middle East and Africa Market Value (US$ billion) Forecast by Country, 2019 to 2034

Table 58: Middle East and Africa Market Volume (Units) Forecast by Country, 2019 to 2034

Table 59: Middle East and Africa Market Value (US$ billion) Forecast by Type, 2019 to 2034

Table 60: Middle East and Africa Market Volume (Units) Forecast by Type, 2019 to 2034

Table 61: Middle East and Africa Market Value (US$ billion) Forecast by Product, 2019 to 2034

Table 62: Middle East and Africa Market Volume (Units) Forecast by Product, 2019 to 2034

Table 63: Middle East and Africa Market Value (US$ billion) Forecast by End-use, 2019 to 2034

Table 64: Middle East and Africa Market Volume (Units) Forecast by End-use, 2019 to 2034

List of Figures

Figure 1: Global Market Value (US$ billion) by Type, 2024 to 2034

Figure 2: Global Market Value (US$ billion) by Product, 2024 to 2034

Figure 3: Global Market Value (US$ billion) by End-use, 2024 to 2034

Figure 4: Global Market Value (US$ billion) by Region, 2024 to 2034

Figure 5: Global Market Value (US$ billion) Analysis by Region, 2019 to 2034

Figure 6: Global Market Volume (Units) Analysis by Region, 2019 to 2034

Figure 7: Global Market Value Share (%) and BPS Analysis by Region, 2024 to 2034

Figure 8: Global Market Y-o-Y Growth (%) Projections by Region, 2024 to 2034

Figure 9: Global Market Value (US$ billion) Analysis by Type, 2019 to 2034

Figure 10: Global Market Volume (Units) Analysis by Type, 2019 to 2034

Figure 11: Global Market Value Share (%) and BPS Analysis by Type, 2024 to 2034

Figure 12: Global Market Y-o-Y Growth (%) Projections by Type, 2024 to 2034

Figure 13: Global Market Value (US$ billion) Analysis by Product, 2019 to 2034

Figure 14: Global Market Volume (Units) Analysis by Product, 2019 to 2034

Figure 15: Global Market Value Share (%) and BPS Analysis by Product, 2024 to 2034

Figure 16: Global Market Y-o-Y Growth (%) Projections by Product, 2024 to 2034

Figure 17: Global Market Value (US$ billion) Analysis by End-use, 2019 to 2034

Figure 18: Global Market Volume (Units) Analysis by End-use, 2019 to 2034

Figure 19: Global Market Value Share (%) and BPS Analysis by End-use, 2024 to 2034

Figure 20: Global Market Y-o-Y Growth (%) Projections by End-use, 2024 to 2034

Figure 21: Global Market Attractiveness by Type, 2024 to 2034

Figure 22: Global Market Attractiveness by Product, 2024 to 2034

Figure 23: Global Market Attractiveness by End-use, 2024 to 2034

Figure 24: Global Market Attractiveness by Region, 2024 to 2034

Figure 25: North America Market Value (US$ billion) by Type, 2024 to 2034

Figure 26: North America Market Value (US$ billion) by Product, 2024 to 2034

Figure 27: North America Market Value (US$ billion) by End-use, 2024 to 2034

Figure 28: North America Market Value (US$ billion) by Country, 2024 to 2034

Figure 29: North America Market Value (US$ billion) Analysis by Country, 2019 to 2034

Figure 30: North America Market Volume (Units) Analysis by Country, 2019 to 2034

Figure 31: North America Market Value Share (%) and BPS Analysis by Country, 2024 to 2034

Figure 32: North America Market Y-o-Y Growth (%) Projections by Country, 2024 to 2034

Figure 33: North America Market Value (US$ billion) Analysis by Type, 2019 to 2034

Figure 34: North America Market Volume (Units) Analysis by Type, 2019 to 2034

Figure 35: North America Market Value Share (%) and BPS Analysis by Type, 2024 to 2034

Figure 36: North America Market Y-o-Y Growth (%) Projections by Type, 2024 to 2034

Figure 37: North America Market Value (US$ billion) Analysis by Product, 2019 to 2034

Figure 38: North America Market Volume (Units) Analysis by Product, 2019 to 2034

Figure 39: North America Market Value Share (%) and BPS Analysis by Product, 2024 to 2034

Figure 40: North America Market Y-o-Y Growth (%) Projections by Product, 2024 to 2034

Figure 41: North America Market Value (US$ billion) Analysis by End-use, 2019 to 2034

Figure 42: North America Market Volume (Units) Analysis by End-use, 2019 to 2034

Figure 43: North America Market Value Share (%) and BPS Analysis by End-use, 2024 to 2034

Figure 44: North America Market Y-o-Y Growth (%) Projections by End-use, 2024 to 2034

Figure 45: North America Market Attractiveness by Type, 2024 to 2034

Figure 46: North America Market Attractiveness by Product, 2024 to 2034

Figure 47: North America Market Attractiveness by End-use, 2024 to 2034

Figure 48: North America Market Attractiveness by Country, 2024 to 2034

Figure 49: Latin America Market Value (US$ billion) by Type, 2024 to 2034

Figure 50: Latin America Market Value (US$ billion) by Product, 2024 to 2034

Figure 51: Latin America Market Value (US$ billion) by End-use, 2024 to 2034

Figure 52: Latin America Market Value (US$ billion) by Country, 2024 to 2034

Figure 53: Latin America Market Value (US$ billion) Analysis by Country, 2019 to 2034

Figure 54: Latin America Market Volume (Units) Analysis by Country, 2019 to 2034

Figure 55: Latin America Market Value Share (%) and BPS Analysis by Country, 2024 to 2034

Figure 56: Latin America Market Y-o-Y Growth (%) Projections by Country, 2024 to 2034

Figure 57: Latin America Market Value (US$ billion) Analysis by Type, 2019 to 2034

Figure 58: Latin America Market Volume (Units) Analysis by Type, 2019 to 2034

Figure 59: Latin America Market Value Share (%) and BPS Analysis by Type, 2024 to 2034

Figure 60: Latin America Market Y-o-Y Growth (%) Projections by Type, 2024 to 2034

Figure 61: Latin America Market Value (US$ billion) Analysis by Product, 2019 to 2034

Figure 62: Latin America Market Volume (Units) Analysis by Product, 2019 to 2034

Figure 63: Latin America Market Value Share (%) and BPS Analysis by Product, 2024 to 2034

Figure 64: Latin America Market Y-o-Y Growth (%) Projections by Product, 2024 to 2034

Figure 65: Latin America Market Value (US$ billion) Analysis by End-use, 2019 to 2034

Figure 66: Latin America Market Volume (Units) Analysis by End-use, 2019 to 2034

Figure 67: Latin America Market Value Share (%) and BPS Analysis by End-use, 2024 to 2034

Figure 68: Latin America Market Y-o-Y Growth (%) Projections by End-use, 2024 to 2034

Figure 69: Latin America Market Attractiveness by Type, 2024 to 2034

Figure 70: Latin America Market Attractiveness by Product, 2024 to 2034

Figure 71: Latin America Market Attractiveness by End-use, 2024 to 2034

Figure 72: Latin America Market Attractiveness by Country, 2024 to 2034

Figure 73: Western Europe Market Value (US$ billion) by Type, 2024 to 2034

Figure 74: Western Europe Market Value (US$ billion) by Product, 2024 to 2034

Figure 75: Western Europe Market Value (US$ billion) by End-use, 2024 to 2034

Figure 76: Western Europe Market Value (US$ billion) by Country, 2024 to 2034

Figure 77: Western Europe Market Value (US$ billion) Analysis by Country, 2019 to 2034

Figure 78: Western Europe Market Volume (Units) Analysis by Country, 2019 to 2034

Figure 79: Western Europe Market Value Share (%) and BPS Analysis by Country, 2024 to 2034

Figure 80: Western Europe Market Y-o-Y Growth (%) Projections by Country, 2024 to 2034

Figure 81: Western Europe Market Value (US$ billion) Analysis by Type, 2019 to 2034

Figure 82: Western Europe Market Volume (Units) Analysis by Type, 2019 to 2034

Figure 83: Western Europe Market Value Share (%) and BPS Analysis by Type, 2024 to 2034

Figure 84: Western Europe Market Y-o-Y Growth (%) Projections by Type, 2024 to 2034

Figure 85: Western Europe Market Value (US$ billion) Analysis by Product, 2019 to 2034

Figure 86: Western Europe Market Volume (Units) Analysis by Product, 2019 to 2034

Figure 87: Western Europe Market Value Share (%) and BPS Analysis by Product, 2024 to 2034

Figure 88: Western Europe Market Y-o-Y Growth (%) Projections by Product, 2024 to 2034

Figure 89: Western Europe Market Value (US$ billion) Analysis by End-use, 2019 to 2034

Figure 90: Western Europe Market Volume (Units) Analysis by End-use, 2019 to 2034

Figure 91: Western Europe Market Value Share (%) and BPS Analysis by End-use, 2024 to 2034

Figure 92: Western Europe Market Y-o-Y Growth (%) Projections by End-use, 2024 to 2034

Figure 93: Western Europe Market Attractiveness by Type, 2024 to 2034

Figure 94: Western Europe Market Attractiveness by Product, 2024 to 2034

Figure 95: Western Europe Market Attractiveness by End-use, 2024 to 2034

Figure 96: Western Europe Market Attractiveness by Country, 2024 to 2034

Figure 97: Eastern Europe Market Value (US$ billion) by Type, 2024 to 2034

Figure 98: Eastern Europe Market Value (US$ billion) by Product, 2024 to 2034

Figure 99: Eastern Europe Market Value (US$ billion) by End-use, 2024 to 2034

Figure 100: Eastern Europe Market Value (US$ billion) by Country, 2024 to 2034

Figure 101: Eastern Europe Market Value (US$ billion) Analysis by Country, 2019 to 2034

Figure 102: Eastern Europe Market Volume (Units) Analysis by Country, 2019 to 2034

Figure 103: Eastern Europe Market Value Share (%) and BPS Analysis by Country, 2024 to 2034

Figure 104: Eastern Europe Market Y-o-Y Growth (%) Projections by Country, 2024 to 2034

Figure 105: Eastern Europe Market Value (US$ billion) Analysis by Type, 2019 to 2034

Figure 106: Eastern Europe Market Volume (Units) Analysis by Type, 2019 to 2034

Figure 107: Eastern Europe Market Value Share (%) and BPS Analysis by Type, 2024 to 2034

Figure 108: Eastern Europe Market Y-o-Y Growth (%) Projections by Type, 2024 to 2034

Figure 109: Eastern Europe Market Value (US$ billion) Analysis by Product, 2019 to 2034

Figure 110: Eastern Europe Market Volume (Units) Analysis by Product, 2019 to 2034

Figure 111: Eastern Europe Market Value Share (%) and BPS Analysis by Product, 2024 to 2034

Figure 112: Eastern Europe Market Y-o-Y Growth (%) Projections by Product, 2024 to 2034

Figure 113: Eastern Europe Market Value (US$ billion) Analysis by End-use, 2019 to 2034

Figure 114: Eastern Europe Market Volume (Units) Analysis by End-use, 2019 to 2034

Figure 115: Eastern Europe Market Value Share (%) and BPS Analysis by End-use, 2024 to 2034

Figure 116: Eastern Europe Market Y-o-Y Growth (%) Projections by End-use, 2024 to 2034

Figure 117: Eastern Europe Market Attractiveness by Type, 2024 to 2034

Figure 118: Eastern Europe Market Attractiveness by Product, 2024 to 2034

Figure 119: Eastern Europe Market Attractiveness by End-use, 2024 to 2034

Figure 120: Eastern Europe Market Attractiveness by Country, 2024 to 2034

Figure 121: South Asia and Pacific Market Value (US$ billion) by Type, 2024 to 2034

Figure 122: South Asia and Pacific Market Value (US$ billion) by Product, 2024 to 2034

Figure 123: South Asia and Pacific Market Value (US$ billion) by End-use, 2024 to 2034

Figure 124: South Asia and Pacific Market Value (US$ billion) by Country, 2024 to 2034

Figure 125: South Asia and Pacific Market Value (US$ billion) Analysis by Country, 2019 to 2034

Figure 126: South Asia and Pacific Market Volume (Units) Analysis by Country, 2019 to 2034

Figure 127: South Asia and Pacific Market Value Share (%) and BPS Analysis by Country, 2024 to 2034

Figure 128: South Asia and Pacific Market Y-o-Y Growth (%) Projections by Country, 2024 to 2034

Figure 129: South Asia and Pacific Market Value (US$ billion) Analysis by Type, 2019 to 2034

Figure 130: South Asia and Pacific Market Volume (Units) Analysis by Type, 2019 to 2034

Figure 131: South Asia and Pacific Market Value Share (%) and BPS Analysis by Type, 2024 to 2034

Figure 132: South Asia and Pacific Market Y-o-Y Growth (%) Projections by Type, 2024 to 2034

Figure 133: South Asia and Pacific Market Value (US$ billion) Analysis by Product, 2019 to 2034

Figure 134: South Asia and Pacific Market Volume (Units) Analysis by Product, 2019 to 2034

Figure 135: South Asia and Pacific Market Value Share (%) and BPS Analysis by Product, 2024 to 2034

Figure 136: South Asia and Pacific Market Y-o-Y Growth (%) Projections by Product, 2024 to 2034

Figure 137: South Asia and Pacific Market Value (US$ billion) Analysis by End-use, 2019 to 2034

Figure 138: South Asia and Pacific Market Volume (Units) Analysis by End-use, 2019 to 2034

Figure 139: South Asia and Pacific Market Value Share (%) and BPS Analysis by End-use, 2024 to 2034

Figure 140: South Asia and Pacific Market Y-o-Y Growth (%) Projections by End-use, 2024 to 2034

Figure 141: South Asia and Pacific Market Attractiveness by Type, 2024 to 2034

Figure 142: South Asia and Pacific Market Attractiveness by Product, 2024 to 2034

Figure 143: South Asia and Pacific Market Attractiveness by End-use, 2024 to 2034

Figure 144: South Asia and Pacific Market Attractiveness by Country, 2024 to 2034

Figure 145: East Asia Market Value (US$ billion) by Type, 2024 to 2034

Figure 146: East Asia Market Value (US$ billion) by Product, 2024 to 2034

Figure 147: East Asia Market Value (US$ billion) by End-use, 2024 to 2034

Figure 148: East Asia Market Value (US$ billion) by Country, 2024 to 2034

Figure 149: East Asia Market Value (US$ billion) Analysis by Country, 2019 to 2034

Figure 150: East Asia Market Volume (Units) Analysis by Country, 2019 to 2034

Figure 151: East Asia Market Value Share (%) and BPS Analysis by Country, 2024 to 2034

Figure 152: East Asia Market Y-o-Y Growth (%) Projections by Country, 2024 to 2034

Figure 153: East Asia Market Value (US$ billion) Analysis by Type, 2019 to 2034

Figure 154: East Asia Market Volume (Units) Analysis by Type, 2019 to 2034

Figure 155: East Asia Market Value Share (%) and BPS Analysis by Type, 2024 to 2034

Figure 156: East Asia Market Y-o-Y Growth (%) Projections by Type, 2024 to 2034

Figure 157: East Asia Market Value (US$ billion) Analysis by Product, 2019 to 2034

Figure 158: East Asia Market Volume (Units) Analysis by Product, 2019 to 2034

Figure 159: East Asia Market Value Share (%) and BPS Analysis by Product, 2024 to 2034

Figure 160: East Asia Market Y-o-Y Growth (%) Projections by Product, 2024 to 2034

Figure 161: East Asia Market Value (US$ billion) Analysis by End-use, 2019 to 2034

Figure 162: East Asia Market Volume (Units) Analysis by End-use, 2019 to 2034

Figure 163: East Asia Market Value Share (%) and BPS Analysis by End-use, 2024 to 2034

Figure 164: East Asia Market Y-o-Y Growth (%) Projections by End-use, 2024 to 2034

Figure 165: East Asia Market Attractiveness by Type, 2024 to 2034

Figure 166: East Asia Market Attractiveness by Product, 2024 to 2034

Figure 167: East Asia Market Attractiveness by End-use, 2024 to 2034

Figure 168: East Asia Market Attractiveness by Country, 2024 to 2034

Figure 169: Middle East and Africa Market Value (US$ billion) by Type, 2024 to 2034

Figure 170: Middle East and Africa Market Value (US$ billion) by Product, 2024 to 2034

Figure 171: Middle East and Africa Market Value (US$ billion) by End-use, 2024 to 2034

Figure 172: Middle East and Africa Market Value (US$ billion) by Country, 2024 to 2034

Figure 173: Middle East and Africa Market Value (US$ billion) Analysis by Country, 2019 to 2034

Figure 174: Middle East and Africa Market Volume (Units) Analysis by Country, 2019 to 2034

Figure 175: Middle East and Africa Market Value Share (%) and BPS Analysis by Country, 2024 to 2034

Figure 176: Middle East and Africa Market Y-o-Y Growth (%) Projections by Country, 2024 to 2034

Figure 177: Middle East and Africa Market Value (US$ billion) Analysis by Type, 2019 to 2034

Figure 178: Middle East and Africa Market Volume (Units) Analysis by Type, 2019 to 2034

Figure 179: Middle East and Africa Market Value Share (%) and BPS Analysis by Type, 2024 to 2034

Figure 180: Middle East and Africa Market Y-o-Y Growth (%) Projections by Type, 2024 to 2034

Figure 181: Middle East and Africa Market Value (US$ billion) Analysis by Product, 2019 to 2034

Figure 182: Middle East and Africa Market Volume (Units) Analysis by Product, 2019 to 2034

Figure 183: Middle East and Africa Market Value Share (%) and BPS Analysis by Product, 2024 to 2034

Figure 184: Middle East and Africa Market Y-o-Y Growth (%) Projections by Product, 2024 to 2034

Figure 185: Middle East and Africa Market Value (US$ billion) Analysis by End-use, 2019 to 2034

Figure 186: Middle East and Africa Market Volume (Units) Analysis by End-use, 2019 to 2034

Figure 187: Middle East and Africa Market Value Share (%) and BPS Analysis by End-use, 2024 to 2034

Figure 188: Middle East and Africa Market Y-o-Y Growth (%) Projections by End-use, 2024 to 2034

Figure 189: Middle East and Africa Market Attractiveness by Type, 2024 to 2034

Figure 190: Middle East and Africa Market Attractiveness by Product, 2024 to 2034

Figure 191: Middle East and Africa Market Attractiveness by End-use, 2024 to 2034

Figure 192: Middle East and Africa Market Attractiveness by Country, 2024 to 2034

Frequently Asked Questions

How big is the heart pump device market?

The market is set to reach USD 4.0 billion in 2024.

What is the forecast for the heart pump device market?

Demand for heart pump devices is slated to expand at a 20.4% CAGR by 2034.

What is the outlook for the heart pump device market?

The market is expected to reach USD 25.4 billion in 2034.

Who are the key players in the heart pump device market?

Abbott, ABIOMED, and CorWave SA are the key players.

Which type would lead the heart pump device market?

The implanted heart pump devices segment is estimated to hold a significant market share.

Explore Similar Insights

Future Market Insights

Heart Pump Device Market