Hemp Animal Feed Market Share, and Forecast Outlook 2025 to 2035

The global hemp animal feed market is projected to expand from USD 657. 3 million in 2025 to USD 927.2 million by 2035, growing at a CAGR of 3.5%. Growth is being shaped by increased use of hemp seed cake, high-fiber stalk meal, and cannabinoid-regulated biomass in ruminant and aquaculture diets.
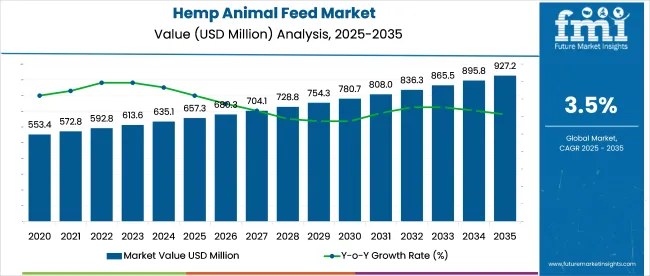
Quick Stats of the Hemp Animal Feed Market

  • Hemp Animal Feed Market Size (2025):USD 657.3 million
  • Projected Hemp Animal Feed Market Size (2035):USD 927.2 million
  • Forecast CAGR of Hemp Animal Feed Market (2025 to 2035): 3.5%
  • Leading Segment of Hemp Animal Feed Market (2025): Hemp Seed Meal (38%)
  • Key Growth Regions of Hemp Animal Feed Market: South Asia
  • Top Key Players of Hemp Animal Feed Market: Hemp Feed Coalition, Victory Hemp Foods, Hemp Oil Canada (Fresh Hemp Foods Ltd.), Blue Sky Hemp Ventures, Z-Company

Hemp Animal Feed Market

Metric Value
Market Size in 2025 USD 657. 3 million
Projected Market Size in 2035 USD 927.2 million
CAGR (2025 to 2035) 3.5%

North American suppliers are scaling co-product processing, while European buyers demand strict traceability and residue compliance. Inclusion rates of 10-18% in cattle feed trials have shown improved digestibility and omega profile. Challenges remain around THC thresholds, inconsistent supply chains, and lack of pelleting infrastructure for mass-market integration.

In September 2024, growing interest in hemp as a livestock feed ingredient was accompanied by mounting regulatory caution, particularly around the use of cannabidiol (CBD). “What we have seen is the early indications of liver toxicity there are also data related to reproductive toxicity for males that comes from a rat study in which the male offspring of rats that were given amounts of CBD have significantly decreased testicular sizes and function,” said Norman Birenbaum, Senior Public Health Advisor at the FDA’s Center for Drug Evaluation and Research, during the National Association of State Departments of Agriculture annual meeting.

The hemp animal feed market, valued under 250 million in 2025, remains a minor yet growing part of broader feed sectors. In the global animal feed market, its share is just 0.04-0.05%, limited by regulation and supply issues. Within plant-based feed, hemp contributes 0.6-0.8%, while in functional feed, its share is 0.5-0.7%, tied to digestive and anti-inflammatory benefits.

Hempseed cake holds 1.5-2% of the oilseed meal market. In the natural and organic feed segment, hemp accounts for 2-3%, driven by its traceability, non-GMO appeal, and nutritional profile, especially in poultry, aquafeed, and small livestock applications.

Analyzing Hemp Animal Feed Market by Top Investment Segments

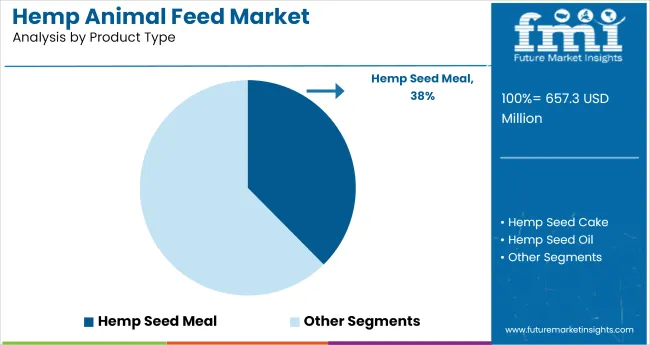
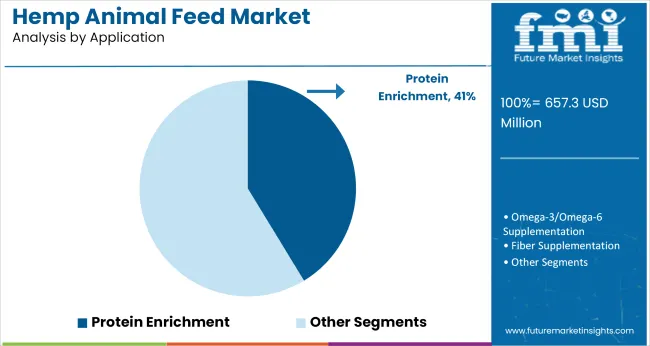
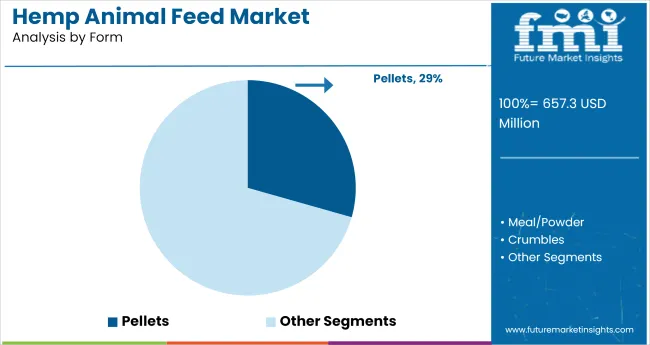
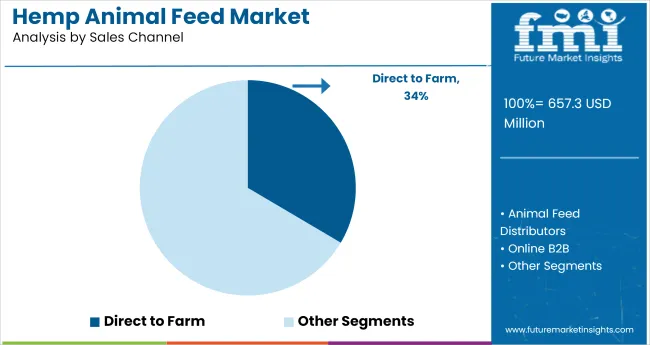
The hemp animal feed market is led by hemp seed meal under product type with a 38% share. Ruminants (cattle, sheep, goats) dominate livestock consumption with a 32.8% share. Protein enrichment leads functional applications at 41% share. Pellets account for 29% share in form-based demand. Direct-to-farm channels contribute 34% share of sales.

Non-GMO certified hemp feed holds a 29.2% share, while commercial livestock farms represent the largest end-use category with a 35.7% share. Strongest regional demand is noted across North America, Western Europe, and South Asia & Pacific.
Hemp Seed Meal Drives Product Demand

Hemp Animal Feed Market Analysis By Product Type

Hemp seed meal held a 38% share of the hemp animal feed market in 2025. This cold-pressed byproduct, sourced after oil extraction, has been favored for its high protein concentration, residual essential fatty acids, and digestibility. It is commonly integrated into dairy, poultry, and goat feed rations.

Countries like Canada, Poland, and India have expanded domestic production of hemp meal for contract feed mills. Its amino acid profile supports lean growth, while its fiber assists gut function. Demand has grown in compound feed systems for ruminants and poultry where consistency and oil retention are prioritized over raw seed inclusion.

  • Manitoba Hemp Feeds delivers bulk hemp meal to Canadian dairy cooperatives.
  • HemPoland supplies defatted seed meal for cattle feed in Central Europe.
  • NourishWell India integrates hemp meal in poultry starter feed.

Ruminants Lead Livestock Consumption Segment

Ruminants accounted for a 32.8% share of total hemp feed consumption in 2025. Hemp-based feed is used in TMR systems, silage supplementation, and grain-based blends. Its lignin and fiber structure promotes rumen activity, while residual oil enhances milk fat content.

Major dairy and goat producers in France, New Zealand, and the USA have incorporated hemp as a functional fiber and energy additive. Feed trials across Europe have shown better feed efficiency and output consistency, especially in meat goat and organic dairy sectors. Hemp’s integration has aligned with the shift toward non-pharmaceutical gut modulation across small and large-scale ruminant farms.
  • Blue River Dairy (New Zealand) uses hemp blends in protein-rich feed for goats.
  • NutriGraze USA applies hemp mash in beef cattle grow-out diets.
  • La Ferme Verte (France) uses hemp-infused silage in organic dairy operations.

Protein Enrichment Tops Functional Applications

Hemp Animal Feed Market Analysis By Application

Protein enrichment led the functional claims category with a 41% share in 2025. Hemp’s high lysine and methionine content, coupled with digestibility, made it ideal for piglets, calves, and poultry. Feed manufacturers have used hemp protein as an alternative to soy and fish meal in growth-stage diets.

Results from trials in Vietnam and the Netherlands reported improved weight gain and intestinal development. The protein component has also shown compatibility with mineral premixes and probiotic additives. Preference for hemp as a clean-label protein source has grown across commercial livestock farms focused on reducing metabolic waste and improving nitrogen efficiency.
  • VDS Feeds Netherlands includes hemp protein in high-performance pig diets.
  • GreenFarms Vietnam trials hemp mash in post-weaning rations.
  • Argentina’s CampoFuerte Feed integrates hemp protein in calf starter mixes.

Pellets Chosen for Stability and Storage

Hemp Animal Feed Market Analysis By Form

Pelletized hemp feed accounted for a 29% share of total volume in 2025. Pellets offer enhanced stability, long storage life, and ease of dosing in automated feeding systems. The low-heat process used in pelletization retains bioactive oil fractions and protein integrity. Pellets are particularly favored in coastal and humid regions where moisture control is a concern.

Australia, Germany, and the USA have seen rising demand for pellet lines tailored by species and age group. Feed manufacturers have used this format to improve logistical efficiency, ensure formulation accuracy, and reduce product loss during transport and bulk storage.
  • AustHemp FeedTech produces pelletized formulations for Australian sheep stations.
  • HempHarvest USA supplies pellets tailored for midwestern cattle operations.
  • HanfFutter Germany offers hemp pellets for mixed livestock farms.

Direct-to-Farm Channels Dominate Distribution

Hemp Animal Feed Market Analysis By Sales Channel

Direct-to-farm supply routes commanded a 34% share in 2025, as livestock operators prioritized flexibility, traceability, and cost control. This model allowed hemp processors to bypass traditional distribution chains and work directly with farmers to optimize feed rations by lifecycle and forage profile. Regional suppliers in the USA, Brazil, and Ukraine have used subscription logistics to supply hemp mash, pellets, and meal in bulk.

The channel has also enabled on-site feed formulation adjustments and real-time feedback loops. Farmer cooperatives and contract producers have especially embraced direct procurement models for consistent quality and custom feed application.

  • HempLivestock Co. (USA) supplies hemp mash and pellets to Midwest dairy farms.
  • BioHemp Brasil partners with organic farms for customized poultry diets.
  • AgroKon Ukraine provides hemp formulations via direct feed subscription.

Non-GMO Certification Shapes Product Positioning

Non-GMO certified hemp feed held a 29.2% share of the market in 2025. With increased attention to feed traceability and compliance in Western Europe and North America, non-GMO certification has become a standard among large livestock producers. Hemp processors in Austria, Canada, and South Korea have invested in verification systems and third-party lab testing to meet feed and meat labeling requirements.

These products are particularly in demand by meat and dairy suppliers serving non-GMO and antibiotic-free market segments. Regulatory pressure and buyer preferences are expected to further increase adoption of verified hemp inputs in export-led livestock supply chains.

  • HanfFarm Austria offers certified non-GMO hemp feed for Alpine dairy producers.
  • GreenSpectrum Canada supplies non-GMO protein to free-range poultry farms.
  • South Korea’s H-Farms certifies hemp meal for antibiotic-free pig farms.

Commercial Livestock Farms Lead End-Use Demand

Commercial livestock farms held a 35.7% share in 2025, driven by the integration of hemp feed into controlled, high-throughput animal rearing systems. These farms use standardized rations, and hemp’s inclusion has improved feed conversion ratios (FCR), gut resilience, and protein absorption. Producers in the USA, China, and Chile have piloted hemp formulations in beef, poultry, and aquaculture settings.

Trials have shown strong compatibility with antibiotic-free and export-compliant production strategies. Hemp’s consistent nutrient profile and fiber content make it suitable for integration into proprietary feed formulas managed at scale with minimal formulation volatility.

  • MidValley Feeders (USA) integrates hemp meal into commercial beef operations.
  • Yangtze Aquafeed (China) uses hemp mash in fish diets with reduced soy inputs.
  • AquaLac Chile pilots hemp-based feeds in salmonid farming regions.

Top Hemp Animal Feed Market Dynamics

The hemp-based animal feed industry is experiencing rapid expansion. Growth is supported by the nutritional density of hemp inputs and growing interest in alternative, functional ingredients across livestock, aquaculture, and companion animals. Still, uncertainties around THC thresholds, inconsistent biomass processing, and regional regulatory delays continue to pose structural barriers.

Nutritional Advantages Driving Adoption in Feed Applications

Hemp seed meal, oil, and residual biomass are being explored for their high protein content, omega fatty acid ratios, and anti-inflammatory bioactives. These feed components have shown potential to enhance animal health, product quality, and feed conversion metrics, especially in ruminants, poultry, and aquaculture sectors. Their integration into premium pet foods and livestock diets is expanding in North America and Europe.

  • Hemp seed cake improved meat fatty acid profiles and oxidative stability in broiler trials (Exploration Publishing)
  • Fish diets containing hemp residue showed improved consumer preference for fillet texture and flavor (Taylor & Francis)
  • Hemp oil supplements in pet and aquafeed showed reduced inflammatory markers in trial animals (BioMed Central, Feed & Grain)

Regulatory & Supply Chain Constraints Limiting Penetration

Despite performance advantages, widespread use is constrained by lack of standardized approvals across species and jurisdictions. THC carryover risks and residue testing thresholds have slowed adoption in food-producing animals. Many producers lack infrastructure for microbial stabilization and traceability, limiting global scalability. USA approvals for food animals only progressed post-2021, with other regions lagging behind.
  • State-level approvals in the USA allowed only non-food animal use until recent years (Feed & Grain)
  • Inconsistent residue standards across Asia, EU, and Latin America delayed feed registration by 8--12 months
  • Less than 25% of biomass processors currently comply with ISO-grade feed safety protocols for export viability

Top Countries Cultivating, Processing, and Scaling Hemp-Based Animal Feed Demand

Country Wise Analysis Of Hemp Animal Feed Market

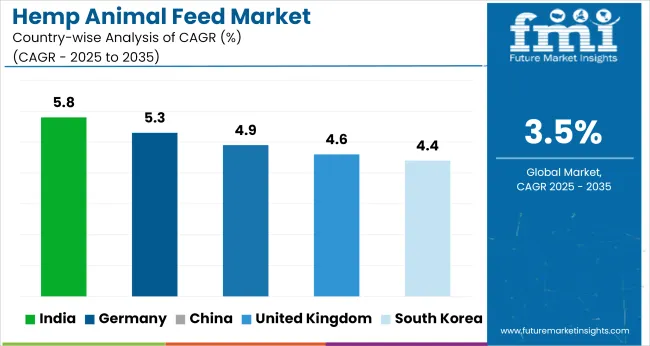
Countries CAGR (2025 to 2035)
India 5.8%
Germany 5.3%
China 4.9%
United Kingdom 4.6%
South Korea 4.4%

The global hemp animal feed market is projected to grow at a 3.5% CAGR from 2025 to 2035. The report covers detailed analysis of 40+ countries, with the top five shared as a reference. India, a BRICS member, leads with 5.8% growth, driven by expanded hemp seed cake processing and regulatory easing in livestock feed trials.

Germany and the United Kingdom, both OECD countries, follow at 5.3% and 4.6% respectively, supported by traceability-led formulations and regional protein substitution goals. China, also part of BRICS, records 4.9% as feed-grade hemp fiber is scaled in aquaculture applications.

South Korea posts 4.4%, with controlled THC-certified hemp biomass gaining traction in pet and poultry diets. All five countries exceed the global average, signaling accelerated adoption across both emerging and developed economies.

In-depth Analysis of Hemp Animal Feed Market in India

The hemp animal feed market in India is projected to expand at a CAGR of 5.8% between 2025 and 2035. Between 2020 and 2024, hemp-based nutrition remained largely absent from commercial feed due to legal ambiguity and low-volume production. After hemp cultivation frameworks were introduced in Uttarakhand and Himachal Pradesh, the sector opened to structured pilot programs.

From 2025, dairy cooperatives and feed mills began adopting hempseed meal and fiber for cattle and poultry rations. Performance benefits such as improved protein absorption and omega-3 content led to trial-based expansion. Feed integration gained further ground with new licensing formats supporting controlled processing. Nutritional validation reports have accelerated procurement from regulated hemp growers.

  • 64% of hemp feed uptake linked to dairy sector by 2028
  • Over 30 licensed hemp processors engaged in feed contracts by 2030
  • Pilot trials showed 1.7× improvement in protein digestibility in cattle

Opportunity Analysis of Hemp Animal Feed Market in Germany

The hemp animal feed market in Germany is projected to expand at a CAGR of 5.3% between 2025 and 2035. From 2020 to 2024, adoption was restricted to boutique organic farms and pet nutrition brands experimenting with hemp protein for gut and joint health. After regulatory approvals in 2025 expanded permissible hemp feed derivatives, feed manufacturers began large-scale formulation trials.

Use of dehulled hempseed cake gained popularity in monogastric livestock, supported by favorable EU digestibility metrics. Strategic partnerships formed between hemp cooperatives and compound feed producers enabled steady raw material access. Germany’s emphasis on feed traceability and clean-label inputs pushed demand for certified hemp inclusion.

  • Hempseed cake featured in 49% of organic swine feed trials by 2027
  • 22 EU-compliant hemp cultivars certified for animal nutrition by 2028
  • Pet feed brands launched 18 hemp-based SKUs from 2025 to 2029

Sales Analysis of Hemp Animal Feed in China

Demand for hemp animal feed in China is forecast to expand at a CAGR of 4.9% through 2035. From 2020 to 2024, market development was slow due to fragmented policy and minimal local processing. Between 2025 and 2035, provinces such as Heilongjiang and Yunnan have been approved for industrial hemp use in livestock rations.

Feed firms began integrating hempseed protein in aquaculture and poultry applications after functional data validated omega fatty acid profiles and amino acid content. Collaboration between domestic agritech firms and veterinary nutrition labs has enabled hemp-based formulations in antibiotic-reduced diets. Government endorsements and feed safety certifications have accelerated domestic product clearance.

  • Hemp-based aquafeed reached 21% of total volume in Yunnan by 2029
  • Over 50 functional hemp-based feed SKUs launched by 2030
  • Poultry feed trials recorded 2.1× gain in amino acid uptake post-2026

Demand Outlook for Hemp Animal Feed in the United Kingdom

Sales of hemp animal feed in the United Kingdom are projected to witness a CAGR of 4.6% through 2035. Between 2020 and 2024, usage remained marginal, tied to artisanal sheep farms and natural pet food labels. After 2025, demand shifted as feed suppliers began replacing soy and flax inputs with hemp protein meal in ruminant and poultry mixes.

Regulatory adjustments facilitated local cultivation in Scotland and Wales, enhancing traceable raw material pipelines. Product claims focused on digestibility and fiber content gained traction in supermarket-aligned meat and dairy supply chains. Branded feed offerings targeting gut health and feed efficiency helped scale volumes within cooperatives and retail-aligned producers.

  • Hemp replaced soy in 36% of feed reformulations by 2028
  • UK-based processors added 27 new hemp blends to feed lines by 2030
  • Scotland and Wales contributed 58% of domestic hemp feedstock in 2029

Market Analysis of Hemp Animal Feed in South Korea

Demand for hemp animal feed in South Korea is forecast to expand at a CAGR of 4.4% through 2035. From 2020 to 2024, legal prohibitions and supply limitations kept hemp-based ingredients out of commercial feed. Post-2025, with government pilot schemes in Jeju and North Chungcheong, licensed processors began supplying hemp hulls and seedcake to native cattle and poultry feed trials.

Inclusion was driven by growing interest in high-fiber and antioxidant-rich ingredients within functional livestock nutrition. Smart farms using precision feed systems helped validate performance metrics in growth and immunity outcomes.
  • Hempseed meal used in 39% of premium poultry blends by 2029
  • Over 15 functional livestock trials conducted under government supervision
  • Jeju province accounted for 41% of national hemp feed output by 2030

Competitive Landscape in the Hemp Animal Feed Market

Hemp Animal Feed Market Analysis By Company

The hemp animal feed market is structured around vertically integrated producers, consortium-led advocacy, and a few multinational-backed processors. The Hemp Feed Coalition operates as both a regulatory body and an industry alliance, driving legal approvals, feed safety standards, and inter-supplier collaboration across North America and Europe.

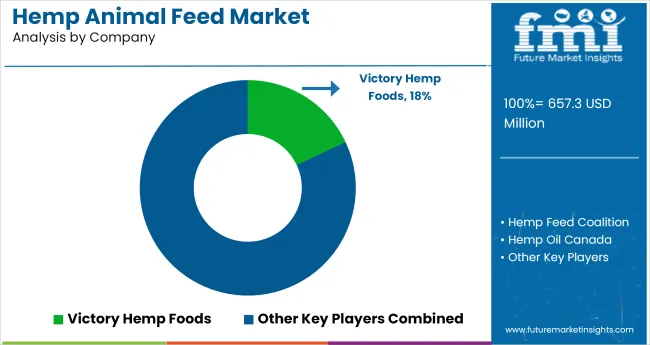
Victory Hemp Foods (USA) leads in hemp protein concentrate formulations for ruminant and poultry feed, leveraging domestic processing capacity and supply agreements. Hemp Oil Canada, under Unilever’s Fresh Hemp Foods Ltd., focuses on compliant hempseed cake and oil for feed blends, with distribution linked to legacy natural food networks.

Blue Sky Hemp Ventures (Canada) combines whole-plant utilization with carbon-focused traceability models in cattle and poultry segments. Z-Company (Netherlands) supplies organic-certified hemp feed ingredients across the EU, often through private-label and bulk foodservice contracts.

Leading Company - Victory Hemp FoodsMarket Share - 18%

Recent Industry News

  • In August 2024, the Association of American Feed Control Officials (AAFCO) approved hemp seed meal for use in laying-hen feed, allowing up to 20% inclusion with limits of ≤2 ppm THC and ≤20 ppm CBD. The approval followed sustained advocacy by the Hemp Feed Coalition and marked a major regulatory milestone for hemp-based animal feed in the United States. (Source: AgWeb, August 7, 2024)
  • In January 2025, Kansas State University released a study indicating that hemp leaves and seed byproducts achieved approximately 93% nutrient digestibility in cattle feed trials. The findings support the case for regulatory approval and commercial use of hemp-based ingredients in ruminant feed systems. (Source: Kansas State University, January 22, 2025)

Leading Companies in Hemp Animal Feed Market

  • Hemp Feed Coalition
  • Victory Hemp Foods
  • Hemp Oil Canada (Fresh Hemp Foods Ltd.)
  • Blue Sky Hemp Ventures
  • Z-Company

Report Scope and Key Coverage

Report Attributes Details
Market Size (2025) USD 657.3 million
Projected Market Size (2035) USD 927.2 million
CAGR (2025 to 2035) 3.5%
Base Year for Estimation 2024
Historical Period 2020 to 2024
Projections Period 2025 to 2035
Quantitative Units USD million for value and thousand metric tons for volume
Product Types Analyzed (Segment 1) Hemp Seed Meal, Hemp Seed Cake, Hemp Seed Oil, Hemp Hulls, Whole Hemp Seeds
Livestock Types Analyzed (Segment 2) Ruminants (Cattle, Sheep, Goats), Poultry (Broilers, Layers, Turkeys), Swine, Equine, Aquaculture, Pets
Applications Analyzed (Segment 3) Protein Enrichment, Omega-3/Omega-6 Supplementation, Fiber Supplementation, Anti-inflammatory Support, Gut Health, Skin & Coat Health (Pets)
Forms Analyzed (Segment 4) Pellets, Meal/Powder, Crumbles, Oil, Blended Mixes (with other feed ingredients)
Sales Channels Analyzed (Segment 5) Direct to Farm, Animal Feed Distributors, Online B2B, Retail (Pet Stores, Specialty Feed Shops)
Certifications/Claims Analyzed (Segment 6) Non-GMO, Organic, Sustainable Sourcing, THC-Free (<0.3%), Cold-Pressed (for oils)
End Uses Analyzed (Segment 7) Commercial Livestock Farms, Pet Food Manufacturers, Equine Nutrition, Aquafeed Producers, Specialty Animal Feed Brands
Regions Covered North America, Latin America, Europe, East Asia, South Asia & Pacific, Middle East & Africa
Countries Covered United States, Canada, Germany, United Kingdom, France, Italy, Spain, China, India, Japan, South Korea, Australia, Brazil, Mexico, Argentina, Saudi Arabia, UAE, South Africa
Key Players Hemp Feed Coalition, Victory Hemp Foods, Hemp Oil Canada (Fresh Hemp Foods Ltd.), Blue Sky Hemp Ventures, Z-Company
Additional Attributes Dollar sales, share by product type and livestock segment, adoption of hemp meal and oil in equine and pet nutrition, non-GMO and THC-free compliance influencing buyer preference, growth in blended hemp feed mixes for aquaculture and ruminants

Key Segments

By Product Type:

This includes Hemp Seed Meal, Hemp Seed Cake, Hemp Seed Oil, Hemp Hulls, and Whole Hemp Seeds.

By Livestock Type:

The segment covers Ruminants (Cattle, Sheep, Goats), Poultry (Broilers, Layers, Turkeys), Swine, Equine, Aquaculture, and Pets.

By Application:

This segment includes Protein Enrichment, Omega-3/Omega-6 Supplementation, Fiber Supplementation, Anti-inflammatory Support, Gut Health, and Skin & Coat Health (Pets).

By Form:

The segment is categorized into Pellets, Meal/Powder, Crumbles, Oil, and Blended Mixes (with other feed ingredients).

By Sales Channel:

The industry is segmented into Direct to Farm, Animal Feed Distributors, Online B2B, and Retail (Pet Stores, Specialty Feed Shops).

By Certification/Claim:

This includes Non-GMO, Organic, Sustainable Sourcing, THC-Free (<0.3%), and Cold-Pressed (for oils).

By End Use:

This segment covers Commercial Livestock Farms, Pet Food Manufacturers, Equine Nutrition, Aquafeed Producers, and Specialty Animal Feed Brands.

Table of Content

  1. Executive Summary
    • Global Market Outlook
    • Demand-side Trends
    • Supply-side Trends
    • Technology Roadmap Analysis
    • Analysis and Recommendations
  2. Market Overview
    • Market Coverage / Taxonomy
    • Market Definition / Scope / Limitations
  3. Market Background
    • Market Dynamics
      • Drivers
      • Restraints
      • Opportunity
      • Trends
    • Scenario Forecast
      • Demand in Optimistic Scenario
      • Demand in Likely Scenario
      • Demand in Conservative Scenario
    • Opportunity Map Analysis
    • Product Life Cycle Analysis
    • Supply Chain Analysis
      • Supply Side Participants and their Roles
        • Producers
        • Mid-Level Participants (Traders/ Agents/ Brokers)
        • Wholesalers and Distributors
      • Value Added and Value Created at Node in the Supply Chain
      • List of Raw Material Suppliers
      • List of Existing and Potential Buyer’s
    • Investment Feasibility Matrix
    • Value Chain Analysis
      • Profit Margin Analysis
      • Wholesalers and Distributors
      • Retailers
    • PESTLE and Porter’s Analysis
    • Regulatory Landscape
      • By Key Regions
      • By Key Countries
    • Regional Parent Market Outlook
    • Production and Consumption Statistics
    • Import and Export Statistics
  4. Global Market Analysis 2020 to 2024 and Forecast, 2025 to 2035
    • Historical Market Size Value (USD Million) & Volume (Thousand MT) Analysis, 2020 to 2024
    • Current and Future Market Size Value (USD Million) & Volume (Thousand MT) Projections, 2025 to 2035
      • Y-o-Y Growth Trend Analysis
      • Absolute $ Opportunity Analysis
  5. Global Market Pricing Analysis 2020 to 2024 and Forecast 2025 to 2035
  6. Global Market Analysis 2020 to 2024 and Forecast 2025 to 2035, By Product Type
    • Introduction / Key Findings
    • Historical Market Size Value (USD Million) & Volume (Thousand MT) Analysis By Product Type, 2020 to 2024
    • Current and Future Market Size Value (USD Million) & Volume (Thousand MT) Analysis and Forecast By Product Type, 2025 to 2035
      • Hemp Seed Meal
      • Hemp Seed Cake
      • Hemp Seed Oil
      • Hemp Hulls
      • Whole Hemp Seeds
    • Y-o-Y Growth Trend Analysis By Product Type, 2020 to 2024
    • Absolute $ Opportunity Analysis By Product Type, 2025 to 2035
  7. Global Market  Analysis 2020 to 2024 and Forecast 2025 to 2035, By Livestock Type
    • Introduction / Key Findings
    • Historical Market Size Value (USD Million) & Volume (Thousand MT) Analysis By Livestock Type, 2020 to 2024
    • Current and Future Market Size Value (USD Million) & Volume (Thousand MT) Analysis and Forecast By Livestock Type, 2025 to 2035
      • Ruminants (Cattle, Sheep, Goats)
      • Poultry (Broilers, Layers, Turkeys)
      • Swine
      • Equine
      • Aquaculture
      • Pets
    • Y-o-Y Growth Trend Analysis By Livestock Type, 2020 to 2024
    • Absolute $ Opportunity Analysis By Livestock Type, 2025 to 2035
  8. Global Market Analysis 2020 to 2024 and Forecast 2025 to 2035, By Application
    • Introduction / Key Findings
    • Historical Market Size Value (USD Million) & Volume (Thousand MT) Analysis By Application, 2020 to 2024
    • Current and Future Market Size Value (USD Million) & Volume (Thousand MT) Analysis and Forecast By Application, 2025 to 2035
      • Protein Enrichment
      • Omega-3/Omega-6 Supplementation
      • Fiber Supplementation
      • Anti-inflammatory Support
      • Gut Health
      • Skin & Coat Health (Pets)
    • Y-o-Y Growth Trend Analysis By Application, 2020 to 2024
    • Absolute $ Opportunity Analysis By Application, 2025 to 2035
  9. Global Market Analysis 2020 to 2024 and Forecast 2025 to 2035, By Form
    • Introduction / Key Findings
    • Historical Market Size Value (USD Million) & Volume (Thousand MT) Analysis By Form, 2020 to 2024
    • Current and Future Market Size Value (USD Million) & Volume (Thousand MT) Analysis and Forecast By Form, 2025 to 2035
      • Pellets
      • Meal/Powder
      • Crumbles
      • Oil
      • Blended Mixes (with other feed ingredients)
    • Y-o-Y Growth Trend Analysis By Form, 2020 to 2024
    • Absolute $ Opportunity Analysis By Form, 2025 to 2035
  10. Global Market Analysis 2020 to 2024 and Forecast 2025 to 2035, By Sales Channel
    • Introduction / Key Findings
    • Historical Market Size Value (USD Million) & Volume (Thousand MT) Analysis By Sales Channel, 2020 to 2024
    • Current and Future Market Size Value (USD Million) & Volume (Thousand MT) Analysis and Forecast By Sales Channel, 2025 to 2035
      • Direct to Farm
      • Animal Feed Distributors
      • Online B2B
      • Retail (Pet Stores, Specialty Feed Shops)
    • Y-o-Y Growth Trend Analysis By Sales Channel, 2020 to 2024
    • Absolute $ Opportunity Analysis By Sales Channel, 2025 to 2035
  11. Global Market Analysis 2020 to 2024 and Forecast 2025 to 2035, By Certification/Claim
    • Introduction / Key Findings
    • Historical Market Size Value (USD Million) & Volume (Thousand MT) Analysis By Certification/Claim, 2020 to 2024
    • Current and Future Market Size Value (USD Million) & Volume (Thousand MT) Analysis and Forecast By Certification/Claim, 2025 to 2035
      • Non-GMO
      • Organic
      • Sustainable Sourcing
      • THC-Free (<0.3%)
      • Cold-Pressed (for oils)
    • Y-o-Y Growth Trend Analysis By Certification/Claim, 2020 to 2024
    • Absolute $ Opportunity Analysis By Certification/Claim, 2025 to 2035
  12. Global Market Analysis 2020 to 2024 and Forecast 2025 to 2035, By End Use
    • Introduction / Key Findings
    • Historical Market Size Value (USD Million) & Volume (Thousand MT) Analysis By End Use, 2020 to 2024
    • Current and Future Market Size Value (USD Million) & Volume (Thousand MT) Analysis and Forecast By End Use, 2025 to 2035
      • Commercial Livestock Farms
      • Pet Food Manufacturers
      • Equine Nutrition
      • Aquafeed Producers
      • Specialty Animal Feed Brands
    • Y-o-Y Growth Trend Analysis By End Use, 2020 to 2024
    • Absolute $ Opportunity Analysis By End Use, 2025 to 2035
  13. Global Market Analysis 2020 to 2024 and Forecast 2025 to 2035, By Region
    • Introduction
    • Historical Market Size Value (USD Million) & Volume (Thousand MT) Analysis By Region, 2020 to 2024
    • Current Market Size Value (USD Million) & Volume (Thousand MT) Analysis and Forecast By Region, 2025 to 2035
      • North America
      • Latin America
      • Western Europe
      • Eastern Europe
      • East Asia
      • South Asia & Pacific
      • Middle East and Africa
    • Market Attractiveness Analysis By Region
  14. North America Market Analysis 2020 to 2024 and Forecast 2025 to 2035, By Country
    • Historical Market Size Value (USD Million) & Volume (Thousand MT) Trend Analysis By Market Taxonomy, 2020 to 2024
    • Market Size Value (USD Million) & Volume (Thousand MT) Forecast By Market Taxonomy, 2025 to 2035
      • By Country
        • USA
        • Canada
        • Mexico
      • By Product Type
      • By Livestock Type
      • By Application
      • By Form
      • By Sales Channel
      • By Certification/Claim
      • By End Use
    • Market Attractiveness Analysis
      • By Country
      • By Product Type
      • By Livestock Type
      • By Application
      • By Form
      • By Sales Channel
      • By Certification/Claim
      • By End Use
    • Key Takeaways
  15. Latin America Market Analysis 2020 to 2024 and Forecast 2025 to 2035, By Country
    • Historical Market Size Value (USD Million) & Volume (Thousand MT) Trend Analysis By Market Taxonomy, 2020 to 2024
    • Market Size Value (USD Million) & Volume (Thousand MT) Forecast By Market Taxonomy, 2025 to 2035
      • By Country
        • Brazil
        • Argentina
        • Rest of LATAM
      • By Product Type
      • By Livestock Type
      • By Application
      • By Form
      • By Sales Channel
      • By Certification/Claim
      • By End Use
    • Market Attractiveness Analysis
      • By Country
      • By Product Type
      • By Livestock Type
      • By Application
      • By Form
      • By Sales Channel
      • By Certification/Claim
      • By End Use
    • Key Takeaways
  16. Western Europe Market Analysis 2020 to 2024 and Forecast 2025 to 2035, By Country
    • Historical Market Size Value (USD Million) & Volume (Thousand MT) Trend Analysis By Market Taxonomy, 2020 to 2024
    • Market Size Value (USD Million) & Volume (Thousand MT) Forecast By Market Taxonomy, 2025 to 2035
      • By Country
        • Germany
        • Italy
        • France
        • UK
        • Spain
        • BENELUX
        • Nordic
        • Rest of W.Europe
      • By Product Type
      • By Livestock Type
      • By Application
      • By Form
      • By Sales Channel
      • By Certification/Claim
      • By End Use
    • Market Attractiveness Analysis
      • By Country
      • By Product Type
      • By Livestock Type
      • By Application
      • By Form
      • By Sales Channel
      • By Certification/Claim
      • By End Use
    • Key Takeaways
  17. Eastern Europe Market Analysis 2020 to 2024 and Forecast 2025 to 2035, By Country
    • Historical Market Size Value (USD Million) & Volume (Thousand MT) Trend Analysis By Market Taxonomy, 2020 to 2024
    • Market Size Value (USD Million) & Volume (Thousand MT) Forecast By Market Taxonomy, 2025 to 2035
      • By Country
        • Russia
        • Hungary
        • Poland
        • Balkan & Baltics
        • Rest of E. Europe
      • By Product Type
      • By Livestock Type
      • By Application
      • By Form
      • By Sales Channel
      • By Certification/Claim
      • By End Use
    • Market Attractiveness Analysis
      • By Country
      • By Product Type
      • By Livestock Type
      • By Application
      • By Form
      • By Sales Channel
      • By Certification/Claim
      • By End Use
    • Key Takeaways
  18. East Asia Market Analysis 2020 to 2024 and Forecast 2025 to 2035, By Country
    • Historical Market Size Value (USD Million) & Volume (Thousand MT) Trend Analysis By Market Taxonomy, 2020 to 2024
    • Market Size Value (USD Million) & Volume (Thousand MT) Forecast By Market Taxonomy, 2025 to 2035
      • By Country
        • China
        • Japan
        • South Korea
      • By Product Type
      • By Livestock Type
      • By Application
      • By Form
      • By Sales Channel
      • By Certification/Claim
      • By End Use
    • Market Attractiveness Analysis
      • By Country
      • By Product Type
      • By Livestock Type
      • By Application
      • By Form
      • By Sales Channel
      • By Certification/Claim
      • By End Use
    • Key Takeaways
  19. South Asia & Pacific Market Analysis 2020 to 2024 and Forecast 2025 to 2035, By Country
    • Historical Market Size Value (USD Million) & Volume (Thousand MT) Trend Analysis By Market Taxonomy, 2020 to 2024
    • Market Size Value (USD Million) & Volume (Thousand MT) Forecast By Market Taxonomy, 2025 to 2035
      • By Country
        • India
        • Australia & New Zealand
        • ASEAN
        • Rest of SAP
      • By Product Type
      • By Livestock Type
      • By Application
      • By Form
      • By Sales Channel
      • By Certification/Claim
      • By End Use
    • Market Attractiveness Analysis
      • By Country
      • By Product Type
      • By Livestock Type
      • By Application
      • By Form
      • By Sales Channel
      • By Certification/Claim
      • By End Use
    • Key Takeaways
  20. Middle East and Africa Market Analysis 2020 to 2024 and Forecast 2025 to 2035, By Country
    • Historical Market Size Value (USD Million) & Volume (Thousand MT) Trend Analysis By Market Taxonomy, 2020 to 2024
    • Market Size Value (USD Million) & Volume (Thousand MT) Forecast by Market Taxonomy, 2025 to 2035
      • By Country
        • GCC Countries
        • Northern Africa
        • South Africa
        • Turkiye
        • Rest of MEA
      • By Product Type
      • By Livestock Type
      • By Application
      • By Form
      • By Sales Channel
      • By Certification/Claim
      • By End Use
    • Market Attractiveness Analysis
      • By Country
      • By Product Type
      • By Livestock Type
      • By Application
      • By Form
      • By Sales Channel
      • By Certification/Claim
      • By End Use
    • Key Takeaways
  21. Key Countries Market Analysis
    • U.SA
      • Pricing Analysis
      • Market Share Analysis, 2024
        • By Product Type
        • By Livestock Type
        • By Application
        • By Form
        • By Sales Channel
        • By Certification/Claim
        • By End Use
    • Canada
      • Pricing Analysis
      • Market Share Analysis, 2024
        • By Product Type
        • By Livestock Type
        • By Application
        • By Form
        • By Sales Channel
        • By Certification/Claim
        • By End Use
    • Brazil
      • Pricing Analysis
      • Market Share Analysis, 2024
        • By Product Type
        • By Livestock Type
        • By Application
        • By Form
        • By Sales Channel
        • By Certification/Claim
        • By End Use
    • Mexico
      • Pricing Analysis
      • Market Share Analysis, 2024
        • By Product Type
        • By Livestock Type
        • By Application
        • By Form
        • By Sales Channel
        • By Certification/Claim
        • By End Use
    • Argentina
      • Pricing Analysis
      • Market Share Analysis, 2024
        • By Product Type
        • By Livestock Type
        • By Application
        • By Form
        • By Sales Channel
        • By Certification/Claim
        • By End Use
  22. Market Structure Analysis
    • Competition Dashboard
    • Competition Benchmarking
    • Market Share Analysis of Top Players
      • By Regional
      • By Product Type
      • By Livestock Type
      • By Application
      • By Form
      • By Sales Channel
      • By Certification/Claim
      • By End Use
  23. Competition Analysis
    • Competition Deep Dive
      • Hemp Feed Coalition
        • Overview
        • Product Portfolio
        • Profitability by Market Segments (Product/Age /Sales Channel/Region)
        • Sales Footprint
        • Strategy Overview
          • Marketing Strategy
          • Product Strategy
          • Channel Strategy
      • Victory Hemp Foods
        • Overview
        • Product Portfolio
        • Profitability by Market Segments (Product/Age /Sales Channel/Region)
        • Sales Footprint
        • Strategy Overview
          • Marketing Strategy
          • Product Strategy
          • Channel Strategy
      • Hemp Oil Canada (Fresh Hemp Foods Ltd.)
        • Overview
        • Product Portfolio
        • Profitability by Market Segments (Product/Age /Sales Channel/Region)
        • Sales Footprint
        • Strategy Overview
          • Marketing Strategy
          • Product Strategy
          • Channel Strategy
      • Blue Sky Hemp Ventures
        • Overview
        • Product Portfolio
        • Profitability by Market Segments (Product/Age /Sales Channel/Region)
        • Sales Footprint
        • Strategy Overview
          • Marketing Strategy
          • Product Strategy
          • Channel Strategy
      • Z-Company
        • Overview
        • Product Portfolio
        • Profitability by Market Segments (Product/Age /Sales Channel/Region)
        • Sales Footprint
        • Strategy Overview
          • Marketing Strategy
          • Product Strategy
          • Channel Strategy
  24. Assumptions & Acronyms Used
  25. Research Methodology

List of Tables

  • Table 1: Global Market Value (USD Million) Forecast by Region, 2020-2035
  • Table 2: Global Market Volume (Thousand MT) Forecast by Region, 2020-2035
  • Table 3: Global Market Value (USD Million) Forecast by Product Type, 2020-2035
  • Table 4: Global Market Volume (Thousand MT) Forecast by Product Type, 2020-2035
  • Table 5: Global Market Value (USD Million) Forecast by Livestock Type, 2020-2035
  • Table 6: Global Market Volume (Thousand MT) Forecast by Livestock Type, 2020-2035
  • Table 7: Global Market Value (USD Million) Forecast by Application, 2020-2035
  • Table 8: Global Market Volume (Thousand MT) Forecast by Application, 2020-2035
  • Table 9: Global Market Value (USD Million) Forecast by Form, 2020-2035
  • Table 10: Global Market Volume (Thousand MT) Forecast by Form, 2020-2035
  • Table 11: Global Market Value (USD Million) Forecast by Sales Channel, 2020-2035
  • Table 12: Global Market Volume (Thousand MT) Forecast by Sales Channel, 2020-2035
  • Table 13: Global Market Value (USD Million) Forecast by Certification/Claim, 2020-2035
  • Table 14: Global Market Volume (Thousand MT) Forecast by Certification/Claim, 2020-2035
  • Table 15: Global Market Value (USD Million) Forecast by End Use, 2020-2035
  • Table 16: Global Market Volume (Thousand MT) Forecast by End Use, 2020-2035
  • Table 17: North America Market Value (USD Million) Forecast by Country, 2020-2035
  • Table 18: North America Market Volume (Thousand MT) Forecast by Country, 2020-2035
  • Table 19: North America Market Value (USD Million) Forecast by Product Type, 2020-2035
  • Table 20: North America Market Volume (Thousand MT) Forecast by Product Type, 2020-2035
  • Table 21: North America Market Value (USD Million) Forecast by Livestock Type, 2020-2035
  • Table 22: North America Market Volume (Thousand MT) Forecast by Livestock Type, 2020-2035
  • Table 23: North America Market Value (USD Million) Forecast by Application, 2020-2035
  • Table 24: North America Market Volume (Thousand MT) Forecast by Application, 2020-2035
  • Table 25: North America Market Value (USD Million) Forecast by Form, 2020-2035
  • Table 26: North America Market Volume (Thousand MT) Forecast by Form, 2020-2035
  • Table 27: North America Market Value (USD Million) Forecast by Sales Channel, 2020-2035
  • Table 28: North America Market Volume (Thousand MT) Forecast by Sales Channel, 2020-2035
  • Table 29: North America Market Value (USD Million) Forecast by Certification/Claim, 2020-2035
  • Table 30: North America Market Volume (Thousand MT) Forecast by Certification/Claim, 2020-2035
  • Table 31: North America Market Value (USD Million) Forecast by End Use, 2020-2035
  • Table 32: North America Market Volume (Thousand MT) Forecast by End Use, 2020-2035
  • Table 33: Latin America Market Value (USD Million) Forecast by Country, 2020-2035
  • Table 34: Latin America Market Volume (Thousand MT) Forecast by Country, 2020-2035
  • Table 35: Latin America Market Value (USD Million) Forecast by Product Type, 2020-2035
  • Table 36: Latin America Market Volume (Thousand MT) Forecast by Product Type, 2020-2035
  • Table 37: Latin America Market Value (USD Million) Forecast by Livestock Type, 2020-2035
  • Table 38: Latin America Market Volume (Thousand MT) Forecast by Livestock Type, 2020-2035
  • Table 39: Latin America Market Value (USD Million) Forecast by Application, 2020-2035
  • Table 40: Latin America Market Volume (Thousand MT) Forecast by Application, 2020-2035
  • Table 41: Latin America Market Value (USD Million) Forecast by Form, 2020-2035
  • Table 42: Latin America Market Volume (Thousand MT) Forecast by Form, 2020-2035
  • Table 43: Latin America Market Value (USD Million) Forecast by Sales Channel, 2020-2035
  • Table 44: Latin America Market Volume (Thousand MT) Forecast by Sales Channel, 2020-2035
  • Table 45: Latin America Market Value (USD Million) Forecast by Certification/Claim, 2020-2035
  • Table 46: Latin America Market Volume (Thousand MT) Forecast by Certification/Claim, 2020-2035
  • Table 47: Latin America Market Value (USD Million) Forecast by End Use, 2020-2035
  • Table 48: Latin America Market Volume (Thousand MT) Forecast by End Use, 2020-2035
  • Table 49: Western Europe Market Value (USD Million) Forecast by Country, 2020-2035
  • Table 50: Western Europe Market Volume (Thousand MT) Forecast by Country, 2020-2035
  • Table 51: Western Europe Market Value (USD Million) Forecast by Product Type, 2020-2035
  • Table 52: Western Europe Market Volume (Thousand MT) Forecast by Product Type, 2020-2035
  • Table 53: Western Europe Market Value (USD Million) Forecast by Livestock Type, 2020-2035
  • Table 54: Western Europe Market Volume (Thousand MT) Forecast by Livestock Type, 2020-2035
  • Table 55: Western Europe Market Value (USD Million) Forecast by Application, 2020-2035
  • Table 56: Western Europe Market Volume (Thousand MT) Forecast by Application, 2020-2035
  • Table 57: Western Europe Market Value (USD Million) Forecast by Form, 2020-2035
  • Table 58: Western Europe Market Volume (Thousand MT) Forecast by Form, 2020-2035
  • Table 59: Western Europe Market Value (USD Million) Forecast by Sales Channel, 2020-2035
  • Table 60: Western Europe Market Volume (Thousand MT) Forecast by Sales Channel, 2020-2035
  • Table 61: Western Europe Market Value (USD Million) Forecast by Certification/Claim, 2020-2035
  • Table 62: Western Europe Market Volume (Thousand MT) Forecast by Certification/Claim, 2020-2035
  • Table 63: Western Europe Market Value (USD Million) Forecast by End Use, 2020-2035
  • Table 64: Western Europe Market Volume (Thousand MT) Forecast by End Use, 2020-2035
  • Table 65: Eastern Europe Market Value (USD Million) Forecast by Country, 2020-2035
  • Table 66: Eastern Europe Market Volume (Thousand MT) Forecast by Country, 2020-2035
  • Table 67: Eastern Europe Market Value (USD Million) Forecast by Product Type, 2020-2035
  • Table 68: Eastern Europe Market Volume (Thousand MT) Forecast by Product Type, 2020-2035
  • Table 69: Eastern Europe Market Value (USD Million) Forecast by Livestock Type, 2020-2035
  • Table 70: Eastern Europe Market Volume (Thousand MT) Forecast by Livestock Type, 2020-2035
  • Table 71: Eastern Europe Market Value (USD Million) Forecast by Application, 2020-2035
  • Table 72: Eastern Europe Market Volume (Thousand MT) Forecast by Application, 2020-2035
  • Table 73: Eastern Europe Market Value (USD Million) Forecast by Form, 2020-2035
  • Table 74: Eastern Europe Market Volume (Thousand MT) Forecast by Form, 2020-2035
  • Table 75: Eastern Europe Market Value (USD Million) Forecast by Sales Channel, 2020-2035
  • Table 76: Eastern Europe Market Volume (Thousand MT) Forecast by Sales Channel, 2020-2035
  • Table 77: Eastern Europe Market Value (USD Million) Forecast by Certification/Claim, 2020-2035
  • Table 78: Eastern Europe Market Volume (Thousand MT) Forecast by Certification/Claim, 2020-2035
  • Table 79: Eastern Europe Market Value (USD Million) Forecast by End Use, 2020-2035
  • Table 80: Eastern Europe Market Volume (Thousand MT) Forecast by End Use, 2020-2035
  • Table 81: East Asia Market Value (USD Million) Forecast by Country, 2020-2035
  • Table 82: East Asia Market Volume (Thousand MT) Forecast by Country, 2020-2035
  • Table 83: East Asia Market Value (USD Million) Forecast by Product Type, 2020-2035
  • Table 84: East Asia Market Volume (Thousand MT) Forecast by Product Type, 2020-2035
  • Table 85: East Asia Market Value (USD Million) Forecast by Livestock Type, 2020-2035
  • Table 86: East Asia Market Volume (Thousand MT) Forecast by Livestock Type, 2020-2035
  • Table 87: East Asia Market Value (USD Million) Forecast by Application, 2020-2035
  • Table 88: East Asia Market Volume (Thousand MT) Forecast by Application, 2020-2035
  • Table 89: East Asia Market Value (USD Million) Forecast by Form, 2020-2035
  • Table 90: East Asia Market Volume (Thousand MT) Forecast by Form, 2020-2035
  • Table 91: East Asia Market Value (USD Million) Forecast by Sales Channel, 2020-2035
  • Table 92: East Asia Market Volume (Thousand MT) Forecast by Sales Channel, 2020-2035
  • Table 93: East Asia Market Value (USD Million) Forecast by Certification/Claim, 2020-2035
  • Table 94: East Asia Market Volume (Thousand MT) Forecast by Certification/Claim, 2020-2035
  • Table 95: East Asia Market Value (USD Million) Forecast by End Use, 2020-2035
  • Table 96: East Asia Market Volume (Thousand MT) Forecast by End Use, 2020-2035
  • Table 97: South Asia & Pacific Market Value (USD Million) Forecast by Country, 2020-2035
  • Table 98: South Asia & Pacific Market Volume (Thousand MT) Forecast by Country, 2020-2035
  • Table 99: South Asia & Pacific Market Value (USD Million) Forecast by Product Type, 2020-2035
  • Table 100: South Asia & Pacific Market Volume (Thousand MT) Forecast by Product Type, 2020-2035
  • Table 101: South Asia & Pacific Market Value (USD Million) Forecast by Livestock Type, 2020-2035
  • Table 102: South Asia & Pacific Market Volume (Thousand MT) Forecast by Livestock Type, 2020-2035
  • Table 103: South Asia & Pacific Market Value (USD Million) Forecast by Application, 2020-2035
  • Table 104: South Asia & Pacific Market Volume (Thousand MT) Forecast by Application, 2020-2035
  • Table 105: South Asia & Pacific Market Value (USD Million) Forecast by Form, 2020-2035
  • Table 106: South Asia & Pacific Market Volume (Thousand MT) Forecast by Form, 2020-2035
  • Table 107: South Asia & Pacific Market Value (USD Million) Forecast by Sales Channel, 2020-2035
  • Table 108: South Asia & Pacific Market Volume (Thousand MT) Forecast by Sales Channel, 2020-2035
  • Table 109: South Asia & Pacific Market Value (USD Million) Forecast by Certification/Claim, 2020-2035
  • Table 110: South Asia & Pacific Market Volume (Thousand MT) Forecast by Certification/Claim, 2020-2035
  • Table 111: South Asia & Pacific Market Value (USD Million) Forecast by End Use, 2020-2035
  • Table 112: South Asia & Pacific Market Volume (Thousand MT) Forecast by End Use, 2020-2035
  • Table 113: Middle East and Africa Market Value (USD Million) Forecast by Country, 2020-2035
  • Table 114: Middle East and Africa Market Volume (Thousand MT) Forecast by Country, 2020-2035
  • Table 115: Middle East and Africa Market Value (USD Million) Forecast by Product Type, 2020-2035
  • Table 116: Middle East and Africa Market Volume (Thousand MT) Forecast by Product Type, 2020-2035
  • Table 117: Middle East and Africa Market Value (USD Million) Forecast by Livestock Type, 2020-2035
  • Table 118: Middle East and Africa Market Volume (Thousand MT) Forecast by Livestock Type, 2020-2035
  • Table 119: Middle East and Africa Market Value (USD Million) Forecast by Application, 2020-2035
  • Table 120: Middle East and Africa Market Volume (Thousand MT) Forecast by Application, 2020-2035
  • Table 121: Middle East and Africa Market Value (USD Million) Forecast by Form, 2020-2035
  • Table 122: Middle East and Africa Market Volume (Thousand MT) Forecast by Form, 2020-2035
  • Table 123: Middle East and Africa Market Value (USD Million) Forecast by Sales Channel, 2020-2035
  • Table 124: Middle East and Africa Market Volume (Thousand MT) Forecast by Sales Channel, 2020-2035
  • Table 125: Middle East and Africa Market Value (USD Million) Forecast by Certification/Claim, 2020-2035
  • Table 126: Middle East and Africa Market Volume (Thousand MT) Forecast by Certification/Claim, 2020-2035
  • Table 127: Middle East and Africa Market Value (USD Million) Forecast by End Use, 2020-2035
  • Table 128: Middle East and Africa Market Volume (Thousand MT) Forecast by End Use, 2020-2035

List of Figures

  • Figure 1: Global Market Volume (Thousand MT) Forecast 2020-2035
  • Figure 2: Global Market Pricing Analysis
  • Figure 3: Global Market Value (USD Million) Forecast 2020-2035
  • Figure 4: Global Market Value Share and BPS Analysis by Product Type, 2025 and 2035
  • Figure 5: Global Market Y-o-Y Growth Comparison by Product Type, 2025-2035
  • Figure 6: Global Market Attractiveness Analysis by Product Type
  • Figure 7: Global Market Value Share and BPS Analysis by Livestock Type, 2025 and 2035
  • Figure 8: Global Market Y-o-Y Growth Comparison by Livestock Type, 2025-2035
  • Figure 9: Global Market Attractiveness Analysis by Livestock Type
  • Figure 10: Global Market Value Share and BPS Analysis by Application, 2025 and 2035
  • Figure 11: Global Market Y-o-Y Growth Comparison by Application, 2025-2035
  • Figure 12: Global Market Attractiveness Analysis by Application
  • Figure 13: Global Market Value Share and BPS Analysis by Form, 2025 and 2035
  • Figure 14: Global Market Y-o-Y Growth Comparison by Form, 2025-2035
  • Figure 15: Global Market Attractiveness Analysis by Form
  • Figure 16: Global Market Value Share and BPS Analysis by Sales Channel, 2025 and 2035
  • Figure 17: Global Market Y-o-Y Growth Comparison by Sales Channel, 2025-2035
  • Figure 18: Global Market Attractiveness Analysis by Sales Channel
  • Figure 19: Global Market Value Share and BPS Analysis by Certification/Claim, 2025 and 2035
  • Figure 20: Global Market Y-o-Y Growth Comparison by Certification/Claim, 2025-2035
  • Figure 21: Global Market Attractiveness Analysis by Certification/Claim
  • Figure 22: Global Market Value Share and BPS Analysis by End Use, 2025 and 2035
  • Figure 23: Global Market Y-o-Y Growth Comparison by End Use, 2025-2035
  • Figure 24: Global Market Attractiveness Analysis by End Use
  • Figure 25: Global Market Value (USD Million) Share and BPS Analysis by Region, 2025 and 2035
  • Figure 26: Global Market Y-o-Y Growth Comparison by Region, 2025-2035
  • Figure 27: Global Market Attractiveness Analysis by Region
  • Figure 28: North America Market Incremental $ Opportunity, 2025-2035
  • Figure 29: Latin America Market Incremental $ Opportunity, 2025-2035
  • Figure 30: Western Europe Market Incremental $ Opportunity, 2025-2035
  • Figure 31: Eastern Europe Market Incremental $ Opportunity, 2025-2035
  • Figure 32: East Asia Market Incremental $ Opportunity, 2025-2035
  • Figure 33: South Asia & Pacific Market Incremental $ Opportunity, 2025-2035
  • Figure 34: Middle East and Africa Market Incremental $ Opportunity, 2025-2035
  • Figure 35: North America Market Value Share and BPS Analysis by Country, 2025 and 2035
  • Figure 36: North America Market Value Share and BPS Analysis by Product Type, 2025 and 2035
  • Figure 37: North America Market Y-o-Y Growth Comparison by Product Type, 2025-2035
  • Figure 38: North America Market Attractiveness Analysis by Product Type
  • Figure 39: North America Market Value Share and BPS Analysis by Livestock Type, 2025 and 2035
  • Figure 40: North America Market Y-o-Y Growth Comparison by Livestock Type, 2025-2035
  • Figure 41: North America Market Attractiveness Analysis by Livestock Type
  • Figure 42: North America Market Value Share and BPS Analysis by Application, 2025 and 2035
  • Figure 43: North America Market Y-o-Y Growth Comparison by Application, 2025-2035
  • Figure 44: North America Market Attractiveness Analysis by Application
  • Figure 45: North America Market Value Share and BPS Analysis by Form, 2025 and 2035
  • Figure 46: North America Market Y-o-Y Growth Comparison by Form, 2025-2035
  • Figure 47: North America Market Attractiveness Analysis by Form
  • Figure 48: North America Market Value Share and BPS Analysis by Sales Channel, 2025 and 2035
  • Figure 49: North America Market Y-o-Y Growth Comparison by Sales Channel, 2025-2035
  • Figure 50: North America Market Attractiveness Analysis by Sales Channel
  • Figure 51: North America Market Value Share and BPS Analysis by Certification/Claim, 2025 and 2035
  • Figure 52: North America Market Y-o-Y Growth Comparison by Certification/Claim, 2025-2035
  • Figure 53: North America Market Attractiveness Analysis by Certification/Claim
  • Figure 54: North America Market Value Share and BPS Analysis by End Use, 2025 and 2035
  • Figure 55: North America Market Y-o-Y Growth Comparison by End Use, 2025-2035
  • Figure 56: North America Market Attractiveness Analysis by End Use
  • Figure 57: Latin America Market Value Share and BPS Analysis by Country, 2025 and 2035
  • Figure 58: Latin America Market Value Share and BPS Analysis by Product Type, 2025 and 2035
  • Figure 59: Latin America Market Y-o-Y Growth Comparison by Product Type, 2025-2035
  • Figure 60: Latin America Market Attractiveness Analysis by Product Type
  • Figure 61: Latin America Market Value Share and BPS Analysis by Livestock Type, 2025 and 2035
  • Figure 62: Latin America Market Y-o-Y Growth Comparison by Livestock Type, 2025-2035
  • Figure 63: Latin America Market Attractiveness Analysis by Livestock Type
  • Figure 64: Latin America Market Value Share and BPS Analysis by Application, 2025 and 2035
  • Figure 65: Latin America Market Y-o-Y Growth Comparison by Application, 2025-2035
  • Figure 66: Latin America Market Attractiveness Analysis by Application
  • Figure 67: Latin America Market Value Share and BPS Analysis by Form, 2025 and 2035
  • Figure 68: Latin America Market Y-o-Y Growth Comparison by Form, 2025-2035
  • Figure 69: Latin America Market Attractiveness Analysis by Form
  • Figure 70: Latin America Market Value Share and BPS Analysis by Sales Channel, 2025 and 2035
  • Figure 71: Latin America Market Y-o-Y Growth Comparison by Sales Channel, 2025-2035
  • Figure 72: Latin America Market Attractiveness Analysis by Sales Channel
  • Figure 73: Latin America Market Value Share and BPS Analysis by Certification/Claim, 2025 and 2035
  • Figure 74: Latin America Market Y-o-Y Growth Comparison by Certification/Claim, 2025-2035
  • Figure 75: Latin America Market Attractiveness Analysis by Certification/Claim
  • Figure 76: Latin America Market Value Share and BPS Analysis by End Use, 2025 and 2035
  • Figure 77: Latin America Market Y-o-Y Growth Comparison by End Use, 2025-2035
  • Figure 78: Latin America Market Attractiveness Analysis by End Use
  • Figure 79: Western Europe Market Value Share and BPS Analysis by Country, 2025 and 2035
  • Figure 80: Western Europe Market Value Share and BPS Analysis by Product Type, 2025 and 2035
  • Figure 81: Western Europe Market Y-o-Y Growth Comparison by Product Type, 2025-2035
  • Figure 82: Western Europe Market Attractiveness Analysis by Product Type
  • Figure 83: Western Europe Market Value Share and BPS Analysis by Livestock Type, 2025 and 2035
  • Figure 84: Western Europe Market Y-o-Y Growth Comparison by Livestock Type, 2025-2035
  • Figure 85: Western Europe Market Attractiveness Analysis by Livestock Type
  • Figure 86: Western Europe Market Value Share and BPS Analysis by Application, 2025 and 2035
  • Figure 87: Western Europe Market Y-o-Y Growth Comparison by Application, 2025-2035
  • Figure 88: Western Europe Market Attractiveness Analysis by Application
  • Figure 89: Western Europe Market Value Share and BPS Analysis by Form, 2025 and 2035
  • Figure 90: Western Europe Market Y-o-Y Growth Comparison by Form, 2025-2035
  • Figure 91: Western Europe Market Attractiveness Analysis by Form
  • Figure 92: Western Europe Market Value Share and BPS Analysis by Sales Channel, 2025 and 2035
  • Figure 93: Western Europe Market Y-o-Y Growth Comparison by Sales Channel, 2025-2035
  • Figure 94: Western Europe Market Attractiveness Analysis by Sales Channel
  • Figure 95: Western Europe Market Value Share and BPS Analysis by Certification/Claim, 2025 and 2035
  • Figure 96: Western Europe Market Y-o-Y Growth Comparison by Certification/Claim, 2025-2035
  • Figure 97: Western Europe Market Attractiveness Analysis by Certification/Claim
  • Figure 98: Western Europe Market Value Share and BPS Analysis by End Use, 2025 and 2035
  • Figure 99: Western Europe Market Y-o-Y Growth Comparison by End Use, 2025-2035
  • Figure 100: Western Europe Market Attractiveness Analysis by End Use
  • Figure 101: Eastern Europe Market Value Share and BPS Analysis by Country, 2025 and 2035
  • Figure 102: Eastern Europe Market Value Share and BPS Analysis by Product Type, 2025 and 2035
  • Figure 103: Eastern Europe Market Y-o-Y Growth Comparison by Product Type, 2025-2035
  • Figure 104: Eastern Europe Market Attractiveness Analysis by Product Type
  • Figure 105: Eastern Europe Market Value Share and BPS Analysis by Livestock Type, 2025 and 2035
  • Figure 106: Eastern Europe Market Y-o-Y Growth Comparison by Livestock Type, 2025-2035
  • Figure 107: Eastern Europe Market Attractiveness Analysis by Livestock Type
  • Figure 108: Eastern Europe Market Value Share and BPS Analysis by Application, 2025 and 2035
  • Figure 109: Eastern Europe Market Y-o-Y Growth Comparison by Application, 2025-2035
  • Figure 110: Eastern Europe Market Attractiveness Analysis by Application
  • Figure 111: Eastern Europe Market Value Share and BPS Analysis by Form, 2025 and 2035
  • Figure 112: Eastern Europe Market Y-o-Y Growth Comparison by Form, 2025-2035
  • Figure 113: Eastern Europe Market Attractiveness Analysis by Form
  • Figure 114: Eastern Europe Market Value Share and BPS Analysis by Sales Channel, 2025 and 2035
  • Figure 115: Eastern Europe Market Y-o-Y Growth Comparison by Sales Channel, 2025-2035
  • Figure 116: Eastern Europe Market Attractiveness Analysis by Sales Channel
  • Figure 117: Eastern Europe Market Value Share and BPS Analysis by Certification/Claim, 2025 and 2035
  • Figure 118: Eastern Europe Market Y-o-Y Growth Comparison by Certification/Claim, 2025-2035
  • Figure 119: Eastern Europe Market Attractiveness Analysis by Certification/Claim
  • Figure 120: Eastern Europe Market Value Share and BPS Analysis by End Use, 2025 and 2035
  • Figure 121: Eastern Europe Market Y-o-Y Growth Comparison by End Use, 2025-2035
  • Figure 122: Eastern Europe Market Attractiveness Analysis by End Use
  • Figure 123: East Asia Market Value Share and BPS Analysis by Country, 2025 and 2035
  • Figure 124: East Asia Market Value Share and BPS Analysis by Product Type, 2025 and 2035
  • Figure 125: East Asia Market Y-o-Y Growth Comparison by Product Type, 2025-2035
  • Figure 126: East Asia Market Attractiveness Analysis by Product Type
  • Figure 127: East Asia Market Value Share and BPS Analysis by Livestock Type, 2025 and 2035
  • Figure 128: East Asia Market Y-o-Y Growth Comparison by Livestock Type, 2025-2035
  • Figure 129: East Asia Market Attractiveness Analysis by Livestock Type
  • Figure 130: East Asia Market Value Share and BPS Analysis by Application, 2025 and 2035
  • Figure 131: East Asia Market Y-o-Y Growth Comparison by Application, 2025-2035
  • Figure 132: East Asia Market Attractiveness Analysis by Application
  • Figure 133: East Asia Market Value Share and BPS Analysis by Form, 2025 and 2035
  • Figure 134: East Asia Market Y-o-Y Growth Comparison by Form, 2025-2035
  • Figure 135: East Asia Market Attractiveness Analysis by Form
  • Figure 136: East Asia Market Value Share and BPS Analysis by Sales Channel, 2025 and 2035
  • Figure 137: East Asia Market Y-o-Y Growth Comparison by Sales Channel, 2025-2035
  • Figure 138: East Asia Market Attractiveness Analysis by Sales Channel
  • Figure 139: East Asia Market Value Share and BPS Analysis by Certification/Claim, 2025 and 2035
  • Figure 140: East Asia Market Y-o-Y Growth Comparison by Certification/Claim, 2025-2035
  • Figure 141: East Asia Market Attractiveness Analysis by Certification/Claim
  • Figure 142: East Asia Market Value Share and BPS Analysis by End Use, 2025 and 2035
  • Figure 143: East Asia Market Y-o-Y Growth Comparison by End Use, 2025-2035
  • Figure 144: East Asia Market Attractiveness Analysis by End Use
  • Figure 145: South Asia & Pacific Market Value Share and BPS Analysis by Country, 2025 and 2035
  • Figure 146: South Asia & Pacific Market Value Share and BPS Analysis by Product Type, 2025 and 2035
  • Figure 147: South Asia & Pacific Market Y-o-Y Growth Comparison by Product Type, 2025-2035
  • Figure 148: South Asia & Pacific Market Attractiveness Analysis by Product Type
  • Figure 149: South Asia & Pacific Market Value Share and BPS Analysis by Livestock Type, 2025 and 2035
  • Figure 150: South Asia & Pacific Market Y-o-Y Growth Comparison by Livestock Type, 2025-2035
  • Figure 151: South Asia & Pacific Market Attractiveness Analysis by Livestock Type
  • Figure 152: South Asia & Pacific Market Value Share and BPS Analysis by Application, 2025 and 2035
  • Figure 153: South Asia & Pacific Market Y-o-Y Growth Comparison by Application, 2025-2035
  • Figure 154: South Asia & Pacific Market Attractiveness Analysis by Application
  • Figure 155: South Asia & Pacific Market Value Share and BPS Analysis by Form, 2025 and 2035
  • Figure 156: South Asia & Pacific Market Y-o-Y Growth Comparison by Form, 2025-2035
  • Figure 157: South Asia & Pacific Market Attractiveness Analysis by Form
  • Figure 158: South Asia & Pacific Market Value Share and BPS Analysis by Sales Channel, 2025 and 2035
  • Figure 159: South Asia & Pacific Market Y-o-Y Growth Comparison by Sales Channel, 2025-2035
  • Figure 160: South Asia & Pacific Market Attractiveness Analysis by Sales Channel
  • Figure 161: South Asia & Pacific Market Value Share and BPS Analysis by Certification/Claim, 2025 and 2035
  • Figure 162: South Asia & Pacific Market Y-o-Y Growth Comparison by Certification/Claim, 2025-2035
  • Figure 163: South Asia & Pacific Market Attractiveness Analysis by Certification/Claim
  • Figure 164: South Asia & Pacific Market Value Share and BPS Analysis by End Use, 2025 and 2035
  • Figure 165: South Asia & Pacific Market Y-o-Y Growth Comparison by End Use, 2025-2035
  • Figure 166: South Asia & Pacific Market Attractiveness Analysis by End Use
  • Figure 167: Middle East and Africa Market Value Share and BPS Analysis by Country, 2025 and 2035
  • Figure 168: Middle East and Africa Market Value Share and BPS Analysis by Product Type, 2025 and 2035
  • Figure 169: Middle East and Africa Market Y-o-Y Growth Comparison by Product Type, 2025-2035
  • Figure 170: Middle East and Africa Market Attractiveness Analysis by Product Type
  • Figure 171: Middle East and Africa Market Value Share and BPS Analysis by Livestock Type, 2025 and 2035
  • Figure 172: Middle East and Africa Market Y-o-Y Growth Comparison by Livestock Type, 2025-2035
  • Figure 173: Middle East and Africa Market Attractiveness Analysis by Livestock Type
  • Figure 174: Middle East and Africa Market Value Share and BPS Analysis by Application, 2025 and 2035
  • Figure 175: Middle East and Africa Market Y-o-Y Growth Comparison by Application, 2025-2035
  • Figure 176: Middle East and Africa Market Attractiveness Analysis by Application
  • Figure 177: Middle East and Africa Market Value Share and BPS Analysis by Form, 2025 and 2035
  • Figure 178: Middle East and Africa Market Y-o-Y Growth Comparison by Form, 2025-2035
  • Figure 179: Middle East and Africa Market Attractiveness Analysis by Form
  • Figure 180: Middle East and Africa Market Value Share and BPS Analysis by Sales Channel, 2025 and 2035
  • Figure 181: Middle East and Africa Market Y-o-Y Growth Comparison by Sales Channel, 2025-2035
  • Figure 182: Middle East and Africa Market Attractiveness Analysis by Sales Channel
  • Figure 183: Middle East and Africa Market Value Share and BPS Analysis by Certification/Claim, 2025 and 2035
  • Figure 184: Middle East and Africa Market Y-o-Y Growth Comparison by Certification/Claim, 2025-2035
  • Figure 185: Middle East and Africa Market Attractiveness Analysis by Certification/Claim
  • Figure 186: Middle East and Africa Market Value Share and BPS Analysis by End Use, 2025 and 2035
  • Figure 187: Middle East and Africa Market Y-o-Y Growth Comparison by End Use, 2025-2035
  • Figure 188: Middle East and Africa Market Attractiveness Analysis by End Use
  • Figure 189: Global Market - Tier Structure Analysis
  • Figure 190: Global Market - Company Share Analysis

Frequently Asked Questions

What is the projected industry value of the hemp animal feed market in 2025?

The industry is projected to reach USD 657.3 million in 2025.

What is the expected global CAGR for the hemp animal feed market from 2025 to 2035?

The industry is expected to grow at a CAGR of 3.5% from 2025 to 2035.

Which segment is expected to dominate the hemp animal feed market in 2025?

Hemp seed meal is expected to lead with a 38% share in 2025.

Which region is forecasted to show significant growth in the hemp animal feed market by 2035?

India is projected to register the highest CAGR of 5.8% from 2025 to 2035.

What is the forecasted industry value of the hemp animal feed market by 2035?

The industry is projected to reach USD 927.2 million by 2035.

Explore Similar Insights

Future Market Insights

Hemp Animal Feed Market