Reports

- Global Locations -

Headquarters

Future Market Insights, Inc.

Christiana Corporate, 200
Continental Drive, Suite 401,
Newark, Delaware - 19713,
United States

T: +1-347-918-3531

Americas

Future Market Insights, Inc.

616 Corporate Way, Suite 2-9018,
Valley Cottage, NY 10989, United States

MEA

Future Market Insights

1602-6 Jumeirah Bay X2 Tower, Plot No: JLT-PH2-X2A,
Jumeirah Lakes Towers, Dubai,
United Arab Emirates

Europe

Future Market Insights

3rd Floor, 207 Regent Street,
W1B 3HH London
United Kingdom

T: + 44 (0) 20 8123 9659

Asia Pacific

Future Market Insights

IndiaLand Global Tech Park, Unit UG-1, Behind Grand HighStreet, Phase 1, Hinjawadi, MH, Pune – 411057, India

Hemp-based Packaging Market Outlook

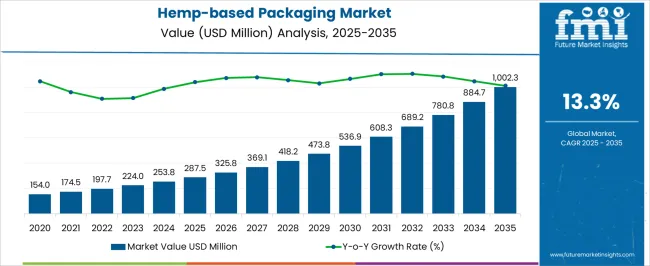
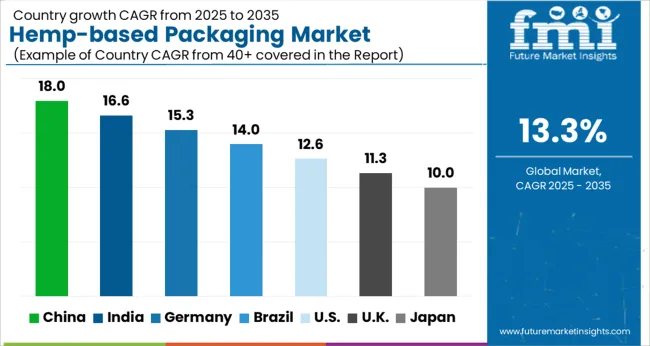
The hemp-based packaging market size is projected to be valued at US$ 224 million in 2023 and is expected to rise to US$ 782 million by 2033. The sales of hemp-based packaging are expected to record a significant CAGR of 13.3% during the forecast period.

Hemp-based packaging is gaining traction as a sustainable alternative to regular packaging materials.  With increased environmental awareness, substantial organizations are looking for eco-friendly packaging solutions for their purposes.

The fact that hemp is biodegradable and compostable is one of its primary benefits. In contrast to standard packaging materials like plastic. Therefore, this can take hundreds of years to degrade, whereas, hemp-based packaging can decompose in as little as six months.

Hemp-based packaging is also highly resilient and long-lasting. It can withstand high temperatures and humidity, making it a great material for protecting objects from adverse conditions.

Governments and regulatory authorities are taking steps to reduce plastic waste and encourage environmentally friendly packaging.

  • The European Union, for example, has set a goal of making all plastic packaging reusable or recyclable by 2030. This regulatory push towards sustainability is projected to fuel future demand for hemp-based packaging.

The increased availability and accessibility of hemp as a raw material is another factor driving the expansion of the hemp-based packaging market.

Many countries, including the United States, have legalized hemp growing, making it easier for businesses to get hemp-based packaging materials.

Hemp-based packaging has the potential for innovation and product development in the future. Hemp can be used with other materials to produce one-of-a-kind and environmentally friendly packaging solutions.

Researchers are investigating the use of hemp fibers in 3D printing, which could open up new avenues for sustainable package design.

Despite the numerous advantages of hemp-based packaging, there are still certain hurdles to overcome. One of the key challenges is a lack of hemp infrastructure and processing facilities in various regions. This can make sourcing hemp-based packaging materials on a broad scale challenging for businesses.

However, more organizations recognize the characteristics of hemp-based packaging and invest in the necessary infrastructure. It may anticipate further acceptance of this eco-friendly alternative.

Attribute Details
Hemp-based Packaging Market Estimated Size (2023) US$ 224 million
Hemp-based Packaging Market CAGR (2023 to 2033) 13.3%
Hemp-based Packaging Market Forecasted Size (2033) US$ 782 million

Don't pay for what you don't need

Customize your report by selecting specific countries or regions and save 30%!

How Hemp-based Packaging is Likely to Impact the Industry Dynamics

It has the potential to revolutionize the packaging industry by offering an environmentally friendly and sustainable alternative to traditional methods.

  • To begin, the emphasis on sustainability is a prominent trend in the sector. As more organizations and consumers become conscious of the environmental impact of traditional packaging materials. Hemp-based packaging is renewable, biodegradable, and recyclable, making it an appealing option for individuals who value environmental sustainability. Companies that provide hemp-based packaging materials are likely to gain a competitive advantage over those that do not. As demand for sustainable solutions grows.
  • Hemp packaging is a versatile material that can be mixed with other materials to produce novel packaging solutions. This creates potential for innovative product development and creative designs, which could provide enterprises with a market advantage.
  • As governments and regulatory organizations around the world implement efforts to decrease plastic waste and promote sustainable solutions, regulatory compliance is a critical issue for businesses. Hemp-based packaging is a realistic choice for businesses trying to comply with these requirements. This could change industry dynamics towards more environmentally friendly options.
  • Companies that do not provide eco-friendly options risk falling behind, whereas those that prioritize sustainability are more likely to stand out in the market. This could alter the packaging industry's dynamics as companies seek to provide the most sustainable packaging options.
  • Finally, the expansion of the hemp-based packaging business is likely to result in additional job opportunities and economic progress.

What Does the Future Hold for the Market?

Given the rising demand for sustainable packaging solutions and growing environmental concerns, the sector is likely to grow tremendously. As more people become conscious of the environmental impact of traditional packaging materials. There has been a substantial shift towards eco-friendly and biodegradable packaging options.

The increasing legalization of cannabis and hemp farming in various nations is likely to propel the hemp-based packaging market forward. Hemp can be cultivated without the use of pesticides or herbicides. Making it a more environmentally friendly and sustainable alternative to other plant-based materials used in packaging.

Technological breakthroughs in hemp-based packaging are projected to drive market expansion. Such as improvements in production processes and the development of new hemp-based materials. The usage of hemp fibers and shiv for packaging is likely to grow since these materials have a high strength-to-weight ratio. Making them excellent for a wide range of packaging applications.

Overall, the hemp-based packaging industry is predicted to increase significantly in the future years. Due to the rising demand for sustainable packaging solutions and hemp's growing appeal as a raw material.

Considering the above-mentioned factors FMI opines that the hemp-based packaging market is likely to witness a transformative growth rate of 13.3% in comparison to 10.97% from 2018 to 2022.

Ismail Sutaria
Ismail Sutaria

Principal Consultant

Talk to Analyst

Find your sweet spots for generating winning opportunities in this market.

Comparative View of the Adjacent Market

Hemp-based Packaging Market:

Attributes Hemp-based Packaging Market
CAGR (2023 to 2033) 13.3%
Market Value (2033) US$ 782 million
Growth Factor Growing consumer preferences towards various alternative plastic packaging are likely to serve as a growth indicator for the market of hemp-based packaging.
Opportunity The legalization of cannabis and hemp in many economies is opening profitable doors for the hemp-based packaging market.
Key Trends Technological advancements in manufacturing capabilities combined with supporting infrastructure are serving as a key trend in the market.

CBD Gummies Market:

Attributes CBD Gummies Market
CAGR (2023 to 2033) 29.0%
Market Value (2033) US$ 1,980 million
Growth Factor High proof of the effectiveness of CBD gummies for anxiety in general popular culture is projected to be the main driver of such increased sales of CBD gummies in the local market.
Opportunity For good reason, CBD gummies have fast gained popularity. They are enjoyable, pleasant, and simple to use medicines. Additionally, they offer all of the advantages of CBD oil without any of the potential disadvantages.
Key Trends With the rise of online platforms in recent years, the online distribution channel is gaining speed and growing more quickly. Since all brick-and-mortar businesses were shut down widely as a result of the epidemic, overall sales through offline channels significantly declined.

CBD Snacks Market:

Attributes CBD Snacks Market
CAGR (2023 to 2033) 13.2%
Market Value (2033) US$ 1,169.96 billion
Growth Factor One of the key factors propelling the growth of the CBD-infused snack market is consumers' rising preference for natural organic products over medicines.
Opportunity Rapid industrialization and infrastructure expansion in developing countries have increased the use of rented alternative energy resources for prime power applications.
Key Trends The market for CBD-infused snacks is being positively impacted by a rise in social media influencers. Moreover, product launches, mergers, and acquisitions among leading firms, R&D initiatives, a change in lifestyle, and an increase in disposable income.

Category-wise Insights of Hemp-based Packaging

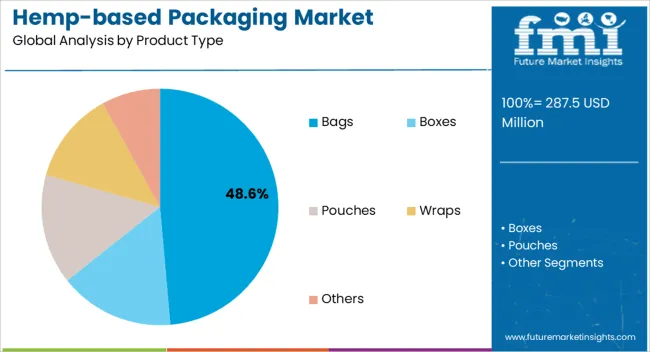
Hemp Bags are Becoming Increasingly Popular Due to being Sustainable and Eco-friendlier

Hemp bags have various advantages over regular bags, including being biodegradable, long-lasting, and tear-resistant. Hemp fibers have a high strength-to-weight ratio, making them perfect for a variety of packaging applications.

The food and beverage industry is a key end-user of hemp-based bags, especially for packaging snacks, coffee, tea, and other food items. Hemp bags are also increasingly being utilized to package products such as supplements, vitamins, and cosmetics in the healthcare and personal care industries. The growing popularity of e-commerce and online retail is also predicted to boost the segment growth.

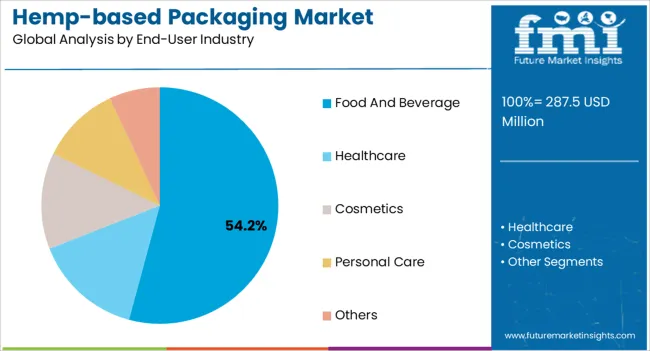
Food and beverage Firms are Increasingly Embracing Sustainable Packaging Solutions to Differentiate their Products and Appeal to Eco-conscious Consumers

The food and beverage industry is one of the prominent consumers of packaging materials. There is a growing demand in this industry for sustainable and environmentally friendly packaging solutions. Furthermore, hemp-based packaging is appropriate for packing both dry food and liquids. Hemp-based packaging offers great barrier characteristics, which aid in the preservation of the product's freshness and quality. Ensuring that it is delivered to the consumer in optimal condition.
Get the data you need at a Fraction of the cost

Personalize your report by choosing insights you need
and save 40%!

Regional Analysis of the Market

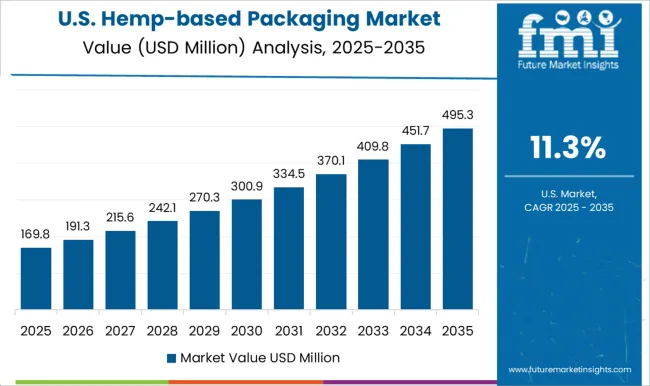
North America is predicted to Account for a Sizable Portion of the Global Hemp-based Packaging Industry

The growing need for eco-friendly packaging solutions, combined with favorable government regulations, is propelling the market in North America.

The adoption of the 2018 Farm Bill in the United States legalized the growth and sale of industrial hemp, resulting in a rise in the manufacturing of hemp-based products, including packaging. 

Canada is another key market in North America for the hemp-based packaging business. The Canadian government has launched various measures to encourage sustainable packaging alternatives, including the creation of a national zero-waste policy. These initiatives have opened opportunities for Canadian enterprises involved in the hemp-based packaging market.

The Growing Need for Sustainable Packaging Options, combined with Stringent Rules on Single-use Plastic, is Propelling the Market in Europe

Several European countries have established severe rules to reduce the use of single-use plastic, offering the potential for hemp-based packaging industries. The European Union's Single-use Plastic Directive, which prohibits the use of some single-use plastic items, is likely to raise demand for sustainable packaging.

Germany is one of Europe's leading markets for hemp-based packaging, owing to the country's strong emphasis on sustainability and eco-friendliness.

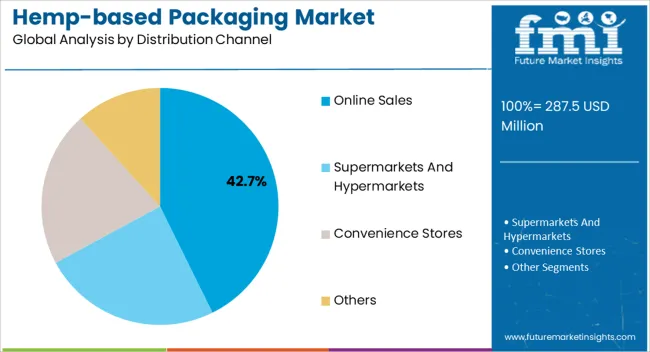
To lessen their environmental impact, online businesses are increasingly embracing eco-friendly packaging options, and hemp-based packaging is seen as an excellent choice.

Asia Pacific Hemp-based Packaging Market May Witness an Immensive Growth

China is one of Asia Pacific's key markets for hemp-based packaging. Owing to the country's growing emphasis on sustainability and the development of the green economy. The Chinese government has launched many measures to promote sustainable packaging solutions, offering the potential for hemp-based packaging enterprises.
A competitive Market Environment – the Existence of Various Competitors, Ranging from Sizable Multinational Organizations to Small and Medium-sized Businesses

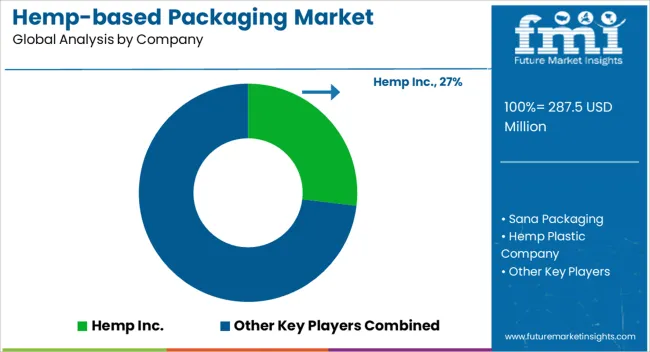
The market is highly competitive and fragmented, with competitors competing on product innovation, pricing strategies, and distribution networks.

Hemp Inc., Sana Packaging, Hemp Plastic Company, International Paper Company, Elevate Packaging, Inc., and others are among the leading companies in the market. To fulfill the growing demand for eco-friendly packaging options, these firms are focused on product innovation. Similarly, on the development of sustainable packaging solutions.

Hemp Plastic business, for example, teamed with Canadian packaging business Plastique in 2021. To expand its production capacity and fulfill the growing demand for hemp-based packaging solutions.

Manufacturers and Service Providers in the Sector can Expand in a Variety of Ways, including:

  • Product Innovation: By developing innovative and sustainable packaging solutions, manufacturers can differentiate their products and attract more customers.
  • Strategic Alliances: Companies can develop alliances with other value chain participants. Such as suppliers, distributors, and retailers, to broaden their reach and boost their market share.
  • Geographic Expansion: By establishing a presence in new regions or nations, businesses can access new markets and grow their consumer base.
  • Marketing and Branding: Strong branding and marketing initiatives can assist businesses in differentiating themselves from competitors and increasing their market presence.
  • Customer Engagement: Engaging with customers and understanding their wants can assist businesses in developing products. To satisfy their demands and build brand loyalty.

Scope of the Report

Attribute Details
Growth Rate CAGR of 13.3% from 2022 to 2032
Base Year of Estimation 2022
Historical Data 2018 to 2022
Forecast Period 2023 to 2033
Quantitative Units Revenue in US$ million and Volume in Units and F-CAGR from 2023 to 2033
Report Coverage Revenue Forecast, Volume Forecast, Company Ranking, Competitive Landscape, growth factors, Trends, and Pricing Analysis
Key Segments Covered
  • By Product Type
  • By End-User Industry
  • By Distribution Channel
  • By Region
Regions Covered
  • North America
  • Latin America
  • Europe
  • East Asia
  • South Asia
  • The Middle East & Africa
  • Oceania
Key Countries Profiled
  • The United States
  • Canada
  • Brazil
  • Mexico
  • Germany
  • Italy
  • France
  • The United Kingdom
  • Spain
  • Russia
  • China
  • Japan
  • India
  • GCC Countries
  • Australia
Key Companies Profiled Hemp Inc., Sana Packaging, Hemp Plastic Company, International Paper Company, Elevate Packaging, Inc.
Customization & Pricing Available upon Request

Key Segments Covered in the Market Report

By Product Type:

  • Bags
  • Boxes
  • Pouches
  • Wraps
  • Others

By End-user Industry:

  • Food and Beverage
  • Healthcare
  • Cosmetics
  • Personal Care
  • Others

Distribution Channel:

  • Online Sales
  • Supermarkets and Hypermarkets
  • Convenience Stores
  • Others

By Region:

  • North America
  • Latin America
  • Western Europe
  • Eastern Europe
  • Asia Pacific Excluding Japan (APEJ)
  • Japan
  • The Middle East & Africa (MEA)

Frequently Asked Questions

How big is the market in 2023?

The market is expected to be valued at US$ 224.0 million in 2023.

Who are the key market players?

Hemp Inc., Sana Packaging, and Hemp Plastic Company are key market players.

Which is the key segment by product type?

Bags segment is likely to remain preferred through 2033.

What opportunities await the market players?

Technological advancements in manufacturing capabilities to boost the market prospects.

What is the growth forecast for Market?

The market is forecast to register a CAGR of 3.5% through 2033.

Table of Content

1. Executive Summary | Hemp-based Packaging Market

    1.1. Global Market Outlook

    1.2. Demand-side Trends

    1.3. Supply-side Trends

    1.4. Technology Roadmap Analysis

    1.5. Analysis and Recommendations

2. Market Overview

    2.1. Market Coverage / Taxonomy

    2.2. Market Definition / Scope / Limitations

3. Market Background

    3.1. Market Dynamics

        3.1.1. Drivers

        3.1.2. Restraints

        3.1.3. Opportunity

        3.1.4. Trends

    3.2. Scenario Forecast

        3.2.1. Demand in Optimistic Scenario

        3.2.2. Demand in Likely Scenario

        3.2.3. Demand in Conservative Scenario

    3.3. Product launches & Recent Developments

    3.4. Product Life Cycle Analysis

    3.5. Value Chain Analysis

        3.5.1. Supply Side Participants and their Roles

            3.5.1.1. Producers

            3.5.1.2. Mid-Level Participants (Traders/ Agents/ Brokers)

            3.5.1.3. Wholesalers and Distributors

        3.5.2. % of Operating Margin Analysis

        3.5.3. List of Existing and Potential Buyer’s

    3.6. Pricing Analysis

        3.6.1. Price Point Assessment by Region

        3.6.2. Price Point Assessment by production

        3.6.3. Price Forecast till 2032

        3.6.4. Factors affecting pricing

    3.7. Forecast Factors - Relevance & Impact

    3.8. Regulatory Landscape

    3.9. Regional Parent Market Outlook

    3.10. Production and Consumption Statistics

    3.11. Consumers Survey Analysis

    3.12. Macro-Economic Factors

4. Global Analysis 2018 to 2022 and Forecast, 2023 to 2033

    4.1. Historical Market Size Value (US$ Million) & Volume (Tonnes) Analysis, 2018 to 2022

    4.2. Current and Future Market Size Value (US$ Million) & Volume (Tonnes) Projections, 2023 to 2033

        4.2.1. Y-o-Y Growth Trend Analysis

        4.2.2. Absolute $ Opportunity Analysis

5. Global Analysis 2018 to 2022 and Forecast 2023 to 2033, By Material

    5.1. Introduction / Key Findings

    5.2. Historical Market Size Value (US$ Million) & Volume (Tonnes) Analysis By Material, 2018 to 2022

    5.3. Current and Future Market Size Value (US$ Million) & Volume (Tonnes) Analysis and Forecast By Material,

        5.3.1. 2023 to 2033

        5.3.2. Hemp Paper

        5.3.3. Hemp Plastic

        5.3.4. Hemp Fiber

        5.3.5. Hemp Fabric

        5.3.6. Others (Hemp Composite, etc.)

    5.4. Y-o-Y Growth Trend Analysis By Material, 2018 to 2022

    5.5. Absolute $ Opportunity Analysis By Material, 2023 to 2033

6. Global Analysis 2018 to 2022 and Forecast 2023 to 2033, By Packaging Formats

    6.1. Introduction / Key Findings

    6.2. Historical Market Size Value (US$ Million) & Volume (Tonnes) Analysis By Packaging Formats, 2018 to 2022

    6.3. Current and Future Market Size Value (US$ Million) & Volume (Tonnes) Analysis and Forecast By

        6.3.1. Packaging Formats, 2023 to 2033

        6.3.2. Boxes & Cartons

        6.3.3. Bags

        6.3.4. Pouches

        6.3.5. Bottles & Jars

        6.3.6. Others (Tags, Labels, etc.)

    6.4. Y-o-Y Growth Trend Analysis By Packaging Formats, 2018 to 2022

    6.5. Absolute $ Opportunity Analysis By Packaging Formats, 2023 to 2033

7. Global Analysis 2018 to 2022 and Forecast 2023 to 2033, By End Use

    7.1. Introduction / Key Findings

    7.2. Historical Market Size Value (US$ Million) & Volume (Tonnes) Analysis By End Use, 2018 to 2022

    7.3. Current and Future Market Size Value (US$ Million) & Volume (Tonnes) Analysis and Forecast By End Use,

        7.3.1. 2023 to 2033

        7.3.2. Food and Beverages

        7.3.3. Pharmaceuticals

        7.3.4. Personal care and cosmetics

        7.3.5. Textiles

    7.4. Y-o-Y Growth Trend Analysis By End Use, 2018 to 2022

    7.5. Absolute $ Opportunity Analysis By End Use, 2023 to 2033

8. Global Analysis 2018 to 2022 and Forecast 2023 to 2033, By Region

    8.1. Introduction

    8.2. Historical Market Size Value (US$ Million) & Volume (Tonnes) Analysis By Region, 2018 to 2022

    8.3. Current Market Size Value (US$ Million) & Volume (Tonnes) Analysis and Forecast By Region, 2023 to 2033

        8.3.1. North America

        8.3.2. Latin America

        8.3.3. Europe

        8.3.4. East Asia

        8.3.5. South Asia

        8.3.6. Oceania

        8.3.7. MEA

    8.4. Market Attractiveness Analysis By Region

9. North America Analysis 2018 to 2022 and Forecast 2023 to 2033, By Country

    9.1. Historical Market Size Value (US$ Million) & Volume (Tonnes) Trend Analysis By Market Taxonomy,

    9.2. 2018 to 2022

    9.3. Market Size Value (US$ Million) & Volume (Tonnes) Forecast By Market Taxonomy, 2023 to 2033

        9.3.1. By Country

            9.3.1.1. United States of America

            9.3.1.2. Canada

        9.3.2. By Material

        9.3.3. By Packaging Formats

        9.3.4. By End Use

    9.4. Market Attractiveness Analysis

        9.4.1. By Country

        9.4.2. By Material

        9.4.3. By Packaging Formats

        9.4.4. By End Use

    9.5. Key Takeaways

10. Latin America Analysis 2018 to 2022 and Forecast 2023 to 2033, By Country

    10.1. Historical Market Size Value (US$ Million) & Volume (Tonnes) Trend Analysis By Market Taxonomy,

        10.1.1. 2018 to 2022

    10.2. Market Size Value (US$ Million) & Volume (Tonnes) Forecast By Market Taxonomy, 2023 to 2033

        10.2.1. By Country

            10.2.1.1. Brazil

            10.2.1.2. Mexico

            10.2.1.3. Argentina

            10.2.1.4. Chile

            10.2.1.5. Peru

            10.2.1.6. Rest of Latin America

        10.2.2. By Material

        10.2.3. By Packaging Formats

        10.2.4. By End Use

    10.3. Market Attractiveness Analysis

        10.3.1. By Country

        10.3.2. By Material

        10.3.3. By Packaging Formats

        10.3.4. By End Use

    10.4. Key Takeaways

11. Europe Analysis 2018 to 2022 and Forecast 2023 to 2033, By Country

    11.1. Historical Market Size Value (US$ Million) & Volume (Tonnes) Trend Analysis By Market Taxonomy,

        11.1.1. 2018 to 2022

    11.2. Market Size Value (US$ Million) & Volume (Tonnes) Forecast By Market Taxonomy, 2023 to 2033

        11.2.1. By Country

            11.2.1.1. Germany

            11.2.1.2. Italy

            11.2.1.3. France

            11.2.1.4. United Kingdom

            11.2.1.5. Spain

            11.2.1.6. Russia

            11.2.1.7. BENELUX

            11.2.1.8. Poland

            11.2.1.9. Nordic Countries

            11.2.1.10. Rest of Europe

        11.2.2. By Material

        11.2.3. By Packaging Formats

        11.2.4. By End Use

    11.3. Market Attractiveness Analysis

        11.3.1. By Country

        11.3.2. By Material

        11.3.3. By Packaging Formats

        11.3.4. By End Use

    11.4. Key Takeaways

12. East Asia Analysis 2018 to 2022 and Forecast 2023 to 2033, By Country

    12.1. Historical Market Size Value (US$ Million) & Volume (Tonnes) Trend Analysis By Market Taxonomy,

        12.1.1. 2018 to 2022

    12.2. Market Size Value (US$ Million) & Volume (Tonnes) Forecast By Market Taxonomy, 2023 to 2033

        12.2.1. By Country

            12.2.1.1. China

            12.2.1.2. Japan

            12.2.1.3. South Korea

        12.2.2. By Material

        12.2.3. By Packaging Formats

        12.2.4. By End Use

    12.3. Market Attractiveness Analysis

        12.3.1. By Country

        12.3.2. By Material

        12.3.3. By Packaging Formats

        12.3.4. By End Use

    12.4. Key Takeaways

13. South Asia Analysis 2018 to 2022 and Forecast 2023 to 2033, By Country

    13.1. Historical Market Size Value (US$ Million) & Volume (Tonnes) Trend Analysis By Market Taxonomy,

        13.1.1. 2018 to 2022

    13.2. Market Size Value (US$ Million) & Volume (Tonnes) Forecast By Market Taxonomy, 2023 to 2033

        13.2.1. By Country

            13.2.1.1. India

            13.2.1.2. Thailand

            13.2.1.3. Malaysia

            13.2.1.4. Indonesia

            13.2.1.5. Singapore

            13.2.1.6. Rest of South Asia

        13.2.2. By Material

        13.2.3. By Packaging Formats

        13.2.4. By End Use

    13.3. Market Attractiveness Analysis

        13.3.1. By Country

        13.3.2. By Material

        13.3.3. By Packaging Formats

        13.3.4. By End Use

    13.4. Key Takeaways

14. Oceania Analysis 2018 to 2022 and Forecast 2023 to 2033, By Country

    14.1. Historical Market Size Value (US$ Million) & Volume (Tonnes) Trend Analysis By Market Taxonomy,

        14.1.1. 2018 to 2022

    14.2. Market Size Value (US$ Million) & Volume (Tonnes) Forecast By Market Taxonomy, 2023 to 2033

        14.2.1. By Country

            14.2.1.1. Australia

            14.2.1.2. New Zealand

        14.2.2. By Material

        14.2.3. By Packaging Formats

        14.2.4. By End Use

    14.3. Market Attractiveness Analysis

        14.3.1. By Country

        14.3.2. By Material

        14.3.3. By Packaging Formats

        14.3.4. By End Use

    14.4. Key Takeaways

15. MEA Analysis 2018 to 2022 and Forecast 2023 to 2033, By Country

    15.1. Historical Market Size Value (US$ Million) & Volume (Tonnes) Trend Analysis By Market Taxonomy,

        15.1.1. 2018 to 2022

    15.2. Market Size Value (US$ Million) & Volume (Tonnes) Forecast By Market Taxonomy, 2023 to 2033

        15.2.1. By Country

            15.2.1.1. GCC Countries

            15.2.1.2. South Africa

            15.2.1.3. Central Africa

            15.2.1.4. North Africa

        15.2.2. By Material

        15.2.3. By Packaging Formats

        15.2.4. By End Use

    15.3. Market Attractiveness Analysis

        15.3.1. By Country

        15.3.2. By Material

        15.3.3. By Packaging Formats

        15.3.4. By End Use

    15.4. Key Takeaways

16. Key Countries Analysis

    16.1. United States of America

        16.1.1. Pricing Analysis

        16.1.2. Market Share Analysis, 2022

            16.1.2.1. By Material

            16.1.2.2. By Packaging Formats

            16.1.2.3. By End Use

    16.2. Canada

        16.2.1. Pricing Analysis

        16.2.2. Market Share Analysis, 2022

            16.2.2.1. By Material

            16.2.2.2. By Packaging Formats

            16.2.2.3. By End Use

    16.3. Brazil

        16.3.1. Pricing Analysis

        16.3.2. Market Share Analysis, 2022

            16.3.2.1. By Material

            16.3.2.2. By Packaging Formats

            16.3.2.3. By End Use

    16.4. Mexico

        16.4.1. Pricing Analysis

        16.4.2. Market Share Analysis, 2022

            16.4.2.1. By Material

            16.4.2.2. By Packaging Formats

            16.4.2.3. By End Use

    16.5. Argentina

        16.5.1. Pricing Analysis

        16.5.2. Market Share Analysis, 2022

            16.5.2.1. By Material

            16.5.2.2. By Packaging Formats

            16.5.2.3. By End Use

    16.6. Chile

        16.6.1. Pricing Analysis

        16.6.2. Market Share Analysis, 2022

            16.6.2.1. By Material

            16.6.2.2. By Packaging Formats

            16.6.2.3. By End Use

    16.7. Peru

        16.7.1. Pricing Analysis

        16.7.2. Market Share Analysis, 2022

            16.7.2.1. By Material

            16.7.2.2. By Packaging Formats

            16.7.2.3. By End Use

    16.8. Germany

        16.8.1. Pricing Analysis

        16.8.2. Market Share Analysis, 2022

            16.8.2.1. By Material

            16.8.2.2. By Packaging Formats

            16.8.2.3. By End Use

    16.9. Italy

        16.9.1. Pricing Analysis

        16.9.2. Market Share Analysis, 2022

            16.9.2.1. By Material

            16.9.2.2. By Packaging Formats

            16.9.2.3. By End Use

    16.10. France

        16.10.1. Pricing Analysis

        16.10.2. Market Share Analysis, 2022

            16.10.2.1. By Material

            16.10.2.2. By Packaging Formats

            16.10.2.3. By End Use

    16.11. Spain

        16.11.1. Pricing Analysis

        16.11.2. Market Share Analysis, 2022

            16.11.2.1. By Material

            16.11.2.2. By Packaging Formats

            16.11.2.3. By End Use

    16.12. United Kingdom

        16.12.1. Pricing Analysis

        16.12.2. Market Share Analysis, 2022

            16.12.2.1. By Material

            16.12.2.2. By Packaging Formats

            16.12.2.3. By End Use

    16.13. Russia

        16.13.1. Pricing Analysis

        16.13.2. Market Share Analysis, 2022

            16.13.2.1. By Material

            16.13.2.2. By Packaging Formats

            16.13.2.3. By End Use

    16.14. Poland

        16.14.1. Pricing Analysis

        16.14.2. Market Share Analysis, 2022

            16.14.2.1. By Material

            16.14.2.2. By Packaging Formats

            16.14.2.3. By End Use

    16.15. BENELUX

        16.15.1. Pricing Analysis

        16.15.2. Market Share Analysis, 2022

            16.15.2.1. By Material

            16.15.2.2. By Packaging Formats

            16.15.2.3. By End Use

    16.16. Nordic Countries

        16.16.1. Pricing Analysis

        16.16.2. Market Share Analysis, 2022

            16.16.2.1. By Material

            16.16.2.2. By Packaging Formats

            16.16.2.3. By End Use

    16.17. China

        16.17.1. Pricing Analysis

        16.17.2. Market Share Analysis, 2022

            16.17.2.1. By Material

            16.17.2.2. By Packaging Formats

            16.17.2.3. By End Use

    16.18. Japan

        16.18.1. Pricing Analysis

        16.18.2. Market Share Analysis, 2022

            16.18.2.1. By Material

            16.18.2.2. By Packaging Formats

            16.18.2.3. By End Use

    16.19. South Korea

        16.19.1. Pricing Analysis

        16.19.2. Market Share Analysis, 2022

            16.19.2.1. By Material

            16.19.2.2. By Packaging Formats

            16.19.2.3. By End Use

    16.20. India

        16.20.1. Pricing Analysis

        16.20.2. Market Share Analysis, 2022

            16.20.2.1. By Material

            16.20.2.2. By Packaging Formats

            16.20.2.3. By End Use

    16.21. Thailand

        16.21.1. Pricing Analysis

        16.21.2. Market Share Analysis, 2022

            16.21.2.1. By Material

            16.21.2.2. By Packaging Formats

            16.21.2.3. By End Use

    16.22. Indonesia

        16.22.1. Pricing Analysis

        16.22.2. Market Share Analysis, 2022

            16.22.2.1. By Material

            16.22.2.2. By Packaging Formats

            16.22.2.3. By End Use

    16.23. Malaysia

        16.23.1. Pricing Analysis

        16.23.2. Market Share Analysis, 2022

            16.23.2.1. By Material

            16.23.2.2. By Packaging Formats

            16.23.2.3. By End Use

    16.24. Singapore

        16.24.1. Pricing Analysis

        16.24.2. Market Share Analysis, 2022

            16.24.2.1. By Material

            16.24.2.2. By Packaging Formats

            16.24.2.3. By End Use

    16.25. Australia

        16.25.1. Pricing Analysis

        16.25.2. Market Share Analysis, 2022

            16.25.2.1. By Material

            16.25.2.2. By Packaging Formats

            16.25.2.3. By End Use

    16.26. New Zealand

        16.26.1. Pricing Analysis

        16.26.2. Market Share Analysis, 2022

            16.26.2.1. By Material

            16.26.2.2. By Packaging Formats

            16.26.2.3. By End Use

    16.27. GCC Countries

        16.27.1. Pricing Analysis

        16.27.2. Market Share Analysis, 2022

            16.27.2.1. By Material

            16.27.2.2. By Packaging Formats

            16.27.2.3. By End Use

    16.28. South Africa

        16.28.1. Pricing Analysis

        16.28.2. Market Share Analysis, 2022

            16.28.2.1. By Material

            16.28.2.2. By Packaging Formats

            16.28.2.3. By End Use

    16.29. North Africa

        16.29.1. Pricing Analysis

        16.29.2. Market Share Analysis, 2022

            16.29.2.1. By Material

            16.29.2.2. By Packaging Formats

            16.29.2.3. By End Use

    16.30. Central Africa

        16.30.1. Pricing Analysis

        16.30.2. Market Share Analysis, 2022

            16.30.2.1. By Material

            16.30.2.2. By Packaging Formats

            16.30.2.3. By End Use

17. Market Structure Analysis

    17.1. Competition Dashboard

    17.2. Competition Benchmarking

    17.3. Market Share Analysis of Top Players

        17.3.1. By Regional

        17.3.2. By Material

        17.3.3. By Packaging Formats

        17.3.4. By End Use

18. Competition Analysis

    18.1. Competition Deep Dive

        18.1.1. Sana Packaging Inc

            18.1.1.1. Overview

            18.1.1.2. Product Portfolio

            18.1.1.3. Profitability by Market Segments (Product/Age /Sales Channel/Region)

            18.1.1.4. Sales Footprint

            18.1.1.5. Strategy Overview

                18.1.1.5.1. Marketing Strategy

                18.1.1.5.2. Product Strategy

                18.1.1.5.3. Channel Strategy

        18.1.2. OG Hemp Private Limited

            18.1.2.1. Overview

            18.1.2.2. Product Portfolio

            18.1.2.3. Profitability by Market Segments (Product/Age /Sales Channel/Region)

            18.1.2.4. Sales Footprint

            18.1.2.5. Strategy Overview

                18.1.2.5.1. Marketing Strategy

                18.1.2.5.2. Product Strategy

                18.1.2.5.3. Channel Strategy

        18.1.3. Landpack GmbH

            18.1.3.1. Overview

            18.1.3.2. Product Portfolio

            18.1.3.3. Profitability by Market Segments (Product/Age /Sales Channel/Region)

            18.1.3.4. Sales Footprint

            18.1.3.5. Strategy Overview

                18.1.3.5.1. Marketing Strategy

                18.1.3.5.2. Product Strategy

                18.1.3.5.3. Channel Strategy

        18.1.4. YBY Boxes

            18.1.4.1. Overview

            18.1.4.2. Product Portfolio

            18.1.4.3. Profitability by Market Segments (Product/Age /Sales Channel/Region)

            18.1.4.4. Sales Footprint

            18.1.4.5. Strategy Overview

                18.1.4.5.1. Marketing Strategy

                18.1.4.5.2. Product Strategy

                18.1.4.5.3. Channel Strategy

        18.1.5. Isovation

            18.1.5.1. Overview

            18.1.5.2. Product Portfolio

            18.1.5.3. Profitability by Market Segments (Product/Age /Sales Channel/Region)

            18.1.5.4. Sales Footprint

            18.1.5.5. Strategy Overview

                18.1.5.5.1. Marketing Strategy

                18.1.5.5.2. Product Strategy

                18.1.5.5.3. Channel Strategy

        18.1.6. Green Field Paper Company

            18.1.6.1. Overview

            18.1.6.2. Product Portfolio

            18.1.6.3. Profitability by Market Segments (Product/Age /Sales Channel/Region)

            18.1.6.4. Sales Footprint

            18.1.6.5. Strategy Overview

                18.1.6.5.1. Marketing Strategy

                18.1.6.5.2. Product Strategy

                18.1.6.5.3. Channel Strategy

        18.1.7. CBD Co-Packer

            18.1.7.1. Overview

            18.1.7.2. Product Portfolio

            18.1.7.3. Profitability by Market Segments (Product/Age /Sales Channel/Region)

            18.1.7.4. Sales Footprint

            18.1.7.5. Strategy Overview

                18.1.7.5.1. Marketing Strategy

                18.1.7.5.2. Product Strategy

                18.1.7.5.3. Channel Strategy

        18.1.8. The Mend

            18.1.8.1. Overview

            18.1.8.2. Product Portfolio

            18.1.8.3. Profitability by Market Segments (Product/Age /Sales Channel/Region)

            18.1.8.4. Sales Footprint

            18.1.8.5. Strategy Overview

                18.1.8.5.1. Marketing Strategy

                18.1.8.5.2. Product Strategy

                18.1.8.5.3. Channel Strategy

        18.1.9. Contempo Card Company.

            18.1.9.1. Overview

            18.1.9.2. Product Portfolio

            18.1.9.3. Profitability by Market Segments (Product/Age /Sales Channel/Region)

            18.1.9.4. Sales Footprint

            18.1.9.5. Strategy Overview

                18.1.9.5.1. Marketing Strategy

                18.1.9.5.2. Product Strategy

                18.1.9.5.3. Channel Strategy

        18.1.10. ONNO T-Shirt Company

            18.1.10.1. Overview

            18.1.10.2. Product Portfolio

            18.1.10.3. Profitability by Market Segments (Product/Age /Sales Channel/Region)

            18.1.10.4. Sales Footprint

            18.1.10.5. Strategy Overview

                18.1.10.5.1. Marketing Strategy

                18.1.10.5.2. Product Strategy

                18.1.10.5.3. Channel Strategy

        18.1.11. Rawganique

            18.1.11.1. Overview

            18.1.11.2. Product Portfolio

            18.1.11.3. Profitability by Market Segments (Product/Age /Sales Channel/Region)

            18.1.11.4. Sales Footprint

            18.1.11.5. Strategy Overview

                18.1.11.5.1. Marketing Strategy

                18.1.11.5.2. Product Strategy

                18.1.11.5.3. Channel Strategy

19. Assumptions & Acronyms Used

20. Research Methodology

List of Tables

Table 1: Global Value (US$ Million) Forecast by Region, 2018 to 2033

Table 2: Global Volume (Tonnes) Forecast by Region, 2018 to 2033

Table 3: Global Value (US$ Million) Forecast by Material, 2018 to 2033

Table 4: Global Volume (Tonnes) Forecast by Material, 2018 to 2033

Table 5: Global Value (US$ Million) Forecast by Packaging Formats, 2018 to 2033

Table 6: Global Volume (Tonnes) Forecast by Packaging Formats, 2018 to 2033

Table 7: Global Value (US$ Million) Forecast by End Use, 2018 to 2033

Table 8: Global Volume (Tonnes) Forecast by End Use, 2018 to 2033

Table 9: North America Value (US$ Million) Forecast by Country, 2018 to 2033

Table 10: North America Volume (Tonnes) Forecast by Country, 2018 to 2033

Table 11: North America Value (US$ Million) Forecast by Material, 2018 to 2033

Table 12: North America Volume (Tonnes) Forecast by Material, 2018 to 2033

Table 13: North America Value (US$ Million) Forecast by Packaging Formats, 2018 to 2033

Table 14: North America Volume (Tonnes) Forecast by Packaging Formats, 2018 to 2033

Table 15: North America Value (US$ Million) Forecast by End Use, 2018 to 2033

Table 16: North America Volume (Tonnes) Forecast by End Use, 2018 to 2033

Table 17: Latin America Value (US$ Million) Forecast by Country, 2018 to 2033

Table 18: Latin America Volume (Tonnes) Forecast by Country, 2018 to 2033

Table 19: Latin America Value (US$ Million) Forecast by Material, 2018 to 2033

Table 20: Latin America Volume (Tonnes) Forecast by Material, 2018 to 2033

Table 21: Latin America Value (US$ Million) Forecast by Packaging Formats, 2018 to 2033

Table 22: Latin America Volume (Tonnes) Forecast by Packaging Formats, 2018 to 2033

Table 23: Latin America Value (US$ Million) Forecast by End Use, 2018 to 2033

Table 24: Latin America Volume (Tonnes) Forecast by End Use, 2018 to 2033

Table 25: Europe Value (US$ Million) Forecast by Country, 2018 to 2033

Table 26: Europe Volume (Tonnes) Forecast by Country, 2018 to 2033

Table 27: Europe Value (US$ Million) Forecast by Material, 2018 to 2033

Table 28: Europe Volume (Tonnes) Forecast by Material, 2018 to 2033

Table 29: Europe Value (US$ Million) Forecast by Packaging Formats, 2018 to 2033

Table 30: Europe Volume (Tonnes) Forecast by Packaging Formats, 2018 to 2033

Table 31: Europe Value (US$ Million) Forecast by End Use, 2018 to 2033

Table 32: Europe Volume (Tonnes) Forecast by End Use, 2018 to 2033

Table 33: East Asia Value (US$ Million) Forecast by Country, 2018 to 2033

Table 34: East Asia Volume (Tonnes) Forecast by Country, 2018 to 2033

Table 35: East Asia Value (US$ Million) Forecast by Material, 2018 to 2033

Table 36: East Asia Volume (Tonnes) Forecast by Material, 2018 to 2033

Table 37: East Asia Value (US$ Million) Forecast by Packaging Formats, 2018 to 2033

Table 38: East Asia Volume (Tonnes) Forecast by Packaging Formats, 2018 to 2033

Table 39: East Asia Value (US$ Million) Forecast by End Use, 2018 to 2033

Table 40: East Asia Volume (Tonnes) Forecast by End Use, 2018 to 2033

Table 41: South Asia Value (US$ Million) Forecast by Country, 2018 to 2033

Table 42: South Asia Volume (Tonnes) Forecast by Country, 2018 to 2033

Table 43: South Asia Value (US$ Million) Forecast by Material, 2018 to 2033

Table 44: South Asia Volume (Tonnes) Forecast by Material, 2018 to 2033

Table 45: South Asia Value (US$ Million) Forecast by Packaging Formats, 2018 to 2033

Table 46: South Asia Volume (Tonnes) Forecast by Packaging Formats, 2018 to 2033

Table 47: South Asia Value (US$ Million) Forecast by End Use, 2018 to 2033

Table 48: South Asia Volume (Tonnes) Forecast by End Use, 2018 to 2033

Table 49: Oceania Value (US$ Million) Forecast by Country, 2018 to 2033

Table 50: Oceania Volume (Tonnes) Forecast by Country, 2018 to 2033

Table 51: Oceania Value (US$ Million) Forecast by Material, 2018 to 2033

Table 52: Oceania Volume (Tonnes) Forecast by Material, 2018 to 2033

Table 53: Oceania Value (US$ Million) Forecast by Packaging Formats, 2018 to 2033

Table 54: Oceania Volume (Tonnes) Forecast by Packaging Formats, 2018 to 2033

Table 55: Oceania Value (US$ Million) Forecast by End Use, 2018 to 2033

Table 56: Oceania Volume (Tonnes) Forecast by End Use, 2018 to 2033

Table 57: MEA Value (US$ Million) Forecast by Country, 2018 to 2033

Table 58: MEA Volume (Tonnes) Forecast by Country, 2018 to 2033

Table 59: MEA Value (US$ Million) Forecast by Material, 2018 to 2033

Table 60: MEA Volume (Tonnes) Forecast by Material, 2018 to 2033

Table 61: MEA Value (US$ Million) Forecast by Packaging Formats, 2018 to 2033

Table 62: MEA Volume (Tonnes) Forecast by Packaging Formats, 2018 to 2033

Table 63: MEA Value (US$ Million) Forecast by End Use, 2018 to 2033

Table 64: MEA Volume (Tonnes) Forecast by End Use, 2018 to 2033

List of Charts

Figure 1: Global Value (US$ Million) by Material, 2023 to 2033

Figure 2: Global Value (US$ Million) by Packaging Formats, 2023 to 2033

Figure 3: Global Value (US$ Million) by End Use, 2023 to 2033

Figure 4: Global Value (US$ Million) by Region, 2023 to 2033

Figure 5: Global Value (US$ Million) Analysis by Region, 2018 to 2033

Figure 6: Global Volume (Tonnes) Analysis by Region, 2018 to 2033

Figure 7: Global Value Share (%) and BPS Analysis by Region, 2023 to 2033

Figure 8: Global Y-o-Y Growth (%) Projections by Region, 2023 to 2033

Figure 9: Global Value (US$ Million) Analysis by Material, 2018 to 2033

Figure 10: Global Volume (Tonnes) Analysis by Material, 2018 to 2033

Figure 11: Global Value Share (%) and BPS Analysis by Material, 2023 to 2033

Figure 12: Global Y-o-Y Growth (%) Projections by Material, 2023 to 2033

Figure 13: Global Value (US$ Million) Analysis by Packaging Formats, 2018 to 2033

Figure 14: Global Volume (Tonnes) Analysis by Packaging Formats, 2018 to 2033

Figure 15: Global Value Share (%) and BPS Analysis by Packaging Formats, 2023 to 2033

Figure 16: Global Y-o-Y Growth (%) Projections by Packaging Formats, 2023 to 2033

Figure 17: Global Value (US$ Million) Analysis by End Use, 2018 to 2033

Figure 18: Global Volume (Tonnes) Analysis by End Use, 2018 to 2033

Figure 19: Global Value Share (%) and BPS Analysis by End Use, 2023 to 2033

Figure 20: Global Y-o-Y Growth (%) Projections by End Use, 2023 to 2033

Figure 21: Global Attractiveness by Material, 2023 to 2033

Figure 22: Global Attractiveness by Packaging Formats, 2023 to 2033

Figure 23: Global Attractiveness by End Use, 2023 to 2033

Figure 24: Global Attractiveness by Region, 2023 to 2033

Figure 25: North America Value (US$ Million) by Material, 2023 to 2033

Figure 26: North America Value (US$ Million) by Packaging Formats, 2023 to 2033

Figure 27: North America Value (US$ Million) by End Use, 2023 to 2033

Figure 28: North America Value (US$ Million) by Country, 2023 to 2033

Figure 29: North America Value (US$ Million) Analysis by Country, 2018 to 2033

Figure 30: North America Volume (Tonnes) Analysis by Country, 2018 to 2033

Figure 31: North America Value Share (%) and BPS Analysis by Country, 2023 to 2033

Figure 32: North America Y-o-Y Growth (%) Projections by Country, 2023 to 2033

Figure 33: North America Value (US$ Million) Analysis by Material, 2018 to 2033

Figure 34: North America Volume (Tonnes) Analysis by Material, 2018 to 2033

Figure 35: North America Value Share (%) and BPS Analysis by Material, 2023 to 2033

Figure 36: North America Y-o-Y Growth (%) Projections by Material, 2023 to 2033

Figure 37: North America Value (US$ Million) Analysis by Packaging Formats, 2018 to 2033

Figure 38: North America Volume (Tonnes) Analysis by Packaging Formats, 2018 to 2033

Figure 39: North America Value Share (%) and BPS Analysis by Packaging Formats, 2023 to 2033

Figure 40: North America Y-o-Y Growth (%) Projections by Packaging Formats, 2023 to 2033

Figure 41: North America Value (US$ Million) Analysis by End Use, 2018 to 2033

Figure 42: North America Volume (Tonnes) Analysis by End Use, 2018 to 2033

Figure 43: North America Value Share (%) and BPS Analysis by End Use, 2023 to 2033

Figure 44: North America Y-o-Y Growth (%) Projections by End Use, 2023 to 2033

Figure 45: North America Attractiveness by Material, 2023 to 2033

Figure 46: North America Attractiveness by Packaging Formats, 2023 to 2033

Figure 47: North America Attractiveness by End Use, 2023 to 2033

Figure 48: North America Attractiveness by Country, 2023 to 2033

Figure 49: Latin America Value (US$ Million) by Material, 2023 to 2033

Figure 50: Latin America Value (US$ Million) by Packaging Formats, 2023 to 2033

Figure 51: Latin America Value (US$ Million) by End Use, 2023 to 2033

Figure 52: Latin America Value (US$ Million) by Country, 2023 to 2033

Figure 53: Latin America Value (US$ Million) Analysis by Country, 2018 to 2033

Figure 54: Latin America Volume (Tonnes) Analysis by Country, 2018 to 2033

Figure 55: Latin America Value Share (%) and BPS Analysis by Country, 2023 to 2033

Figure 56: Latin America Y-o-Y Growth (%) Projections by Country, 2023 to 2033

Figure 57: Latin America Value (US$ Million) Analysis by Material, 2018 to 2033

Figure 58: Latin America Volume (Tonnes) Analysis by Material, 2018 to 2033

Figure 59: Latin America Value Share (%) and BPS Analysis by Material, 2023 to 2033

Figure 60: Latin America Y-o-Y Growth (%) Projections by Material, 2023 to 2033

Figure 61: Latin America Value (US$ Million) Analysis by Packaging Formats, 2018 to 2033

Figure 62: Latin America Volume (Tonnes) Analysis by Packaging Formats, 2018 to 2033

Figure 63: Latin America Value Share (%) and BPS Analysis by Packaging Formats, 2023 to 2033

Figure 64: Latin America Y-o-Y Growth (%) Projections by Packaging Formats, 2023 to 2033

Figure 65: Latin America Value (US$ Million) Analysis by End Use, 2018 to 2033

Figure 66: Latin America Volume (Tonnes) Analysis by End Use, 2018 to 2033

Figure 67: Latin America Value Share (%) and BPS Analysis by End Use, 2023 to 2033

Figure 68: Latin America Y-o-Y Growth (%) Projections by End Use, 2023 to 2033

Figure 69: Latin America Attractiveness by Material, 2023 to 2033

Figure 70: Latin America Attractiveness by Packaging Formats, 2023 to 2033

Figure 71: Latin America Attractiveness by End Use, 2023 to 2033

Figure 72: Latin America Attractiveness by Country, 2023 to 2033

Figure 73: Europe Value (US$ Million) by Material, 2023 to 2033

Figure 74: Europe Value (US$ Million) by Packaging Formats, 2023 to 2033

Figure 75: Europe Value (US$ Million) by End Use, 2023 to 2033

Figure 76: Europe Value (US$ Million) by Country, 2023 to 2033

Figure 77: Europe Value (US$ Million) Analysis by Country, 2018 to 2033

Figure 78: Europe Volume (Tonnes) Analysis by Country, 2018 to 2033

Figure 79: Europe Value Share (%) and BPS Analysis by Country, 2023 to 2033

Figure 80: Europe Y-o-Y Growth (%) Projections by Country, 2023 to 2033

Figure 81: Europe Value (US$ Million) Analysis by Material, 2018 to 2033

Figure 82: Europe Volume (Tonnes) Analysis by Material, 2018 to 2033

Figure 83: Europe Value Share (%) and BPS Analysis by Material, 2023 to 2033

Figure 84: Europe Y-o-Y Growth (%) Projections by Material, 2023 to 2033

Figure 85: Europe Value (US$ Million) Analysis by Packaging Formats, 2018 to 2033

Figure 86: Europe Volume (Tonnes) Analysis by Packaging Formats, 2018 to 2033

Figure 87: Europe Value Share (%) and BPS Analysis by Packaging Formats, 2023 to 2033

Figure 88: Europe Y-o-Y Growth (%) Projections by Packaging Formats, 2023 to 2033

Figure 89: Europe Value (US$ Million) Analysis by End Use, 2018 to 2033

Figure 90: Europe Volume (Tonnes) Analysis by End Use, 2018 to 2033

Figure 91: Europe Value Share (%) and BPS Analysis by End Use, 2023 to 2033

Figure 92: Europe Y-o-Y Growth (%) Projections by End Use, 2023 to 2033

Figure 93: Europe Attractiveness by Material, 2023 to 2033

Figure 94: Europe Attractiveness by Packaging Formats, 2023 to 2033

Figure 95: Europe Attractiveness by End Use, 2023 to 2033

Figure 96: Europe Attractiveness by Country, 2023 to 2033

Figure 97: East Asia Value (US$ Million) by Material, 2023 to 2033

Figure 98: East Asia Value (US$ Million) by Packaging Formats, 2023 to 2033

Figure 99: East Asia Value (US$ Million) by End Use, 2023 to 2033

Figure 100: East Asia Value (US$ Million) by Country, 2023 to 2033

Figure 101: East Asia Value (US$ Million) Analysis by Country, 2018 to 2033

Figure 102: East Asia Volume (Tonnes) Analysis by Country, 2018 to 2033

Figure 103: East Asia Value Share (%) and BPS Analysis by Country, 2023 to 2033

Figure 104: East Asia Y-o-Y Growth (%) Projections by Country, 2023 to 2033

Figure 105: East Asia Value (US$ Million) Analysis by Material, 2018 to 2033

Figure 106: East Asia Volume (Tonnes) Analysis by Material, 2018 to 2033

Figure 107: East Asia Value Share (%) and BPS Analysis by Material, 2023 to 2033

Figure 108: East Asia Y-o-Y Growth (%) Projections by Material, 2023 to 2033

Figure 109: East Asia Value (US$ Million) Analysis by Packaging Formats, 2018 to 2033

Figure 110: East Asia Volume (Tonnes) Analysis by Packaging Formats, 2018 to 2033

Figure 111: East Asia Value Share (%) and BPS Analysis by Packaging Formats, 2023 to 2033

Figure 112: East Asia Y-o-Y Growth (%) Projections by Packaging Formats, 2023 to 2033

Figure 113: East Asia Value (US$ Million) Analysis by End Use, 2018 to 2033

Figure 114: East Asia Volume (Tonnes) Analysis by End Use, 2018 to 2033

Figure 115: East Asia Value Share (%) and BPS Analysis by End Use, 2023 to 2033

Figure 116: East Asia Y-o-Y Growth (%) Projections by End Use, 2023 to 2033

Figure 117: East Asia Attractiveness by Material, 2023 to 2033

Figure 118: East Asia Attractiveness by Packaging Formats, 2023 to 2033

Figure 119: East Asia Attractiveness by End Use, 2023 to 2033

Figure 120: East Asia Attractiveness by Country, 2023 to 2033

Figure 121: South Asia Value (US$ Million) by Material, 2023 to 2033

Figure 122: South Asia Value (US$ Million) by Packaging Formats, 2023 to 2033

Figure 123: South Asia Value (US$ Million) by End Use, 2023 to 2033

Figure 124: South Asia Value (US$ Million) by Country, 2023 to 2033

Figure 125: South Asia Value (US$ Million) Analysis by Country, 2018 to 2033

Figure 126: South Asia Volume (Tonnes) Analysis by Country, 2018 to 2033

Figure 127: South Asia Value Share (%) and BPS Analysis by Country, 2023 to 2033

Figure 128: South Asia Y-o-Y Growth (%) Projections by Country, 2023 to 2033

Figure 129: South Asia Value (US$ Million) Analysis by Material, 2018 to 2033

Figure 130: South Asia Volume (Tonnes) Analysis by Material, 2018 to 2033

Figure 131: South Asia Value Share (%) and BPS Analysis by Material, 2023 to 2033

Figure 132: South Asia Y-o-Y Growth (%) Projections by Material, 2023 to 2033

Figure 133: South Asia Value (US$ Million) Analysis by Packaging Formats, 2018 to 2033

Figure 134: South Asia Volume (Tonnes) Analysis by Packaging Formats, 2018 to 2033

Figure 135: South Asia Value Share (%) and BPS Analysis by Packaging Formats, 2023 to 2033

Figure 136: South Asia Y-o-Y Growth (%) Projections by Packaging Formats, 2023 to 2033

Figure 137: South Asia Value (US$ Million) Analysis by End Use, 2018 to 2033

Figure 138: South Asia Volume (Tonnes) Analysis by End Use, 2018 to 2033

Figure 139: South Asia Value Share (%) and BPS Analysis by End Use, 2023 to 2033

Figure 140: South Asia Y-o-Y Growth (%) Projections by End Use, 2023 to 2033

Figure 141: South Asia Attractiveness by Material, 2023 to 2033

Figure 142: South Asia Attractiveness by Packaging Formats, 2023 to 2033

Figure 143: South Asia Attractiveness by End Use, 2023 to 2033

Figure 144: South Asia Attractiveness by Country, 2023 to 2033

Figure 145: Oceania Value (US$ Million) by Material, 2023 to 2033

Figure 146: Oceania Value (US$ Million) by Packaging Formats, 2023 to 2033

Figure 147: Oceania Value (US$ Million) by End Use, 2023 to 2033

Figure 148: Oceania Value (US$ Million) by Country, 2023 to 2033

Figure 149: Oceania Value (US$ Million) Analysis by Country, 2018 to 2033

Figure 150: Oceania Volume (Tonnes) Analysis by Country, 2018 to 2033

Figure 151: Oceania Value Share (%) and BPS Analysis by Country, 2023 to 2033

Figure 152: Oceania Y-o-Y Growth (%) Projections by Country, 2023 to 2033

Figure 153: Oceania Value (US$ Million) Analysis by Material, 2018 to 2033

Figure 154: Oceania Volume (Tonnes) Analysis by Material, 2018 to 2033

Figure 155: Oceania Value Share (%) and BPS Analysis by Material, 2023 to 2033

Figure 156: Oceania Y-o-Y Growth (%) Projections by Material, 2023 to 2033

Figure 157: Oceania Value (US$ Million) Analysis by Packaging Formats, 2018 to 2033

Figure 158: Oceania Volume (Tonnes) Analysis by Packaging Formats, 2018 to 2033

Figure 159: Oceania Value Share (%) and BPS Analysis by Packaging Formats, 2023 to 2033

Figure 160: Oceania Y-o-Y Growth (%) Projections by Packaging Formats, 2023 to 2033

Figure 161: Oceania Value (US$ Million) Analysis by End Use, 2018 to 2033

Figure 162: Oceania Volume (Tonnes) Analysis by End Use, 2018 to 2033

Figure 163: Oceania Value Share (%) and BPS Analysis by End Use, 2023 to 2033

Figure 164: Oceania Y-o-Y Growth (%) Projections by End Use, 2023 to 2033

Figure 165: Oceania Attractiveness by Material, 2023 to 2033

Figure 166: Oceania Attractiveness by Packaging Formats, 2023 to 2033

Figure 167: Oceania Attractiveness by End Use, 2023 to 2033

Figure 168: Oceania Attractiveness by Country, 2023 to 2033

Figure 169: MEA Value (US$ Million) by Material, 2023 to 2033

Figure 170: MEA Value (US$ Million) by Packaging Formats, 2023 to 2033

Figure 171: MEA Value (US$ Million) by End Use, 2023 to 2033

Figure 172: MEA Value (US$ Million) by Country, 2023 to 2033

Figure 173: MEA Value (US$ Million) Analysis by Country, 2018 to 2033

Figure 174: MEA Volume (Tonnes) Analysis by Country, 2018 to 2033

Figure 175: MEA Value Share (%) and BPS Analysis by Country, 2023 to 2033

Figure 176: MEA Y-o-Y Growth (%) Projections by Country, 2023 to 2033

Figure 177: MEA Value (US$ Million) Analysis by Material, 2018 to 2033

Figure 178: MEA Volume (Tonnes) Analysis by Material, 2018 to 2033

Figure 179: MEA Value Share (%) and BPS Analysis by Material, 2023 to 2033

Figure 180: MEA Y-o-Y Growth (%) Projections by Material, 2023 to 2033

Figure 181: MEA Value (US$ Million) Analysis by Packaging Formats, 2018 to 2033

Figure 182: MEA Volume (Tonnes) Analysis by Packaging Formats, 2018 to 2033

Figure 183: MEA Value Share (%) and BPS Analysis by Packaging Formats, 2023 to 2033

Figure 184: MEA Y-o-Y Growth (%) Projections by Packaging Formats, 2023 to 2033

Figure 185: MEA Value (US$ Million) Analysis by End Use, 2018 to 2033

Figure 186: MEA Volume (Tonnes) Analysis by End Use, 2018 to 2033

Figure 187: MEA Value Share (%) and BPS Analysis by End Use, 2023 to 2033

Figure 188: MEA Y-o-Y Growth (%) Projections by End Use, 2023 to 2033

Figure 189: MEA Attractiveness by Material, 2023 to 2033

Figure 190: MEA Attractiveness by Packaging Formats, 2023 to 2033

Figure 191: MEA Attractiveness by End Use, 2023 to 2033

Figure 192: MEA Attractiveness by Country, 2023 to 2033

Recommendations

Packaging

Beverage Packaging Market

Published : October 2023

Explore Packaging Insights

View Reports

Hemp-based Packaging Market