
- Market Size (2026)
- USD 702.4 Mn
- Forecast (2036)
- USD 1101.3 Mn
- CAGR (2026 to 2036)
- 4.6%
How big is Heparin Market in 2026?
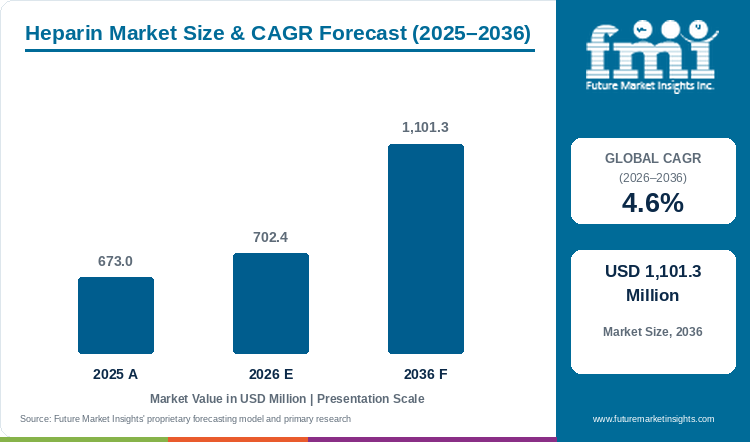
The heparin market demonstrated steady progress from USD 673.0 million in 2025 to USD 702.4 million in 2026, building toward a targeted valuation of USD 1,101.3 million by 2036 at a CAGR of 4.6%.
The global heparin market was valued at USD 673.0 million in 2025 and is estimated to reach USD 702.4 million in 2026. The market is projected by FMI to reach USD 1,101.3 million by 2036, expanding at a compound annual growth rate (CAGR) of 4.6% between 2026 and 2036. Low molecular weight heparins command 46.3% of 2026 demand because weight-calibrated enoxaparin and dalteparin regimens allow hospitals to discharge post-operative patients earlier without daily activated partial thromboplastin time assays. Demand for parenteral anticoagulants is governed by surgical turnover and extracorporeal circuit replenishment, since every total hip arthroplasty and thrice-weekly hemodialysis session requires scheduled antithrombin III activation that oral factor Xa tablets cannot safely replace in renally impaired patients [1]. This inpatient replenishment cadence distinguishes the category from direct oral anticoagulants, as hospital buyers contract injectable heparin volumes around operating-room schedules and intensive-care admissions [2]. Generic sterile-injectable manufacturers are expanding vertically integrated fill-finish capacity to secure hospital tender contracts, with Sandoz advancing its European sterile injectable and biosimilar network in February 2026 to stabilize hospital pharmacy supply [3]. Hospital pharmacy committees renew multi-year supply agreements on verified porcine mucosa batch traceability and anti-factor Xa potency consistency, whereas crude heparin feedstock price swings restrain spot-market margin expansion through 2036.
Key Market Trends & Insights
- By molecular weight: Low Molecular Weight Heparins (LMWH) hold an estimated 46.3% share in 2026 because predictable subcutaneous bioavailability eliminates routine laboratory coagulation monitoring.
- By delivery format: Prefilled Subcutaneous Safety Syringes represent 66.7% in 2026 as hospital nursing protocols mandate single-dose needle-shielded injectors to prevent dosing errors.
- By clinical indication: Venous Thromboembolism (VTE) Prophylaxis and Treatment account for 53.7% in 2026 due to mandatory post-operative thromboprophylaxis across orthopedic and abdominal surgeries.
- By source origin: Porcine Intestinal Mucosa secures 78.4% in 2026 owing to established United States Pharmacopeia and European Pharmacopoeia potency benchmarks.
- By end-user facility: Hospital Inpatient and Surgical Wards command 61.2% in 2026 through acute-care admission protocols and perioperative anticoagulation bundles.
Regional Highlights
- Top national expansion: The United States leads national growth projections at a 5.2% CAGR through 2036 under rising inpatient orthopedic procedures and safety-syringe conversion.
- Broader country progression: South Korea tracks at a 5.1% CAGR ahead of Saudi Arabia at 5.0% and Switzerland at 4.8%, while Australia advances at a 4.6% CAGR and Germany records a 4.2% CAGR.
Market Size & Forecast
Table 1: Market Size and Forecast for the Heparin Market (USD million and CAGR percentage), 2025 to 2036
| Metric | Value |
|---|---|
| 2025 Market Size | USD 673.0 million |
| Estimated Market Size in 2026 | USD 702.4 million |
| Projected Market Size by 2036 | USD 1,101.3 million |
| CAGR, 2026 to 2036 | 4.6% |
| Added Value, 2026 to 2036 | USD 398.9 million |
Hospital anticoagulation committees face persistent clinical friction when uncalibrated unfractionated heparin infusions cause sub-therapeutic clotting or severe postoperative hemorrhage. When acute-care wards rely on manual vial drawing, nursing preparation time rises and activated partial thromboplastin time values fluctuate outside target therapeutic windows. In August 2026, clinical investigators reporting in The Annals of Pharmacotherapy evaluated early unfractionated heparin response in acute venous thromboembolism patients, confirming that delayed therapeutic anticoagulation increases inpatient thrombus progression [4]. Consequently, hospital formulary directors pair weight-calibrated enoxaparin prefilled syringes with thromboprophylactic drugs protocols to standardize inpatient prophylaxis across surgical departments.
Active-Dosage and Porcine Mucosa Feedstock Sizing
Table 2: Active-Dosage and Crude Feedstock Sizing for the Heparin Market (USD million and operational ranges), 2025 to 2036
| Metric | 2025 | 2026 | 2036 |
|---|---|---|---|
| Market size (USD million) | 673.0 | 702.4 | 1,101.3 |
| Formulated heparin and LMWH doses (million units) | 1,180.0 to 1,260.0 | 1,230.0 to 1,315.0 | 1,890.0 to 2,020.0 |
| Refined active heparin sodium API (metric tons) | 195.0 to 212.0 | 204.0 to 222.0 | 312.0 to 340.0 |
| Average hospital acquisition cost per prefilled dose (USD) | 0.52 to 0.58 | 0.53 to 0.59 | 0.54 to 0.61 |
Operational note: Dosing ranges reflect standard 40 mg once-daily subcutaneous enoxaparin prophylaxis and 5,000 IU unfractionated heparin vials across hospital surgical and dialysis wards.
Cardiopulmonary bypass circuits and outpatient hemodialysis machines require immediate antithrombin III activation that can be reversed within minutes using protamine sulfate. Sterile fill-finish manufacturers supply barcoded unit-dose polymer-based prefilled syringes that eliminate cross-contamination risks in high-turnover dialysis clinics.
Per Capita & Hospital Anticoagulation Protocol Sizing
Table 3: Per Capita and Hospital Ward Indicators for the Heparin Market (USD), 2025 to 2036
| Metric | 2025 | 2026 | 2036 |
|---|---|---|---|
| Global population (billion) | 8.2 | 8.3 | 9.0 |
| Market value per 1,000 people (USD) | 82.1 | 84.6 | 122.4 |
| Annual procurement per acute-care hospital (USD thousand) | 18.4 to 21.2 | 19.2 to 22.1 | 29.5 to 34.0 |
| Prefilled safety syringe format share (%) | 65.2% to 66.2% | 66.2% to 67.2% | 73.5% to 75.5% |
Table 4: Hospital Inpatient & Channel Indicators for the Heparin Market (USD million and percentages), 2026
| Metric | Value | Institutional Reference Basis |
|---|---|---|
| Market size, 2026 | USD 702.4 million | 2026 global valuation baseline |
| Acute-care hospitals and dialysis centers globally | 34,500 facilities | Inpatient surgical wards and chronic renal units |
| Average annual valuation per facility | USD 20,359.4 | Annualized hospital anticoagulant procurement |
| Hospital Inpatient and Surgical Wards valuation, 2026 | USD 429.9 million | 61.2% end-user facility allocation |
Mitigation of heparin-induced thrombocytopenia risk requires strict molecular-weight fractionation during enzymatic or chemical depolymerization of crude mucosal heparin. Pharmaceutical processors integrate automated chromogenic anti-Xa assays with prefilled syringes drug molecules lines so each batch meets narrow pharmacopeial molecular-weight distribution limits.
Analyst Perspective
"Hospital pharmacy buyers no longer treat heparin as an interchangeable commodity injectable. They contract for guaranteed porcine mucosa traceability and needle-shielded prefilled syringes that cut nursing administration time. Manufacturers that pair captive crude-heparin purification with high-speed safety-syringe fill-finish lines will secure multi-year group purchasing organization tenders through 2036."
- Anurag Sharma, Principal Consultant, Future Market Insights.
How is the heparin market segmented?
The heparin market is segmented by molecular weight and delivery format with clinical indication, source origin, and end-user facility. In 2026, Low Molecular Weight Heparins (LMWH) are projected at 46.3% and Prefilled Subcutaneous Safety Syringes at 66.7%. Venous Thromboembolism (VTE) Prophylaxis and Treatment stands at 53.7%, while Porcine Intestinal Mucosa reaches 78.4% and Hospital Inpatient and Surgical Wards command 61.2%.
By molecular weight: Low Molecular Weight Heparins (LMWH), Depolymerized Low Molecular Weight Heparins (Enoxaparin and Dalteparin) and Unfractionated Heparin (Bovine and Porcine) with Synthetic Pentasaccharide Fondaparinux.
By delivery format: Prefilled Subcutaneous Safety Syringes and Intravenous Multi-Dose Vials for Infusion.
By clinical indication: Venous Thromboembolism (VTE) Prophylaxis and Treatment and Acute Coronary Syndromes (NSTEMI and STEMI) with Anticoagulation During Cardiopulmonary Bypass and Hemodialysis.
By source origin: Porcine Intestinal Mucosa and Bovine Lung and Intestinal Mucosa with Synthetic Ultra-Low Molecular Weight.
By end-user facility: Hospital Inpatient and Surgical Wards and Outpatient Dialysis Centers with Ambulatory Surgical and Specialty Clinics.
Why do Low Molecular Weight Heparins lead the molecular weight category?
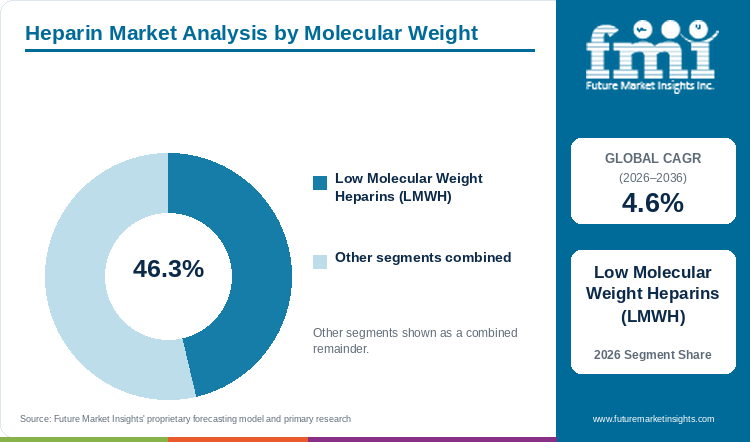
Low Molecular Weight Heparins hold an estimated 46.3% of molecular weight demand in 2026, anchored by predictable subcutaneous bioavailability and reduced osteoporosis and thrombocytopenia risk.
Table 5: Molecular Weight Share for the Heparin Market (percentage share), 2026
| Molecular Weight | Share (2026) |
|---|---|
| Low Molecular Weight Heparins (LMWH) | 46.3% |
| Other Segments Combined | 53.7%* |
| Total | 100.0% |
Note on segment balance: Unfractionated heparin and synthetic pentasaccharide fondaparinux account for the balance of 2026 global heparin market demand.
Table 6: Molecular Weight Leadership and Market Growth for the Heparin Market (segment and CAGR percentage), 2026 to 2036
| Metric | Value |
|---|---|
| Global CAGR (2026 to 2036) | 4.6% |
| Leading Segment | Low Molecular Weight Heparins (LMWH) |
Hospital surgical departments favor depolymerized enoxaparin and dalteparin chains averaging 4,500 Daltons because higher anti-factor Xa to anti-factor IIa ratios prevent deep vein thrombosis without continuous intravenous titration. Outpatient orthopedic and oncology networks coordinating venous thromboembolism treatment pathways standardize on low molecular weight formulations so patients can complete 14-day to 28-day post-discharge prophylaxis at home.
- Low Molecular Weight Heparins hold 46.3% of molecular weight valuation in 2026 because fixed-dose subcutaneous regimens eliminate routine inpatient coagulation assays.
- In October 2025, a systematic review in Cureus analyzing 1,167 hip and knee arthroplasty patients confirmed that enoxaparin and dalteparin achieve comparably low postoperative venous thromboembolism rates with predictable bleeding profiles [5].
What sustains Prefilled Subcutaneous Safety Syringes leadership in delivery format?
Prefilled Subcutaneous Safety Syringes represent 66.7% of the delivery format category in 2026, supported by occupational needlestick legislation and unit-dose barcode verification.
Hospital nursing directors replace multi-dose glass vials with pre-calibrated 30 mg and 40 mg or 60 mg single-use glass and cyclic olefin polymer syringes equipped with passive needle guards. Adoption of ready-to-administer syringes from retractable needle safety syringes suppliers eliminates manual dilution errors and benzyl alcohol preservative exposure across neonatal and surgical intensive-care units.
- Prefilled Subcutaneous Safety Syringes represent 66.7% of the delivery format segment in 2026 as acute-care hospitals enforce zero-needlestick nursing standards.
- In September 2026, neurosurgical investigators reporting in Neurosurgery demonstrated that standardized subcutaneous heparin prophylaxis protocols maintain low hemorrhagic risk across acute neurocritical care cohorts [6].
How does Venous Thromboembolism Prophylaxis and Treatment lead clinical indications?
Venous Thromboembolism Prophylaxis and Treatment account for 53.7% of clinical indication demand in 2026, driven by mandatory hospital VTE risk-scoring bundles.
Accredited hospitals enforce admission Caprini and Padua thrombosis risk assessments that trigger automatic orders for subcutaneous heparin or enoxaparin within 24 hours of orthopedic or trauma admission. Clinical quality committees managing hypercoagulability treatment programs rely on parenteral heparins for immobilized medical and cancer inpatients who cannot tolerate oral anticoagulants due to emesis or renal insufficiency.
- Venous Thromboembolism Prophylaxis and Treatment account for 53.7% of clinical indication demand in 2026 because inpatient surgical and trauma admissions mandate immediate parenteral thromboprophylaxis.
- In August 2026, a three-arm randomized clinical trial in Obesity Surgery demonstrated that extended enoxaparin prophylaxis regimens effectively prevent post-discharge venous thromboembolism following bariatric bypass procedures [7].
Why does Porcine Intestinal Mucosa lead the source origin category?
Porcine Intestinal Mucosa secures 78.4% of source origin valuation in 2026, supported by higher specific anti-Xa activity and Harmonized Pharmacopoeia monographs.
Porcine mucosal heparin delivers roughly 180 to 200 IU per milligram of purified active pharmaceutical ingredient, requiring lower gravimetric dosing than bovine mucosal or lung derivatives to reach identical activated clotting times. While regulatory agencies evaluate bovine re-introduction for supply diversification, commercial LMWH manufacturers anchor their DMF filings around porcine mucosa to preserve bioequivalence with reference enoxaparin.
- Porcine Intestinal Mucosa secures 78.4% of source origin demand in 2026 as global LMWH biosimilar approvals require strict structural parity with porcine-derived reference standards.
- In July 2026, thrombosis researchers publishing in the official ISTH journal completed a comparative immunogenic risk assessment of porcine and ruminant heparins to establish quality benchmarks for global mucosal supply [8].
What gives Hospital Inpatient and Surgical Wards the leading position in end-user facilities?
Hospital Inpatient and Surgical Wards command 61.2% of end-user facility share in 2026, anchored by perioperative cardiac and orthopedic admissions.
High-dose unfractionated heparin boluses during coronary intervention and cardiopulmonary bypass, combined with ward-wide post-operative LMWH prophylaxis, concentrate purchasing volume inside acute-care hospital pharmacies. Group purchasing organizations negotiate multi-tier bundled contracts covering both multi-dose operating-room vials and ward-stock prefilled syringes.
- Hospital Inpatient and Surgical Wards command 61.2% of end-user facility valuation in 2026 because cardiopulmonary bypass and percutaneous coronary intervention require inpatient infusion control.
- In March 2026, a clinical comparison in Cureus evaluating 73 acute coronary syndrome inpatients reported 3.3% mortality in the enoxaparin cohort versus 30.8% in the unfractionated heparin group, reinforcing inpatient LMWH adoption [9].
What are the drivers and restraints as well as opportunities in the heparin market?
In the heparin market, mandatory hospital venous thromboembolism prophylaxis and expanding chronic hemodialysis populations are projected to drive adoption, whereas heparin-induced thrombocytopenia immune risks restrain unmonitored unfractionated dosing and synthetic pentasaccharide fondaparinux plus bovine mucosal qualification create supply-resilience opportunities.
- Driver: Higher orthopedic arthroplasty and bariatric surgery volumes with chronic renal dialysis sessions require scheduled parenteral anticoagulation across inpatient and outpatient care.
- Restraint: Immune-mediated heparin-induced thrombocytopenia and narrow anti-factor Xa therapeutic windows in renal impairment create severe bleeding and thrombosis management costs.
- Opportunity: Qualification of synthetic pentasaccharide fondaparinux and pharmacopeia-compliant bovine mucosal heparin reduces single-country porcine raw-material dependency.
Growth Analysis and Future Potential for Qualitative Demand Drivers
Larger geriatric surgical cohorts and mandatory hospital quality penalties for preventable postoperative pulmonary embolism compel healthcare systems to maintain high-volume heparin and enoxaparin inventories. When trauma and intensive-care units transition from fixed dosing to weight-calibrated subcutaneous regimens, per-patient syringe consumption rises with target anti-Xa attainment. Standardization of unit-dose prefilled injections across safety syringe hospital programs also reduces nursing preparation bottlenecks on medical-surgical floors. In September 2026, a trauma cohort study in PubMed confirmed that systematic anti-factor Xa monitoring and dose adjustment significantly improve prophylactic target attainment in hospitalized trauma patients [10].
Risk Assessment of the Heparin Market and Operational Friction
Immune-mediated platelet factor 4 antibody formation leading to heparin-induced thrombocytopenia represents the primary clinical restraint limiting prolonged unfractionated heparin exposure. When cardiac surgery or intensive-care patients develop platelet count drops greater than 50%, clinicians must immediately halt all heparin flushes and switch to costly direct thrombin inhibitors. In June 2026, the International Society on Thrombosis and Haemostasis published updated perioperative guidance in the Journal of Thrombosis and Haemostasis detailing complex plasmapheresis and non-heparin bypass protocols required for patients with active heparin-induced thrombocytopenia [11]. Hospital pharmacies managing heparin-induced thrombocytopenia treatment budgets consequently restrict multi-day unfractionated heparin infusions in favor of lower-immunogenicity LMWH or synthetic pentasaccharides.
Commercial Opportunity Analysis for Formulation Differentiation
Pharmaceutical manufacturers capture high-margin hospital contracts by supplying synthetic pentasaccharide fondaparinux and anti-Xa-calibrated pediatric and renal regimens that eliminate animal-virus and PF4-antibody risks. Because fondaparinux is synthesized chemically rather than extracted from animal mucosa, it offers complete insulation from porcine epidemic diarrhea virus supply shocks and religious dietary restrictions. Integration of synthetic factor Xa inhibitors with antiplatelet-anticoagulant combination therapy pathways in acute coronary care further expands formulary adoption. In December 2025, acute-care cardiologists publishing in Clinical Cardiology showed that fondaparinux reduced composite mortality and ischemic events to 20.69% versus 40.00% for enoxaparin in non-ST-segment elevation acute coronary syndrome patients [12].
Heparin Market by Country (2026 to 2036)
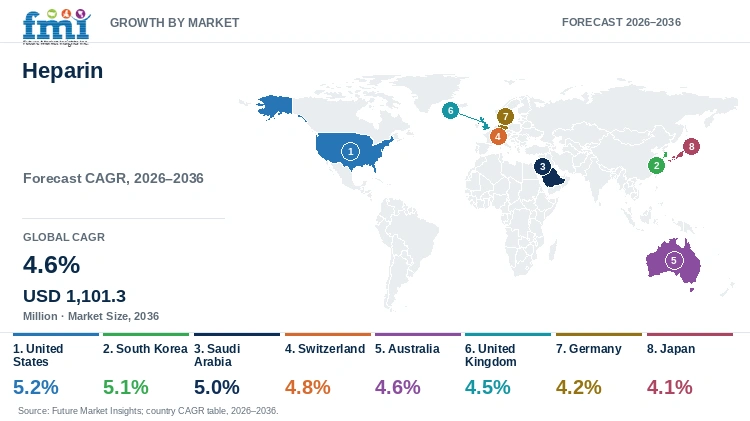
FMI country modeling indicates that the United States leads heparin market expansion at a 5.2% CAGR through 2036, ahead of South Korea at 5.1% and Saudi Arabia at 5.0%. Switzerland follows at 4.8% and Australia tracks at 4.6%, while the United Kingdom records 4.5% ahead of Germany at 4.2% and Japan at 4.1%.
Table 7: Country CAGR and Primary Growth Levers for the Heparin Market (CAGR percentage and operational drivers), 2026 to 2036
| Country | CAGR (2026 to 2036) | Primary Growth Lever |
|---|---|---|
| United States | 5.2% | Mandatory CMS inpatient VTE prophylaxis bundles and FDA-approved generic enoxaparin safety syringes |
| South Korea | 5.1% | Rapidly aging orthopedic surgical cohort and National Health Insurance coverage for LMWH syringes |
| Saudi Arabia | 5.0% | Vision 2030 tertiary hospital expansion and halal-compliant synthetic and bovine anticoagulant adoption |
| Switzerland | 4.8% | High-acuity cardiovascular surgery centers and domestic biosimilar LMWH headquarters in Basel |
| Australia | 4.6% | Pharmaceutical Benefits Scheme outpatient LMWH dispensing and trauma ICU anti-Xa dosing protocols |
| United Kingdom | 4.5% | Mandatory NHS England VTE risk assessment gates and outpatient ambulatory DVT pathways |
| Germany | 4.2% | High inpatient orthopedic and cardiac bypass volumes balanced by strict statutory sickness fund reference pricing |
| Japan | 4.1% | Chronic hemodialysis patient base exceeding 340,000 and low-molecular-weight heparin dialysis circuit locks |
Source: Future Market Insights analysis
United States Heparin Market Outlook (2026 to 2036)
Hospital demand for heparin in the United States is projected to expand at a leading 5.2% CAGR through 2036 as acute-care systems enforce Centers for Medicare and Medicaid Services perioperative thrombosis penalties. Unlike single-payer European markets that rely on centralized national tenders, hospital networks in the United States procure barcode-verified prefilled enoxaparin syringes and USP-grade unfractionated vials through group purchasing organizations to prevent medication errors. In July 2026, cardiothoracic anesthesiologists publishing in the Journal of Cardiothoracic and Vascular Anesthesia outlined updated cardiopulmonary bypass anticoagulation algorithms for surgical centers in the United States [13]. High outpatient hemodialysis volumes and domestic porcine mucosa supply-chain diversification further sustain multi-year hospital pharmacy contracts across the country.
Key takeaway: In the United States, mandatory hospital VTE quality metrics and high cardiopulmonary bypass and dialysis volumes are projected to drive leading 5.2% CAGR growth.
South Korea Heparin Market Outlook (2026 to 2036)
Whereas procurement in the United States is driven by group purchasing bundles, South Korea expands heparin consumption through rapid demographic aging and high per-capita knee and hip arthroplasty rates. South Korean hospital heparin valuation climbs at a 5.1% CAGR during 2026 to 2036 inside tertiary university hospitals and specialty orthopedic clinics. In September 2025, orthopedic investigators reporting in Knee Surgery and Sports Traumatology demonstrated that 14-day regimens of fondaparinux sodium and enoxaparin sodium provide effective postoperative thromboprophylaxis with reduced joint swelling in high-risk knee reconstruction patients [14]. Reimbursement under the National Health Insurance Service for prefilled subcutaneous anticoagulants accelerates hospital conversion away from manual multi-dose vials.
Key takeaway: In South Korea, rising geriatric joint replacement procedures and reimbursed subcutaneous LMWH protocols are forecast to support a 5.1% CAGR through 2036.
Saudi Arabia Heparin Market Outlook (2026 to 2036)
In contrast to East Asian surgical demand, Saudi Arabia shapes its heparin procurement around halal-certified pharmaceutical sourcing and rapid tertiary hospital commissioning under Vision 2030. Saudi Arabian heparin demand advances at a 5.0% CAGR over 2026 through 2036 within Ministry of Health medical cities and private surgical networks in Riyadh and Jeddah. Because porcine-derived biologics face religious scrutiny unless clinically unavoidable, hospital formularies in Saudi Arabia actively qualify synthetic fondaparinux and bovine unfractionated heparin with essential LMWH syringes. In May 2025, a meta-analysis in Archives of Orthopaedic and Trauma Surgery covering 32,534 arthroplasty patients confirmed that fondaparinux lowered venous thromboembolism odds ratios to 0.55 versus LMWHs [15].
Key takeaway: In Saudi Arabia, hospital bed expansion and formulary preference for synthetic pentasaccharides and halal-verified anticoagulants are expected to sustain a 5.0% CAGR.
Switzerland Heparin Market Outlook (2026 to 2036)
Switzerland distinguishes itself within Western Europe through ultra-high per-capita cardiac catheterization density and the domestic presence of global generic and biosimilar headquarters in Basel. Demand for heparin in Switzerland is anticipated to grow at a 4.8% CAGR over the 2026 to 2036 forecast period across cantonal university hospitals and private surgical clinics. In August 2026, Sandoz reported from Basel that strong first-half 2026 biosimilar and hospital injectable momentum supported an upgraded full-year net sales outlook across European hospital channels [16]. Cantonal hospital pharmacies in Zurich and Geneva as well as Bern surgical centers prioritize pre-labeled unit-dose safety syringes and automated anti-factor Xa laboratory integration to minimize intensive-care bleeding complications across complex cardiac admissions.
Key takeaway: In Switzerland, high-acuity cardiovascular procedure density and domestic sterile-injectable supply leadership are anticipated to anchor a 4.8% CAGR.
Australia Heparin Market Outlook (2026 to 2036)
Unlike continental European tender markets, Australia integrates inpatient surgical anticoagulation with broad community dispensing of prefilled enoxaparin syringes under the Pharmaceutical Benefits Scheme. Australian heparin market valuation progresses at a 4.6% CAGR across the 2026 to 2036 window within state public hospital networks and regional renal dialysis units in Sydney and Melbourne. In February 2025, intensive-care investigators publishing in Thrombosis Research demonstrated that anti-factor Xa guided enoxaparin thromboprophylaxis measured in 83% of trauma ICU admissions successfully corrected sub-therapeutic levels found in 40% of patients [17]. Therapeutic Goods Administration batch-release standards and state venous thromboembolism prevention mandates keep prefilled LMWH syringes as the baseline hospital standard nationwide.
Key takeaway: In Australia, Pharmaceutical Benefits Scheme outpatient coverage and anti-Xa-guided trauma ICU protocols are projected to maintain a 4.6% CAGR.
United Kingdom Heparin Market Outlook (2026 to 2036)
Hospital procurement in the United Kingdom is governed by mandatory National Health Service venous thromboembolism risk assessments that link acute trust reimbursement to documented admission prophylaxis. United Kingdom hospital heparin valuation rises at a 4.5% CAGR during 2026 through 2036 across NHS foundation trusts and ambulatory deep-vein thrombosis clinics in London and Manchester. In August 2025, hospital pharmacists reporting in the European Journal of Hospital Pharmacy documented a post-dialysis high-dose enoxaparin regimen maintaining target anti-factor Xa activity of 0.7 to 1.2 IU/mL in heparin-resistant renal patients [18]. NHS Commercial Medicines Unit national framework tenders reward suppliers that guarantee uninterrupted biosimilar enoxaparin prefilled syringe deliveries across regional hospital pharmacies.
Key takeaway: In the United Kingdom, mandatory NHS admission VTE screening and national biosimilar enoxaparin framework tenders are estimated to support a 4.5% CAGR.
Germany Heparin Market Outlook (2026 to 2036)
Whereas the United Kingdom centralizes purchasing through NHS frameworks, Germany combines Europe's largest inpatient surgical and extracorporeal membrane oxygenation base with strict statutory sickness fund reference pricing. German inpatient heparin demand builds at a 4.2% CAGR through 2036 within university heart centers and orthopedic rehabilitation hospitals as well as KfH dialysis clinics. In July 2026, critical-care investigators reporting in PubMed evaluated standard-dose versus low-dose intravenous unfractionated heparin during extracorporeal membrane oxygenation, refining activated partial thromboplastin time targets to curb circuit thrombosis and hemorrhage [19]. High domestic generic competition compresses per-syringe unit prices even as inpatient cardiovascular and joint-replacement surgical case volumes climb steadily across German federal states.
Key takeaway: In Germany, large cardiac and orthopedic inpatient volumes tempered by statutory reference pricing are slated to yield a 4.2% CAGR.
Japan Heparin Market Outlook (2026 to 2036)
Japan diverges from Western markets because chronic maintenance hemodialysis and disseminated intravascular coagulation management represent a larger share of hospital heparin consumption than postoperative orthopedic prophylaxis. Japanese hospital heparin valuation grows at a 4.1% CAGR from 2026 to 2036 inside municipal stroke centers and private nephrology clinics in Tokyo and Osaka. In August 2026, pediatric transplant researchers reporting in Pediatric Transplantation demonstrated that continuous unfractionated heparin infusion protocols effectively prevent early hepatic artery and portal vein thrombosis following living-donor liver transplantation [20]. Biennial National Health Insurance drug price revisions moderate value growth while sustaining steady unit demand for prefilled dialysis circuit anticoagulation syringes across Japanese renal centers.
Key takeaway: In Japan, high chronic hemodialysis session volumes and specialized surgical infusion protocols are predicted to sustain a 4.1% CAGR.
Full report country CAGRs cover: North America; Latin America; Western Europe; Eastern Europe; East Asia; South Asia and Pacific; Middle East and Africa.
Who are the notable companies in the heparin market?
Abbott Laboratories and Thermo Fisher Scientific Inc. with Danaher Corporation and Sandoz Group AG plus Pfizer Inc. lead commercial supply. Additional notable participants in the heparin market include Sanofi SA and Fresenius Kabi AG with LEO Pharma A/S and Hikma Pharmaceuticals PLC plus Amphastar Pharmaceuticals Inc..
Competitive positioning in the heparin market divides into global sterile-injectable and LMWH originators with specialty mucosal purification producers and clinical coagulation diagnostics leaders. Sanofi SA and Pfizer Inc. as well as Fresenius Kabi AG and Sandoz Group AG supply high-volume prefilled enoxaparin and dalteparin syringes plus unfractionated heparin vials to hospital group purchasing organizations. Amphastar Pharmaceuticals Inc. and LEO Pharma A/S as well as Hikma Pharmaceuticals PLC compete across tinzaparin and USP porcine heparin injectables. Meanwhile, Danaher Corporation and Abbott Laboratories plus Thermo Fisher Scientific Inc. supply bedside ACT coagulation analyzers and sterile fill-finish contract manufacturing with chromatographic purification systems.
- Originator and Biosimilar LMWH and Sterile Injectable Leaders: Pfizer Inc. and Sandoz Group AG with Sanofi SA and Fresenius Kabi AG manufacture reference and biosimilar enoxaparin and dalteparin syringes plus multi-dose unfractionated heparin injectables.
- Specialty Heparin and Fondaparinux Critical-Care Formulators: LEO Pharma A/S and Hikma Pharmaceuticals PLC with Amphastar Pharmaceuticals Inc. purify porcine mucosal APIs and formulate prefilled safety syringes for hospital and dialysis tenders.
- Coagulation Diagnostics and Bioprocess Purification Systems: Abbott Laboratories and Thermo Fisher Scientific Inc. with Danaher Corporation provide point-of-care i-STAT ACT cartridges and Patheon sterile syringe fill-finish services with Cytiva ion-exchange chromatography resins.
Competitive Benchmarking for the Heparin Market
Table 8: Competitive Benchmarking for the Heparin Market (qualitative capability ratings), 2026
| Company | Parenteral Anticoagulant & Assay Depth | Sterile Fill-Finish & API Integration | Hospital Tender Reach | Geographic Reach |
|---|---|---|---|---|
| Abbott Laboratories | High | High | High | Global hospital point-of-care i-STAT ACT coagulation testing and vascular care; 14.5% Q3 2026 growth |
| Thermo Fisher Scientific Inc. | Medium | High | High | Global Patheon sterile prefilled syringe CDMO and USP heparin QC mass spectrometry; expanded Uppsala center in March 2026 |
| Danaher Corporation | Medium | High | High | Global Cytiva heparin affinity and ion-exchange purification resins and Radiometer acute-care analyzers |
| Sandoz Group AG | High | High | High | Global pioneer in biosimilar enoxaparin sodium and hospital injectables; strong H1 2026 biosimilar momentum |
| Pfizer Inc. | High | High | High | Global sterile injectable leader supplying Fragmin (dalteparin) and hospital unfractionated heparin vials |
| Sanofi SA | High | High | High | Global originator of Lovenox (enoxaparin sodium) prefilled safety syringes across 100+ countries |
| Fresenius Kabi AG | High | High | High | North American and European leader in Simplist prefilled heparin syringes and IV infusion bags |
| LEO Pharma A/S | High | High | Medium | European and Canadian hospital leader in Innohep (tinzaparin sodium) LMWH thrombosis syringes |
| Hikma Pharmaceuticals PLC | High | High | High | Top United States hospital generic supplier of multi-dose heparin sodium vials and prefilled syringes |
| Amphastar Pharmaceuticals Inc. | High | High | Medium | Vertically integrated United States producer of purified porcine enoxaparin and heparin sodium API |
Evaluation basis: Parenteral Anticoagulant & Assay Depth evaluates approved LMWH/UFH drug master files and bedside coagulation monitoring platforms, whereas Sterile Fill-Finish & API Integration measures captive porcine mucosal purification and automated safety-syringe filling capacity. Hospital Tender Reach assesses multi-year group purchasing organization and national health ministry contract coverage.
Key Developments in the Heparin Market
- Abbott Laboratories reported third-quarter 2026 financial results on October 21, 2026 with reported growth of 14.5% and comparable growth of 7.0%, supported by hospital diagnostics and point-of-care coagulation testing [21].
- Abbott Laboratories announced first-quarter 2026 financial results on April 16, 2026 with 7.5% organic medical device and point-of-care diagnostics expansion supporting bedside activated clotting time monitoring for hospital heparin infusions [22].
- Danaher Corporation reported full-year 2025 results and 2026 core bioprocessing and diagnostics guidance on January 28, 2026, noting demand across bioprocess chromatography resins and hospital critical-care analyzers [23].
Key Players in the Heparin Market
Originator and Biosimilar LMWH and Sterile Injectable Leaders
- Abbott Laboratories
- Thermo Fisher Scientific Inc.
- Danaher Corporation
- Sandoz Group AG
Specialty Heparin and Fondaparinux Critical-Care Formulators
- Pfizer Inc.
- Sanofi SA
- Fresenius Kabi AG
- LEO Pharma A/S
Coagulation Diagnostics and Bioprocess Purification Systems
- Hikma Pharmaceuticals PLC
- Amphastar Pharmaceuticals Inc.
Heparin Market - Report Scope
Table 9: Report Scope for the Heparin Market (coverage fields and definitions), 2026 to 2036
| Coverage field | Report scope |
|---|---|
| Market breakdown | Molecular Weight; Delivery Format; Clinical Indication; Source Origin; End-User Facility |
| Quantitative Units | USD Million |
| Market Definition | Includes commercial supplier valuation from finished parenteral heparin formulations covering Low Molecular Weight Heparins (enoxaparin and dalteparin as well as tinzaparin), Unfractionated Heparin (porcine and bovine), and Synthetic Pentasaccharide (fondaparinux) in prefilled syringes and infusion vials. Category Scope Note: Excludes direct oral anticoagulants, oral vitamin K antagonists, systemic fibrinolytics, and unformulated crude heparin slaughterhouse mucosa. |
| Regions Covered | North America; Latin America; Western Europe; Eastern Europe; East Asia; South Asia and Pacific; Middle East and Africa |
| Countries Covered | United States, South Korea, Saudi Arabia, Switzerland, Australia, United Kingdom, Germany, and Japan |
| Key Companies Covered | Abbott Laboratories, Thermo Fisher Scientific Inc., Danaher Corporation, Sandoz Group AG, Pfizer Inc., Sanofi SA, Fresenius Kabi AG, LEO Pharma A/S, Hikma Pharmaceuticals PLC, and Amphastar Pharmaceuticals Inc. |
| Forecast Period | 2026 to 2036 |
| Approach | Primary and secondary research with top-down and bottom-up market triangulation. |
Heparin Market - Research Methodology
Table 10: Research Methodology for the Heparin Market (research methods and approach), 2026 edition
| Method | Approach |
|---|---|
| Primary Research | Structured interviews with hospital pharmacy directors, orthopedic and cardiac surgery thromboprophylaxis chairs, and outpatient hemodialysis medical directors to validate anti-Xa dosing and syringe unit prices. |
| Secondary Research | Analysis of FDA Orange Book and Purple Book injectable registries, ISTH perioperative anticoagulation guidelines, PubMed and PMC randomized clinical trials, and corporate financial filings. |
| Market Sizing and Forecasting | Top-down global pharmaceutical and parenteral anticoagulant baselines (child market representing 6.3% of the parent anticoagulant and medical technology baseline) reconciled against bottom-up formulated dose shipments (1,230M to 1,315M doses in 2026) and hospital acquisition realizations from 2026 to 2036. |
| Country Forecasting Model | Econometric country projections weight inpatient joint arthroplasty and cardiac bypass volumes, chronic hemodialysis patient registries, and national biosimilar enoxaparin tender rules across eight national markets. |
| Operational Benchmark Traceability | Dosing and hospital indicators in Tables 2, 3, and 4 trace to USP Heparin Sodium monograph potency units, ACCP/ISTH VTE prophylaxis guidelines, and national inpatient surgical procedure registries. |
| Data Triangulation and Validation | Valuation estimates isolate finished parenteral heparin, LMWH, and fondaparinux dosage forms while strictly excluding oral factor Xa inhibitors, direct thrombin inhibitors, and standalone catheter lock saline. |
Heparin Market by Segments
Heparin Market segmented by Molecular Weight:
- Low Molecular Weight Heparins (LMWH)
- Depolymerized Low Molecular Weight Heparins (Enoxaparin Dalteparin)
- Unfractionated Heparin (Bovine Porcine)
Heparin Market segmented by Delivery Format:
- Prefilled Subcutaneous Safety Syringes
- Intravenous Multi-Dose Vials for Infusion
- Additional Delivery Format Categories
Heparin Market segmented by Clinical Indication:
- Venous Thromboembolism (VTE) Prophylaxis
- Treatment
- Acute Coronary Syndromes (NSTEMI
- STEMI)
- Anticoagulation During Cardiopulmonary Bypass
Heparin Market segmented by Source Origin:
- Porcine Intestinal Mucosa
- Bovine Lung
- Intestinal Mucosa
- Synthetic Ultra-Low Molecular Weight
Heparin Market segmented by End-User Facility:
- Hospital Inpatient
- Surgical Wards
- Outpatient Dialysis Centers
- Ambulatory Surgical
Heparin Market by Region
- North America
- United States
- Canada
- Latin America
- Brazil
- Mexico
- Argentina
- Chile
- Western Europe
- Germany
- France
- United Kingdom
- Italy
- Spain
- Benelux
- Nordics
- Eastern Europe
- Poland
- Czech Republic
- Romania
- Hungary
- East Asia
- China
- Japan
- South Korea
- South Asia and Pacific
- India
- ASEAN
- Australia and New Zealand
- Middle East and Africa
- GCC Countries
- South Africa
- Türkiye
- Israel
Research Sources and Bibliography
- [1] Chew, K. L., & Trauma Anticoagulation Study Group. (2026, October 1). Weight-based dosing for low-molecular-weight heparin prophylaxis in trauma patients: A systematic review and meta-analysis. Journal of Trauma and Acute Care Surgery (PubMed PMID 42813213).
- [2] University of Texas Medical Branch Burn Outcomes Collaborative. (2026, May 5). Impact of Heparin and Enoxaparin Anticoagulant Prophylaxis on Improving Acute Mortality in Burn Patients. Journal of Burn Care & Research, 47(3), 773-779 (PubMed PMID 40355368).
- [3] Sandoz Group AG. (2026, February 25). Sandoz delivers strong full-year results; guidance for 2026 reflects expected acceleration in growth. Sandoz Corporate Media Releases.
- [4] Wayne State University Anticoagulation Research Group. (2026, August 27). Prediction of Early Heparin Response in Patients With Venous Thromboembolism. The Annals of Pharmacotherapy (PubMed PMID 42661443).
- [5] Arthroplasty Thromboprophylaxis Review Consortium. (2025, October 6). Enoxaparin Versus Dalteparin for Venous Thromboembolism Prophylaxis in Hip and Knee Arthroplasty: A Systematic Review. Cureus, 17(10), e93928 (PubMed PMID 41200628).
- [6] Neurocritical Care EVD Prophylaxis Investigators. (2026, September 17). Safety of Subcutaneous Heparin in Patients Requiring External Ventricular Drains. Neurosurgery (PubMed PMID 42746627).
- [7] Bariatric Thromboprophylaxis Randomized Trial Group. (2026, August 12). Extended Venous Thromboembolism Prophylaxis After One-Anastomosis Gastric Bypass: A Three-Arm Randomized Trial of Enoxaparin Duration and Rivaroxaban. Obesity Surgery (PubMed PMID 42579268).
- [8] International Heparin Supply Diversification Consortium. (2026, July 18). Immunogenic Risk Assessment of Porcine, Bovine, and Ovine Heparins for Diversifying the Global Heparin Supply. Journal of Thrombosis and Haemostasis (PubMed PMID 42471057).
- [9] Acute Coronary Syndrome Anticoagulation Investigators. (2026, March 10). Therapeutic and Side Effects of Enoxaparin over Heparin on Acute Coronary Syndrome Patients. Cureus (PubMed PMID 41833018).
- [10] Trauma Anti-Xa Optimization Study Group. (2026, September 5). Change associated with enoxaparin prophylactic anti-Xa levels in trauma patients. Injury (PubMed PMID 42727179).
- [11] ISTH SSC on Perioperative and Critical Care Haemostasis and Thrombosis. (2026, June 4). Management of anticoagulation in patients with heparin-induced thrombocytopenia requiring cardiac surgery with cardiopulmonary bypass. Journal of Thrombosis and Haemostasis, 24(9), 3369-3391 (PubMed PMID 42248416).
- [12] NSTE-ACS Anticoagulation Safety Investigators. (2025, December 22). Safety Profile and Bleeding Complications of Fondaparinux Versus Enoxaparin in Non-ST Segment Elevation Acute Coronary Syndrome. Clinical Cardiology (PubMed PMID 41583304).
- [13] Cleveland Clinic Cardiothoracic Anesthesiology Group. (2026, July 4). Anticoagulation Strategies for Cardiopulmonary Bypass in Heparin-Induced Thrombocytopenia: A Brief Review and Practical Algorithm. Journal of Cardiothoracic and Vascular Anesthesia (PubMed PMID 42509130).
- [14] ACL Reconstruction Thromboprophylaxis Trialists. (2025, September 29). Anticoagulant and anti-inflammatory effects of fondaparinux sodium during anterior cruciate ligament reconstruction in high risk VTE patients. Knee Surgery, Sports Traumatology, Arthroscopy (PubMed PMID 41020563).
- [15] Orthopedic Fondaparinux Meta-Analysis Group. (2025, May 29). Efficacy and safety of fondaparinux in elective total hip arthroplasty and hip fracture surgery: A systematic review and meta-analysis. Archives of Orthopaedic and Trauma Surgery (PubMed PMID 40442800).
- [16] Sandoz Group AG. (2026, August 5). Sandoz Half-Year Report 2026: Outstanding Biosimilar and Generic Momentum. Sandoz Media Releases.
- [17] Trauma ICU Anti-Xa Guided Prophylaxis Group. (2025, February 7). Anti-Xa guided enoxaparin thromboprophylaxis is associated with improved target attainment in critically ill trauma patients. Thrombosis Research (PubMed PMID 39918598).
- [18] Renal Dialysis Anticoagulation Case Study Group. (2025, August 25). Therapeutic high-dose enoxaparin monitoring in a heparin-resistant dialysis patient with recurrent thromboembolic events. European Journal of Hospital Pharmacy (PubMed PMID 40854724).
- [19] ECMO Anticoagulation Dosing Trial Investigators. (2026, July 25). Standard-dose unfractionated heparin versus low-dose unfractionated heparin in patients receiving extracorporeal membrane oxygenation. Intensive Care Medicine (PubMed PMID 42413523).
- [20] Pediatric Liver Transplant Thromboprophylaxis Group. (2026, August 5). Heparin continuous infusion for thromboprophylaxis in pediatric liver transplantation. Pediatric Transplantation (PubMed PMID 42620896).
- [21] Abbott Laboratories. (2026, October 21). Abbott Reports Third-Quarter 2026 Results and Reaffirms Full-Year EPS Guidance. Abbott MediaRoom Press Releases.
- [22] Abbott Laboratories. (2026, April 16). Abbott Reports First-Quarter 2026 Results and Updates Guidance on Diagnostics and Vascular Expansion. Abbott MediaRoom Financial Releases.
- [23] Danaher Corporation. (2026, January 28). Danaher Reports Fourth Quarter and Full Year 2025 Results and Provides 2026 Core Revenue Guidance. Danaher Investor Relations.
- [24] Pfizer Inc. (2025, December 16). Pfizer Reaffirms Full-Year 2025 EPS Guidance and Provides Full-Year 2026 Guidance. Pfizer Corporate Press Releases.
- [25] Pediatric ECMO Anticoagulation Investigators. (2026, March 1). Unfractionated Heparin Dosing in Pediatric Venoarterial Extracorporeal Membrane Oxygenation. Pediatric Critical Care Medicine (PubMed PMID 41467746).
- [26] Sandoz Group AG. (2026, October 28). Sandoz reports strong biosimilar sales momentum, narrowed full-year net-sales range and upgrade to margin guidance. Sandoz Corporate Newsroom.
- [27] Sanofi SA. (2026, October 30). Press Release: Q3 2026: double-digit growth in sales and business EPS; FY 2026 guidance upgraded. Sanofi Media Room.
- [28] FondaKIDS Pediatric Thrombosis Investigators. (2026, August 10). Safety and efficacy of fondaparinux in pediatric venous thromboembolism. Blood Advances (PubMed PMID 42594563).
- [29] Hemodialysis HIT Systematic Review Group. (2025, September 9). Safety and efficacy of fondaparinux use in hemodialysis patients with heparin-induced thrombocytopenia: A systematic review. International Urology and Nephrology (PubMed PMID 40925931).
- [30] Abbott Laboratories. (2026, July 16). Abbott Reports Second-Quarter 2026 Results and Raises Full-Year EPS Guidance. Abbott MediaRoom Press Releases.
- [31] Thermo Fisher Scientific Inc. (2026, August 31). Cell and Gene Therapy and Biopharma Commercialization Trends Shaping Commercial Success in 2026. Thermo Fisher Scientific Bioprocessing Blog.
- [32] Pfizer Inc. (2026, August 4). Pfizer Reports Second-Quarter 2026 Results and Raises Midpoint of 2026 Revenue and Adjusted Diluted EPS Guidance. Pfizer Investor Relations Financial Releases.
This bibliography is provided for reader reference and is not exhaustive. The full report contains the complete reference list and detailed citations.
This Report Answers
- How large is the heparin market in 2026 and what is forecast for 2036?
- Which surgical thromboprophylaxis and chronic hemodialysis pressures support demand for heparin?
- Why do Low Molecular Weight Heparins lead the molecular weight category?
- Why do Prefilled Subcutaneous Safety Syringes lead the delivery format category globally?
- How do growth rates differ across the United States and South Korea as well as Saudi Arabia?
- Which leading companies supply finished LMWH syringes versus coagulation diagnostics and bioprocess solutions?
- What clinical risks from heparin-induced thrombocytopenia restrain unmonitored unfractionated heparin dosing?
- What should hospital pharmacy committees evaluate when qualifying biosimilar enoxaparin and synthetic fondaparinux?
Table of Content
Table of Content
- Key Takeaways
- Market Size and CAGR
- Top Growth Driver
- Fastest Growing Segment
- Leading Region
- Key Companies
- Emerging Opportunities
- Executive Summary
- Global Market Outlook
- Demand-side Trends
- Supply-side Trends
- Technology Roadmap Analysis
- Analysis and Recommendations
- Analyst Perspective (What is happening? Why now? What should investors know?)
- Key Questions Answered
- How large is the market?
- What is the CAGR?
- What are key trends?
- Which region dominates?
- Who are the leaders?
Read More...
- Market Overview
- Market Coverage / Taxonomy
- Market Definition / Scope / Limitations
- Research Methodology
- Chapter Orientation
- Analytical Lens and Working Hypotheses
- Market Structure, Signals, and Trend Drivers
- Benchmarking and Cross-market Comparability
- Market Sizing, Forecasting, and Opportunity Mapping
- Research Design and Evidence Framework
- Desk Research Programme (Secondary Evidence)
- Expert Input and Fieldwork (Primary Evidence)
- Tooling, Models, and Reference Databases
- Data Engineering and Model Build
- Quality Assurance and Audit Trail
- Market Background
- Market Dynamics (Drivers, Restraints, Opportunity, Trends)
- Scenario Forecast (Optimistic, Likely, Conservative)
- Impact Analysis
- AI Impact
- Sustainability Impact
- Regulatory Impact
- Technology Impact
- Consumer / Buyer Analysis
- Purchase Drivers
- Adoption Barriers
- Buyer Journey
- Opportunity Map Analysis
- Product Life Cycle Analysis
- Supply Chain Analysis
- Investment Feasibility Matrix
- Value Chain Analysis
- PESTLE and Porter's Analysis
- Regulatory Landscape
- Regional Parent Market Outlook
- Production and Consumption Statistics
- Import and Export Statistics
- Global Market Analysis and Forecast, 2021 to 2036
- Historical Market Size Value (USD Million) Analysis, 2021 to 2025
- Current and Future Market Size Value (USD Million) Projections, 2026 to 2036
- Y-o-Y Growth Trend Analysis
- Absolute $ Opportunity Analysis
- Global Market Pricing Analysis, 2021 to 2036
- Global Market Analysis and Forecast, By Molecular Weight, 2021 to 2036
- Introduction / Key Findings
- Historical Market Size Value (USD Million) Analysis By Molecular Weight, 2021 to 2025
- Current and Future Market Size Value (USD Million) Analysis and Forecast By Molecular Weight, 2026 to 2036
- Low Molecular Weight Heparins (LMWH)
- Depolymerized Low Molecular Weight Heparins (Enoxaparin Dalteparin)
- Unfractionated Heparin (Bovine Porcine)
- Y-o-Y Growth Trend Analysis By Molecular Weight, 2021 to 2025
- Absolute $ Opportunity Analysis By Molecular Weight, 2026 to 2036
- Global Market Analysis and Forecast, By Delivery Format, 2021 to 2036
- Introduction / Key Findings
- Historical Market Size Value (USD Million) Analysis By Delivery Format, 2021 to 2025
- Current and Future Market Size Value (USD Million) Analysis and Forecast By Delivery Format, 2026 to 2036
- Prefilled Subcutaneous Safety Syringes
- Intravenous Multi-Dose Vials for Infusion
- Additional Delivery Format Categories
- Y-o-Y Growth Trend Analysis By Delivery Format, 2021 to 2025
- Absolute $ Opportunity Analysis By Delivery Format, 2026 to 2036
- Global Market Analysis and Forecast, By Clinical Indication, 2021 to 2036
- Introduction / Key Findings
- Historical Market Size Value (USD Million) Analysis By Clinical Indication, 2021 to 2025
- Current and Future Market Size Value (USD Million) Analysis and Forecast By Clinical Indication, 2026 to 2036
- Venous Thromboembolism (VTE) Prophylaxis
- Treatment
- Acute Coronary Syndromes (NSTEMI
- STEMI)
- Anticoagulation During Cardiopulmonary Bypass
- Y-o-Y Growth Trend Analysis By Clinical Indication, 2021 to 2025
- Absolute $ Opportunity Analysis By Clinical Indication, 2026 to 2036
- Global Market Analysis and Forecast, By Source Origin, 2021 to 2036
- Introduction / Key Findings
- Historical Market Size Value (USD Million) Analysis By Source Origin, 2021 to 2025
- Current and Future Market Size Value (USD Million) Analysis and Forecast By Source Origin, 2026 to 2036
- Porcine Intestinal Mucosa
- Bovine Lung
- Intestinal Mucosa
- Synthetic Ultra-Low Molecular Weight
- Y-o-Y Growth Trend Analysis By Source Origin, 2021 to 2025
- Absolute $ Opportunity Analysis By Source Origin, 2026 to 2036
- Global Market Analysis and Forecast, By End-User Facility, 2021 to 2036
- Introduction / Key Findings
- Historical Market Size Value (USD Million) Analysis By End-User Facility, 2021 to 2025
- Current and Future Market Size Value (USD Million) Analysis and Forecast By End-User Facility, 2026 to 2036
- Hospital Inpatient
- Surgical Wards
- Outpatient Dialysis Centers
- Ambulatory Surgical
- Y-o-Y Growth Trend Analysis By End-User Facility, 2021 to 2025
- Absolute $ Opportunity Analysis By End-User Facility, 2026 to 2036
- Global Market Analysis and Forecast, By Region, 2021 to 2036
- Introduction
- Historical Market Size Value (USD Million) Analysis By Region, 2021 to 2025
- Current Market Size Value (USD Million) Analysis and Forecast By Region, 2026 to 2036
- North America
- Latin America
- Western Europe
- Eastern Europe
- East Asia
- South Asia and Pacific
- Middle East and Africa
- Market Attractiveness Analysis By Region
- North America Market Analysis and Forecast, By Country, 2021 to 2036
- Historical Market Size Value (USD Million) Trend Analysis By Market Taxonomy, 2021 to 2025
- Market Size Value (USD Million) Forecast By Market Taxonomy, 2026 to 2036
- By Country
- United States
- Canada
- By Molecular Weight
- By Delivery Format
- By Clinical Indication
- By Source Origin
- By End-User Facility
- By Country
- Market Attractiveness Analysis
- By Country
- By Molecular Weight
- By Delivery Format
- By Clinical Indication
- By Source Origin
- By End-User Facility
- Key Takeaways
- Latin America Market Analysis and Forecast, By Country
- Historical Market Size Value (USD Million) Trend Analysis By Market Taxonomy, 2021 to 2025
- Market Size Value (USD Million) Forecast By Market Taxonomy, 2026 to 2036
- By Country
- Brazil
- Mexico
- Argentina
- Chile
- By Molecular Weight
- By Delivery Format
- By Clinical Indication
- By Source Origin
- By End-User Facility
- By Country
- Market Attractiveness Analysis
- By Country
- By Molecular Weight
- By Delivery Format
- By Clinical Indication
- By Source Origin
- By End-User Facility
- Key Takeaways
- Western Europe Market Analysis and Forecast, By Country
- Historical Market Size Value (USD Million) Trend Analysis By Market Taxonomy, 2021 to 2025
- Market Size Value (USD Million) Forecast By Market Taxonomy, 2026 to 2036
- By Country
- Germany
- France
- United Kingdom
- Italy
- Spain
- Benelux
- Nordics
- By Molecular Weight
- By Delivery Format
- By Clinical Indication
- By Source Origin
- By End-User Facility
- By Country
- Market Attractiveness Analysis
- By Country
- By Molecular Weight
- By Delivery Format
- By Clinical Indication
- By Source Origin
- By End-User Facility
- Key Takeaways
- Eastern Europe Market Analysis and Forecast, By Country
- Historical Market Size Value (USD Million) Trend Analysis By Market Taxonomy, 2021 to 2025
- Market Size Value (USD Million) Forecast By Market Taxonomy, 2026 to 2036
- By Country
- Poland
- Czech Republic
- Romania
- Hungary
- By Molecular Weight
- By Delivery Format
- By Clinical Indication
- By Source Origin
- By End-User Facility
- By Country
- Market Attractiveness Analysis
- By Country
- By Molecular Weight
- By Delivery Format
- By Clinical Indication
- By Source Origin
- By End-User Facility
- Key Takeaways
- East Asia Market Analysis and Forecast, By Country
- Historical Market Size Value (USD Million) Trend Analysis By Market Taxonomy, 2021 to 2025
- Market Size Value (USD Million) Forecast By Market Taxonomy, 2026 to 2036
- By Country
- China
- Japan
- South Korea
- By Molecular Weight
- By Delivery Format
- By Clinical Indication
- By Source Origin
- By End-User Facility
- By Country
- Market Attractiveness Analysis
- By Country
- By Molecular Weight
- By Delivery Format
- By Clinical Indication
- By Source Origin
- By End-User Facility
- Key Takeaways
- South Asia and Pacific Market Analysis and Forecast, By Country
- Historical Market Size Value (USD Million) Trend Analysis By Market Taxonomy, 2021 to 2025
- Market Size Value (USD Million) Forecast By Market Taxonomy, 2026 to 2036
- By Country
- India
- ASEAN
- Australia and New Zealand
- By Molecular Weight
- By Delivery Format
- By Clinical Indication
- By Source Origin
- By End-User Facility
- By Country
- Market Attractiveness Analysis
- By Country
- By Molecular Weight
- By Delivery Format
- By Clinical Indication
- By Source Origin
- By End-User Facility
- Key Takeaways
- Middle East and Africa Market Analysis and Forecast, By Country
- Historical Market Size Value (USD Million) Trend Analysis By Market Taxonomy, 2021 to 2025
- Market Size Value (USD Million) Forecast By Market Taxonomy, 2026 to 2036
- By Country
- GCC Countries
- South Africa
- Türkiye
- Israel
- By Molecular Weight
- By Delivery Format
- By Clinical Indication
- By Source Origin
- By End-User Facility
- By Country
- Market Attractiveness Analysis
- By Country
- By Molecular Weight
- By Delivery Format
- By Clinical Indication
- By Source Origin
- By End-User Facility
- Key Takeaways
- Key Countries Market Analysis
- United States
- Pricing Analysis
- Market Share Analysis, 2025
- By Molecular Weight
- By Delivery Format
- By Clinical Indication
- By Source Origin
- By End-User Facility
- Canada
- Pricing Analysis
- Market Share Analysis, 2025
- By Molecular Weight
- By Delivery Format
- By Clinical Indication
- By Source Origin
- By End-User Facility
- Mexico
- Pricing Analysis
- Market Share Analysis, 2025
- By Molecular Weight
- By Delivery Format
- By Clinical Indication
- By Source Origin
- By End-User Facility
- Brazil
- Pricing Analysis
- Market Share Analysis, 2025
- By Molecular Weight
- By Delivery Format
- By Clinical Indication
- By Source Origin
- By End-User Facility
- Chile
- Pricing Analysis
- Market Share Analysis, 2025
- By Molecular Weight
- By Delivery Format
- By Clinical Indication
- By Source Origin
- By End-User Facility
- Germany
- Pricing Analysis
- Market Share Analysis, 2025
- By Molecular Weight
- By Delivery Format
- By Clinical Indication
- By Source Origin
- By End-User Facility
- United Kingdom
- Pricing Analysis
- Market Share Analysis, 2025
- By Molecular Weight
- By Delivery Format
- By Clinical Indication
- By Source Origin
- By End-User Facility
- Italy
- Pricing Analysis
- Market Share Analysis, 2025
- By Molecular Weight
- By Delivery Format
- By Clinical Indication
- By Source Origin
- By End-User Facility
- Spain
- Pricing Analysis
- Market Share Analysis, 2025
- By Molecular Weight
- By Delivery Format
- By Clinical Indication
- By Source Origin
- By End-User Facility
- France
- Pricing Analysis
- Market Share Analysis, 2025
- By Molecular Weight
- By Delivery Format
- By Clinical Indication
- By Source Origin
- By End-User Facility
- India
- Pricing Analysis
- Market Share Analysis, 2025
- By Molecular Weight
- By Delivery Format
- By Clinical Indication
- By Source Origin
- By End-User Facility
- ASEAN
- Pricing Analysis
- Market Share Analysis, 2025
- By Molecular Weight
- By Delivery Format
- By Clinical Indication
- By Source Origin
- By End-User Facility
- Australia and New Zealand
- Pricing Analysis
- Market Share Analysis, 2025
- By Molecular Weight
- By Delivery Format
- By Clinical Indication
- By Source Origin
- By End-User Facility
- China
- Pricing Analysis
- Market Share Analysis, 2025
- By Molecular Weight
- By Delivery Format
- By Clinical Indication
- By Source Origin
- By End-User Facility
- Japan
- Pricing Analysis
- Market Share Analysis, 2025
- By Molecular Weight
- By Delivery Format
- By Clinical Indication
- By Source Origin
- By End-User Facility
- South Korea
- Pricing Analysis
- Market Share Analysis, 2025
- By Molecular Weight
- By Delivery Format
- By Clinical Indication
- By Source Origin
- By End-User Facility
- Poland
- Pricing Analysis
- Market Share Analysis, 2025
- By Molecular Weight
- By Delivery Format
- By Clinical Indication
- By Source Origin
- By End-User Facility
- Hungary
- Pricing Analysis
- Market Share Analysis, 2025
- By Molecular Weight
- By Delivery Format
- By Clinical Indication
- By Source Origin
- By End-User Facility
- Türkiye
- Pricing Analysis
- Market Share Analysis, 2025
- By Molecular Weight
- By Delivery Format
- By Clinical Indication
- By Source Origin
- By End-User Facility
- South Africa
- Pricing Analysis
- Market Share Analysis, 2025
- By Molecular Weight
- By Delivery Format
- By Clinical Indication
- By Source Origin
- By End-User Facility
- Saudi Arabia
- Pricing Analysis
- Market Share Analysis, 2025
- By Molecular Weight
- By Delivery Format
- By Clinical Indication
- By Source Origin
- By End-User Facility
- Switzerland
- Pricing Analysis
- Market Share Analysis, 2025
- By Molecular Weight
- By Delivery Format
- By Clinical Indication
- By Source Origin
- By End-User Facility
- Australia
- Pricing Analysis
- Market Share Analysis, 2025
- By Molecular Weight
- By Delivery Format
- By Clinical Indication
- By Source Origin
- By End-User Facility
- United States
- Market Structure Analysis
- Competition Dashboard
- Competition Benchmarking
- Market Share Analysis of Top Players
- By Regional
- By Molecular Weight
- By Delivery Format
- By Clinical Indication
- By Source Origin
- By End-User Facility
- Emerging Startups
- Innovation Benchmarking
- Competition Analysis
- Competition Deep Dive
- Abbott Laboratories
- Overview
- Product Portfolio
- Profitability by Market Segments
- Sales Footprint
- Strategy Overview
- Marketing Strategy
- Product Strategy
- Channel Strategy
- Thermo Fisher Scientific Inc.
- Danaher Corporation
- Sandoz Group AG
- Pfizer Inc.
- Sanofi SA
- Fresenius Kabi AG
- LEO Pharma A/S
- Hikma Pharmaceuticals PLC
- Amphastar Pharmaceuticals Inc.
- Abbott Laboratories
- Case Studies
- Success Stories
- Recent Developments
- Competition Deep Dive
- Assumptions & Acronyms Used
List of Tables
- Table 1: Global Market Value (USD Million) Forecast by Region, 2021 to 2036
- Table 2: Global Market Value (USD Million) Forecast by Molecular Weight, 2021 to 2036
- Table 3: Global Market Value (USD Million) Forecast by Delivery Format, 2021 to 2036
- Table 4: Global Market Value (USD Million) Forecast by Clinical Indication, 2021 to 2036
- Table 5: Global Market Value (USD Million) Forecast by Source Origin, 2021 to 2036
- Table 6: Global Market Value (USD Million) Forecast by End-User Facility, 2021 to 2036
- Table 7: North America Market Value (USD Million) Forecast by Country, 2021 to 2036
- Table 8: North America Market Value (USD Million) Forecast by Molecular Weight, 2021 to 2036
- Table 9: North America Market Value (USD Million) Forecast by Delivery Format, 2021 to 2036
- Table 10: North America Market Value (USD Million) Forecast by Clinical Indication, 2021 to 2036
- Table 11: North America Market Value (USD Million) Forecast by Source Origin, 2021 to 2036
- Table 12: North America Market Value (USD Million) Forecast by End-User Facility, 2021 to 2036
- Table 13: Latin America Market Value (USD Million) Forecast by Country, 2021 to 2036
- Table 14: Latin America Market Value (USD Million) Forecast by Molecular Weight, 2021 to 2036
- Table 15: Latin America Market Value (USD Million) Forecast by Delivery Format, 2021 to 2036
- Table 16: Latin America Market Value (USD Million) Forecast by Clinical Indication, 2021 to 2036
- Table 17: Latin America Market Value (USD Million) Forecast by Source Origin, 2021 to 2036
- Table 18: Latin America Market Value (USD Million) Forecast by End-User Facility, 2021 to 2036
- Table 19: Western Europe Market Value (USD Million) Forecast by Country, 2021 to 2036
- Table 20: Western Europe Market Value (USD Million) Forecast by Molecular Weight, 2021 to 2036
- Table 21: Western Europe Market Value (USD Million) Forecast by Delivery Format, 2021 to 2036
- Table 22: Western Europe Market Value (USD Million) Forecast by Clinical Indication, 2021 to 2036
- Table 23: Western Europe Market Value (USD Million) Forecast by Source Origin, 2021 to 2036
- Table 24: Western Europe Market Value (USD Million) Forecast by End-User Facility, 2021 to 2036
- Table 25: Eastern Europe Market Value (USD Million) Forecast by Country, 2021 to 2036
- Table 26: Eastern Europe Market Value (USD Million) Forecast by Molecular Weight, 2021 to 2036
- Table 27: Eastern Europe Market Value (USD Million) Forecast by Delivery Format, 2021 to 2036
- Table 28: Eastern Europe Market Value (USD Million) Forecast by Clinical Indication, 2021 to 2036
- Table 29: Eastern Europe Market Value (USD Million) Forecast by Source Origin, 2021 to 2036
- Table 30: Eastern Europe Market Value (USD Million) Forecast by End-User Facility, 2021 to 2036
- Table 31: East Asia Market Value (USD Million) Forecast by Country, 2021 to 2036
- Table 32: East Asia Market Value (USD Million) Forecast by Molecular Weight, 2021 to 2036
- Table 33: East Asia Market Value (USD Million) Forecast by Delivery Format, 2021 to 2036
- Table 34: East Asia Market Value (USD Million) Forecast by Clinical Indication, 2021 to 2036
- Table 35: East Asia Market Value (USD Million) Forecast by Source Origin, 2021 to 2036
- Table 36: East Asia Market Value (USD Million) Forecast by End-User Facility, 2021 to 2036
- Table 37: South Asia and Pacific Market Value (USD Million) Forecast by Country, 2021 to 2036
- Table 38: South Asia and Pacific Market Value (USD Million) Forecast by Molecular Weight, 2021 to 2036
- Table 39: South Asia and Pacific Market Value (USD Million) Forecast by Delivery Format, 2021 to 2036
- Table 40: South Asia and Pacific Market Value (USD Million) Forecast by Clinical Indication, 2021 to 2036
- Table 41: South Asia and Pacific Market Value (USD Million) Forecast by Source Origin, 2021 to 2036
- Table 42: South Asia and Pacific Market Value (USD Million) Forecast by End-User Facility, 2021 to 2036
- Table 43: Middle East and Africa Market Value (USD Million) Forecast by Country, 2021 to 2036
- Table 44: Middle East and Africa Market Value (USD Million) Forecast by Molecular Weight, 2021 to 2036
- Table 45: Middle East and Africa Market Value (USD Million) Forecast by Delivery Format, 2021 to 2036
- Table 46: Middle East and Africa Market Value (USD Million) Forecast by Clinical Indication, 2021 to 2036
- Table 47: Middle East and Africa Market Value (USD Million) Forecast by Source Origin, 2021 to 2036
- Table 48: Middle East and Africa Market Value (USD Million) Forecast by End-User Facility, 2021 to 2036
List of Figures
- Figure 1: Global Market Pricing Analysis
- Figure 2: Global Market Value (USD Million) Forecast 2021-2036
- Figure 3: Global Market Value Share and BPS Analysis by Molecular Weight, 2026 and 2036
- Figure 4: Global Market Y-o-Y Growth Comparison by Molecular Weight, 2026-2036
- Figure 5: Global Market Attractiveness Analysis by Molecular Weight
- Figure 6: Global Market Value Share and BPS Analysis by Delivery Format, 2026 and 2036
- Figure 7: Global Market Y-o-Y Growth Comparison by Delivery Format, 2026-2036
- Figure 8: Global Market Attractiveness Analysis by Delivery Format
- Figure 9: Global Market Value Share and BPS Analysis by Clinical Indication, 2026 and 2036
- Figure 10: Global Market Y-o-Y Growth Comparison by Clinical Indication, 2026-2036
- Figure 11: Global Market Attractiveness Analysis by Clinical Indication
- Figure 12: Global Market Value Share and BPS Analysis by Source Origin, 2026 and 2036
- Figure 13: Global Market Y-o-Y Growth Comparison by Source Origin, 2026-2036
- Figure 14: Global Market Attractiveness Analysis by Source Origin
- Figure 15: Global Market Value Share and BPS Analysis by End-User Facility, 2026 and 2036
- Figure 16: Global Market Y-o-Y Growth Comparison by End-User Facility, 2026-2036
- Figure 17: Global Market Attractiveness Analysis by End-User Facility
- Figure 18: Global Market Value (USD Million) Share and BPS Analysis by Region, 2026 and 2036
- Figure 19: Global Market Y-o-Y Growth Comparison by Region, 2026-2036
- Figure 20: Global Market Attractiveness Analysis by Region
- Figure 21: North America Market Incremental Dollar Opportunity, 2026-2036
- Figure 22: Latin America Market Incremental Dollar Opportunity, 2026-2036
- Figure 23: Western Europe Market Incremental Dollar Opportunity, 2026-2036
- Figure 24: Eastern Europe Market Incremental Dollar Opportunity, 2026-2036
- Figure 25: East Asia Market Incremental Dollar Opportunity, 2026-2036
- Figure 26: South Asia and Pacific Market Incremental Dollar Opportunity, 2026-2036
- Figure 27: Middle East and Africa Market Incremental Dollar Opportunity, 2026-2036
- Figure 28: North America Market Value Share and BPS Analysis by Country, 2026 and 2036
- Figure 29: North America Market Value Share and BPS Analysis by Molecular Weight, 2026 and 2036
- Figure 30: North America Market Y-o-Y Growth Comparison by Molecular Weight, 2026-2036
- Figure 31: North America Market Attractiveness Analysis by Molecular Weight
- Figure 32: North America Market Value Share and BPS Analysis by Delivery Format, 2026 and 2036
- Figure 33: North America Market Y-o-Y Growth Comparison by Delivery Format, 2026-2036
- Figure 34: North America Market Attractiveness Analysis by Delivery Format
- Figure 35: North America Market Value Share and BPS Analysis by Clinical Indication, 2026 and 2036
- Figure 36: North America Market Y-o-Y Growth Comparison by Clinical Indication, 2026-2036
- Figure 37: North America Market Attractiveness Analysis by Clinical Indication
- Figure 38: North America Market Value Share and BPS Analysis by Source Origin, 2026 and 2036
- Figure 39: North America Market Y-o-Y Growth Comparison by Source Origin, 2026-2036
- Figure 40: North America Market Attractiveness Analysis by Source Origin
- Figure 41: North America Market Value Share and BPS Analysis by End-User Facility, 2026 and 2036
- Figure 42: North America Market Y-o-Y Growth Comparison by End-User Facility, 2026-2036
- Figure 43: North America Market Attractiveness Analysis by End-User Facility
- Figure 44: Latin America Market Value Share and BPS Analysis by Country, 2026 and 2036
- Figure 45: Latin America Market Value Share and BPS Analysis by Molecular Weight, 2026 and 2036
- Figure 46: Latin America Market Y-o-Y Growth Comparison by Molecular Weight, 2026-2036
- Figure 47: Latin America Market Attractiveness Analysis by Molecular Weight
- Figure 48: Latin America Market Value Share and BPS Analysis by Delivery Format, 2026 and 2036
- Figure 49: Latin America Market Y-o-Y Growth Comparison by Delivery Format, 2026-2036
- Figure 50: Latin America Market Attractiveness Analysis by Delivery Format
- Figure 51: Latin America Market Value Share and BPS Analysis by Clinical Indication, 2026 and 2036
- Figure 52: Latin America Market Y-o-Y Growth Comparison by Clinical Indication, 2026-2036
- Figure 53: Latin America Market Attractiveness Analysis by Clinical Indication
- Figure 54: Latin America Market Value Share and BPS Analysis by Source Origin, 2026 and 2036
- Figure 55: Latin America Market Y-o-Y Growth Comparison by Source Origin, 2026-2036
- Figure 56: Latin America Market Attractiveness Analysis by Source Origin
- Figure 57: Latin America Market Value Share and BPS Analysis by End-User Facility, 2026 and 2036
- Figure 58: Latin America Market Y-o-Y Growth Comparison by End-User Facility, 2026-2036
- Figure 59: Latin America Market Attractiveness Analysis by End-User Facility
- Figure 60: Western Europe Market Value Share and BPS Analysis by Country, 2026 and 2036
- Figure 61: Western Europe Market Value Share and BPS Analysis by Molecular Weight, 2026 and 2036
- Figure 62: Western Europe Market Y-o-Y Growth Comparison by Molecular Weight, 2026-2036
- Figure 63: Western Europe Market Attractiveness Analysis by Molecular Weight
- Figure 64: Western Europe Market Value Share and BPS Analysis by Delivery Format, 2026 and 2036
- Figure 65: Western Europe Market Y-o-Y Growth Comparison by Delivery Format, 2026-2036
- Figure 66: Western Europe Market Attractiveness Analysis by Delivery Format
- Figure 67: Western Europe Market Value Share and BPS Analysis by Clinical Indication, 2026 and 2036
- Figure 68: Western Europe Market Y-o-Y Growth Comparison by Clinical Indication, 2026-2036
- Figure 69: Western Europe Market Attractiveness Analysis by Clinical Indication
- Figure 70: Western Europe Market Value Share and BPS Analysis by Source Origin, 2026 and 2036
- Figure 71: Western Europe Market Y-o-Y Growth Comparison by Source Origin, 2026-2036
- Figure 72: Western Europe Market Attractiveness Analysis by Source Origin
- Figure 73: Western Europe Market Value Share and BPS Analysis by End-User Facility, 2026 and 2036
- Figure 74: Western Europe Market Y-o-Y Growth Comparison by End-User Facility, 2026-2036
- Figure 75: Western Europe Market Attractiveness Analysis by End-User Facility
- Figure 76: Eastern Europe Market Value Share and BPS Analysis by Country, 2026 and 2036
- Figure 77: Eastern Europe Market Value Share and BPS Analysis by Molecular Weight, 2026 and 2036
- Figure 78: Eastern Europe Market Y-o-Y Growth Comparison by Molecular Weight, 2026-2036
- Figure 79: Eastern Europe Market Attractiveness Analysis by Molecular Weight
- Figure 80: Eastern Europe Market Value Share and BPS Analysis by Delivery Format, 2026 and 2036
- Figure 81: Eastern Europe Market Y-o-Y Growth Comparison by Delivery Format, 2026-2036
- Figure 82: Eastern Europe Market Attractiveness Analysis by Delivery Format
- Figure 83: Eastern Europe Market Value Share and BPS Analysis by Clinical Indication, 2026 and 2036
- Figure 84: Eastern Europe Market Y-o-Y Growth Comparison by Clinical Indication, 2026-2036
- Figure 85: Eastern Europe Market Attractiveness Analysis by Clinical Indication
- Figure 86: Eastern Europe Market Value Share and BPS Analysis by Source Origin, 2026 and 2036
- Figure 87: Eastern Europe Market Y-o-Y Growth Comparison by Source Origin, 2026-2036
- Figure 88: Eastern Europe Market Attractiveness Analysis by Source Origin
- Figure 89: Eastern Europe Market Value Share and BPS Analysis by End-User Facility, 2026 and 2036
- Figure 90: Eastern Europe Market Y-o-Y Growth Comparison by End-User Facility, 2026-2036
- Figure 91: Eastern Europe Market Attractiveness Analysis by End-User Facility
- Figure 92: East Asia Market Value Share and BPS Analysis by Country, 2026 and 2036
- Figure 93: East Asia Market Value Share and BPS Analysis by Molecular Weight, 2026 and 2036
- Figure 94: East Asia Market Y-o-Y Growth Comparison by Molecular Weight, 2026-2036
- Figure 95: East Asia Market Attractiveness Analysis by Molecular Weight
- Figure 96: East Asia Market Value Share and BPS Analysis by Delivery Format, 2026 and 2036
- Figure 97: East Asia Market Y-o-Y Growth Comparison by Delivery Format, 2026-2036
- Figure 98: East Asia Market Attractiveness Analysis by Delivery Format
- Figure 99: East Asia Market Value Share and BPS Analysis by Clinical Indication, 2026 and 2036
- Figure 100: East Asia Market Y-o-Y Growth Comparison by Clinical Indication, 2026-2036
- Figure 101: East Asia Market Attractiveness Analysis by Clinical Indication
- Figure 102: East Asia Market Value Share and BPS Analysis by Source Origin, 2026 and 2036
- Figure 103: East Asia Market Y-o-Y Growth Comparison by Source Origin, 2026-2036
- Figure 104: East Asia Market Attractiveness Analysis by Source Origin
- Figure 105: East Asia Market Value Share and BPS Analysis by End-User Facility, 2026 and 2036
- Figure 106: East Asia Market Y-o-Y Growth Comparison by End-User Facility, 2026-2036
- Figure 107: East Asia Market Attractiveness Analysis by End-User Facility
- Figure 108: South Asia and Pacific Market Value Share and BPS Analysis by Country, 2026 and 2036
- Figure 109: South Asia and Pacific Market Value Share and BPS Analysis by Molecular Weight, 2026 and 2036
- Figure 110: South Asia and Pacific Market Y-o-Y Growth Comparison by Molecular Weight, 2026-2036
- Figure 111: South Asia and Pacific Market Attractiveness Analysis by Molecular Weight
- Figure 112: South Asia and Pacific Market Value Share and BPS Analysis by Delivery Format, 2026 and 2036
- Figure 113: South Asia and Pacific Market Y-o-Y Growth Comparison by Delivery Format, 2026-2036
- Figure 114: South Asia and Pacific Market Attractiveness Analysis by Delivery Format
- Figure 115: South Asia and Pacific Market Value Share and BPS Analysis by Clinical Indication, 2026 and 2036
- Figure 116: South Asia and Pacific Market Y-o-Y Growth Comparison by Clinical Indication, 2026-2036
- Figure 117: South Asia and Pacific Market Attractiveness Analysis by Clinical Indication
- Figure 118: South Asia and Pacific Market Value Share and BPS Analysis by Source Origin, 2026 and 2036
- Figure 119: South Asia and Pacific Market Y-o-Y Growth Comparison by Source Origin, 2026-2036
- Figure 120: South Asia and Pacific Market Attractiveness Analysis by Source Origin
- Figure 121: South Asia and Pacific Market Value Share and BPS Analysis by End-User Facility, 2026 and 2036
- Figure 122: South Asia and Pacific Market Y-o-Y Growth Comparison by End-User Facility, 2026-2036
- Figure 123: South Asia and Pacific Market Attractiveness Analysis by End-User Facility
- Figure 124: Middle East and Africa Market Value Share and BPS Analysis by Country, 2026 and 2036
- Figure 125: Middle East and Africa Market Value Share and BPS Analysis by Molecular Weight, 2026 and 2036
- Figure 126: Middle East and Africa Market Y-o-Y Growth Comparison by Molecular Weight, 2026-2036
- Figure 127: Middle East and Africa Market Attractiveness Analysis by Molecular Weight
- Figure 128: Middle East and Africa Market Value Share and BPS Analysis by Delivery Format, 2026 and 2036
- Figure 129: Middle East and Africa Market Y-o-Y Growth Comparison by Delivery Format, 2026-2036
- Figure 130: Middle East and Africa Market Attractiveness Analysis by Delivery Format
- Figure 131: Middle East and Africa Market Value Share and BPS Analysis by Clinical Indication, 2026 and 2036
- Figure 132: Middle East and Africa Market Y-o-Y Growth Comparison by Clinical Indication, 2026-2036
- Figure 133: Middle East and Africa Market Attractiveness Analysis by Clinical Indication
- Figure 134: Middle East and Africa Market Value Share and BPS Analysis by Source Origin, 2026 and 2036
- Figure 135: Middle East and Africa Market Y-o-Y Growth Comparison by Source Origin, 2026-2036
- Figure 136: Middle East and Africa Market Attractiveness Analysis by Source Origin
- Figure 137: Middle East and Africa Market Value Share and BPS Analysis by End-User Facility, 2026 and 2036
- Figure 138: Middle East and Africa Market Y-o-Y Growth Comparison by End-User Facility, 2026-2036
- Figure 139: Middle East and Africa Market Attractiveness Analysis by End-User Facility
- Figure 140: Global Market - Tier Structure Analysis
- Figure 141: Global Market - Company Share Analysis
Frequently Asked Questions
How big is the heparin market in 2026, and what is forecast for 2036?
FMI estimates that the global heparin market size stood at USD 673.0 million in 2025 and reached USD 702.4 million in 2026. Overall industry valuation is on track to hit USD 1,101.3 million by 2036 as hospitals standardize prefilled LMWH safety syringes across surgical and medical wards.
What is the CAGR for the heparin market from 2026 to 2036?
The heparin market is projected to expand at a 4.6% CAGR over the 2026 to 2036 window, adding USD 398.9 million in valuation across inpatient surgical and outpatient renal care.
Which molecular weight segment leads the heparin market?
Low Molecular Weight Heparins (LMWH) hold 46.3% of molecular weight demand in 2026 because predictable subcutaneous anti-factor Xa activity eliminates routine coagulation blood draws.
Which delivery format segment leads the heparin market?
Prefilled Subcutaneous Safety Syringes represent 66.7% of the delivery format category in 2026 as hospital nursing safety protocols mandate unit-dose needle-shielded injectors.
Which country has a notable growth outlook during the assessment period?
The United States leads national expansion projections at a 5.2% CAGR through 2036, supported by mandatory inpatient VTE quality bundles and high orthopedic and cardiac procedure volumes.
Who are the key players in the market?
Abbott Laboratories and Sandoz Group AG as well as Pfizer Inc. and Thermo Fisher Scientific Inc. anchor commercial supply plus Danaher Corporation and Sanofi SA. Other active participants include Fresenius Kabi AG and LEO Pharma A/S joined by Hikma Pharmaceuticals PLC and Amphastar Pharmaceuticals Inc.
Preview the report firsthand - request a free sample
Get SampleGet the brochure for pricing and purchase details.
Get PDF
