Pharma Grade Synthetic Camphor Market Forecast and Outlook 2025 to 2035

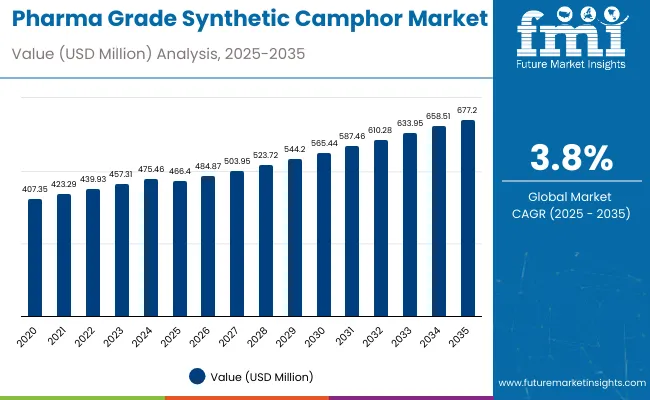
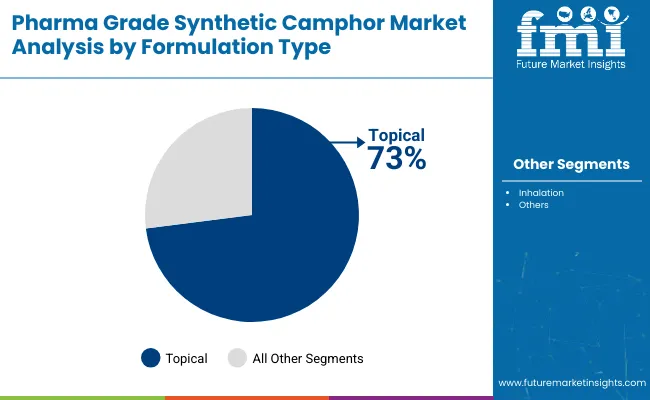
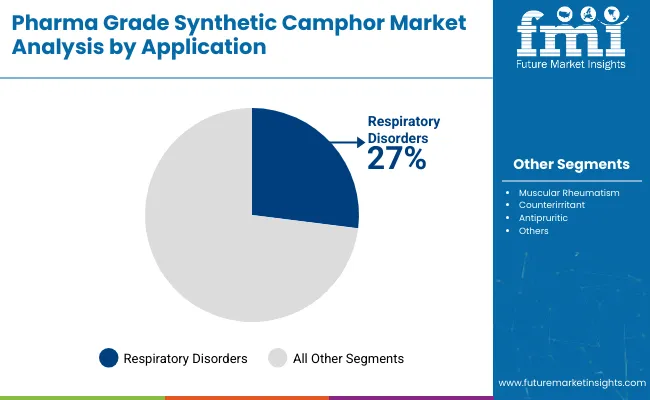
The pharma grade synthetic camphor market is expected to expand steadily from USD 466.4 million in 2025 to USD 677.2 million by 2035, advancing at a CAGR of 3.8%. This growth reflects increasing demand in pharmaceutical and therapeutic applications, driven by rising awareness of effective remedies and broader use of topical formulations. The market demonstrates a consistent upward trajectory, supported by the dominance of topical applications accounting for 73% of the market, and significant use in respiratory disorders, which hold a 27% share.

Quick Stats for Pharma Grade Synthetic Camphor Market

  • Pharma Grade Synthetic Camphor Market Value (2025): USD 466.4 million
  • Pharma Grade Synthetic Camphor Market Forecast Value (2035): USD 677.2 million
  • Pharma Grade Synthetic Camphor Market Forecast CAGR: 3.8%
  • Leading Segment in Pharma Grade Synthetic Camphor Market in 2025: Topical Formulation (73%)
  • Key Growth Regions in Pharma Grade Synthetic Camphor Market: North America and Asia Pacific
  • Key Players in Pharma Grade Synthetic Camphor Market: Nippon Fine Chemical Co., Ltd., Oriental Aromatics Limited, Saptagir Camphor Limited, Mangalam Organics Limited, Merck KGaA

Pharma Grade Synthetic Camphor Market

Metric Value
Market Value (2025) USD 466.4 million
Market Forecast Value (2035) USD 677.2 million
CAGR (2025 to 2035) 3.8%

By 2030, the market is forecasted to reach USD 573.0 million, showing a steady increase across the first half of the period. The absolute dollar growth between 2025 and 2035 is USD 210.8 million, indicating steady and reliable expansion. Growth remains balanced throughout the period, supported by increased pharmaceutical adoption, expanding treatments for muscular rheumatism, and rising demand for counterirritant and antipruritic applications.

Key companies such as Nippon Fine Chemical Co., Ltd., Oriental Aromatics Limited, and Merck KGaA are consolidating their positions through expanding production capacities and innovation in synthetic camphor formulations for enhanced efficacy and safety. Their product development pipelines emphasize pharmaceutical-grade purity, regulatory compliance, and novel applications in respiratory and topical therapies. Market performance will remain closely linked to quality standards, regional regulatory frameworks, and the ability to meet growing demand in major markets including the USA, Japan, China, and India.

The market holds a significant share in pharmaceutical and topical formulation segments, with topical applications commanding 73% in 2025. It also supports critical segments such as respiratory disorder treatments, which account for approximately 27% of the application share, reflecting its essential role in cough suppressants, inhalants, and anti-inflammatory therapies. The market also contributes notably to the muscular rheumatism and counterirritant & antipruritic segments, highlighting its versatility in therapeutic uses.

The market is undergoing transformation through advances in synthetic purity and pharmaceutical-grade certification, improving safety and efficacy profiles. Producers are expanding product portfolios to meet increasing demand in topical treatments and respiratory care, while innovation in formulations and regulatory compliance is enhancing market access. Collaborations between manufacturers, pharmaceutical companies, and healthcare providers, along with rising consumer preference for trusted synthetic alternatives, are broadening application reach and reshaping competitive dynamics.

Why is Pharma Grade Synthetic Camphor Market Growing?

The market is growing due to several key factors driving increased demand across pharmaceutical and therapeutic applications. First, rising awareness and preference for effective topical therapies have boosted the use of synthetic camphor in pain relief and anti-inflammatory formulations, particularly for muscular rheumatism and respiratory disorders. Its proven efficacy as a counterirritant and antipruritic agent further solidifies its importance in pharmaceutical products.

Secondly, advances in synthetic manufacturing have improved camphor's purity and consistency, making it safer and more reliable for pharmaceutical-grade applications. This has expanded its acceptance by regulatory bodies and healthcare providers, fostering wider utilization in mainstream medicine.

The increasing prevalence of respiratory issues worldwide, coupled with growing demand for inhalation and topical products, has also driven the market. Additionally, synthetic camphor serves as a preferred alternative to natural sources, ensuring sustainable supply amidst challenges associated with natural camphor extraction.

Pharma Grade Synthetic Camphor Market Analysis by Top Investment Segments

The market is segmented by formulation type, application, distribution channel, and region. By formulation type, the market is bifurcated into topical and inhalation. Based on application, the market is divided into respiratory disorders, muscular rheumatism, counterirritant and antipruritic, and others (pain relief, skin care, and miscellaneous therapeutic uses). In terms of distribution channel, the market is bifurcated into conventional B2B (tenders, direct procurement, wholesalers & distributors) and online B2B (internal and external channel). Regionally, the market is classified into North America, Latin America, Western Europe, Eastern Europe, South Asia & Pacific, East Asia, and the Middle East & Africa.
By Formulation Type, Topical Accounts for 73% Market Share in 2025

Pharma Grade Synthetic Camphor Market By Formulation Type

The topical formulation segment dominates the market with a 73% share in 2025, driven by the broad therapeutic benefits of synthetic camphor in creams, ointments, balms, and gels. These products provide effective pain relief, muscle relaxation, anti-inflammatory effects, and cooling sensations, which are valuable for treating conditions such as arthritis, muscular pain, backaches, sprains, and minor injuries. The ability of camphor to penetrate the skin and act as a counterirritant, stimulating blood flow and reducing pain and inflammation, significantly enhances its appeal in topical applications.

Synthetic camphor’s antiseptic and antipruritic properties expand its use in treating skin irritations, eczema, rashes, and insect bites, enhancing its versatility in dermatological products. The topical segment benefits from rising consumer demand for over-the-counter, natural-inspired, and effective analgesic solutions, especially in regions like North America, Europe, and Asia Pacific. This segment’s steady growth is also driven by ongoing product innovations, regulatory approvals, and a shift toward non-invasive pain management therapies in pharmaceutical markets.
By Application, Respiratory Disorders Accounts for 27% Market Share in 2025

Pharma Grade Synthetic Camphor Market By Application

The respiratory disorders segment is the most lucrative, accounting for approximately 27% of the market in 2025. Its strong position is attributed to camphor’s established use in treating conditions like cough, colds, nasal congestion, bronchitis, and asthma. Synthetic camphor is a key ingredient in widely used inhalants, vapor rubs, and topical decongestants, which provide fast relief by opening airways and soothing irritation.

The global increase in respiratory illnesses, driven by pollution, allergies, and viral infections, has heightened demand for effective, over-the-counter (OTC) respiratory treatments containing camphor. Additionally, the growing preference for natural and traditional remedies that deliver proven efficacy supports market expansion. Regions like North America, Europe, and Asia Pacific exhibit robust growth, fueled by healthcare infrastructure advances, rising consumer awareness, and increasing adoption of camphor-based respiratory products in self-care regimens.

What are the Drivers, Restraints, and Key Trends of the Pharma Grade Synthetic Camphor Market?

From 2025 to 2035, the market is experiencing significant growth driven by increasing demand for high-purity, effective therapeutic products in pharmaceutical and personal care industries. Growing consumer awareness regarding the benefits of synthetic camphor, along with rising prevalence of respiratory disorders and chronic pain conditions, has fueled demand for camphor-based analgesics, inhalants, and topical products. Manufacturers are investing in advanced synthetic production technologies to enhance product quality, consistency, and safety, thereby meeting stringent regulatory standards and expanding application scopes.

Increasing Health Consciousness and Formulation Innovations

Rising health consciousness and preference for scientifically validated natural ingredients have driven innovations in formulation techniques and drug delivery systems, including inhalation and topical platforms. The expanding pharmaceutical sector, particularly in North America, Asia Pacific, and Europe, supports robust growth by embracing camphor for its analgesic, anti-inflammatory, and antimicrobial properties.

Innovations Enhancing Product Quality and Therapeutic Delivery

Recent innovations in synthetic camphor production and formulation technologies have significantly expanded opportunities in the pharma grade synthetic camphor sector. Advances in manufacturing processes have enabled the production of higher-purity camphor, meeting stringent pharmaceutical standards for safety and efficacy. This has opened new avenues for its application in analgesic, anti-inflammatory, and respiratory products. Key players are focusing on developing novel delivery systems such as patches, gels, and combination inhalers, improving bioavailability and patient compliance.
Pharma Grade Synthetic Camphor Market Analysis by Key Countries

Country Wise Analysis Of Pharma Grade Synthetic Camphor Market

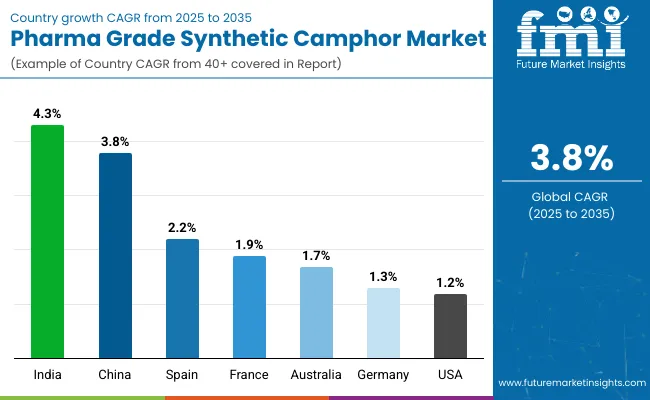
Countries CAGR (2025 to 2035)
India 4.3%
China 3.8%
Spain 2.2%
France 1.9%
Australia 1.7%
Germany 1.3%
United States 1.2%

India leads with a CAGR of 4.3% from 2025 to 2035, driven by strong pharmaceutical manufacturing, rising domestic and export demand, and government support for innovation. China follows with a strong CAGR of 3.8%, supported by cost-effective production and increasing healthcare needs. Spain and France show moderate growth at 2.2% and 1.9%, benefiting from aging populations and strict regulations. Australia and Germany have more measured growth rates of 1.7% and 1.3%, respectively, emphasizing quality and research-driven innovation. The United States experiences the slowest growth at 1.2%, representing a mature market focused on non-opioid analgesics and advanced drug delivery innovations.

The report covers an in-depth analysis of 40+ countries; seven top-performing OECD countries are highlighted below.

Production Capacity Trends in Pharma Grade Synthetic Camphor Market in India

Demand for pharma grade synthetic camphor in India is projected to grow at a CAGR of 4.3% from 2025 to 2035. This growth is supported by India’s strong pharmaceutical manufacturing infrastructure and increasing domestic demand for camphor-based topical and respiratory products. The country benefits from government initiatives promoting pharmaceutical sector growth and investments in R&D aimed at developing innovative camphor formulations. Manufacturers leverage cost advantages and strict quality controls to maintain competitiveness. India’s expanding exports amplify its global influence, making it a key player in the market. Rising healthcare awareness and increasing demand for non-opioid pain relief options further boost growth in India.

  • India has a robust pharmaceutical manufacturing base and infrastructure.
  • Domestic and international demand for camphor products is expanding.
  • Government policies actively support pharmaceutical sector growth.

Output Expansion in Pharma Grade Synthetic Camphor Market in China

Demand for pharma grade synthetic camphor in China is projected to grow at a CAGR of 3.8%, supported by cost-efficient mass production and rapid healthcare sector expansion. The country's growing prevalence of chronic diseases fuels demand for camphor in respiratory and pain relief therapies. Continuous regulatory reforms improve manufacturing standards, assuring product safety and efficacy, which increases global acceptance. Chinese manufacturers benefit from technological advancements in synthesis, enhancing product purity and consistency. The expanding e-commerce and online pharmaceutical sales channels facilitate broader consumer access. China’s strategic export focus plays a pivotal role in advancing its market position.

  • Large-scale manufacturing offers significant cost advantages.
  • The healthcare market is rapidly expanding domestically.
  • Technological innovations improve product formulation and consistency.

Structural Adoption in Pharma Grade Synthetic Camphor Market in Spain

Revenue from pharma grade synthetic camphor in Spain is expected to grow steadily with a CAGR of 2.2% over the forecast period. The country’s aging population drives increasing demand for topical analgesics, addressing musculoskeletal and chronic pain conditions. Spain's pharmaceutical sector is characterized by strict regulatory compliance, ensuring high product quality and safety. Local companies increasingly collaborate with multinational corporations to enhance formulation development and distribution networks. Sustainable manufacturing practices are gaining importance to meet environmental standards and consumer expectations. Clinical research investments validate the therapeutic efficacy and safety of camphor formulations. Spain's balance of innovation and regulation positions it well within the European pharma landscape.

  • Aging demographics increase demand for pain management products.
  • Compliance with stringent safety regulations is maintained.
  • Clinical studies support therapeutic claims and product safety.

Functional Development in Pharma Grade Synthetic Camphor Market in France

Sales of pharma grade synthetic camphor in France are projected to grow at a CAGR of 1.9%, supported by a mature healthcare system and consumer preference for premium pharmaceutical ingredients. The demand for natural and effective alternatives is boosting camphor-based topical and inhalation products. French companies prioritize research and development focused on product innovation to enhance efficacy and patient outcomes. Strict regulatory oversight ensures high-quality standards, strengthening consumer confidence. Sustainable synthesis and environmentally conscious practices are increasingly adopted. The rising incidence of respiratory and musculoskeletal ailments underlines the need for effective therapies, supporting market expansion.

  • Established healthcare infrastructure supports premium product demand.
  • Growing consumer inclination towards natural therapeutic agents.
  • Emphasis on innovative product development and efficacy.

Expansion Dynamics in Pharma Grade Synthetic Camphor Market in Australia

Demand for pharma grade synthetic camphor in Australia is anticipated to grow at a CAGR of 1.7%, driven by its advanced medical infrastructure and increasing adoption of camphor in analgesic and respiratory applications. Rising consumer focus on natural remedies and wellness supports steady demand. Australian manufacturers emphasize quality assurance and regulatory compliance to meet healthcare standards. Investments in research and development promote continuous product improvements and innovation in drug delivery systems. The growing healthcare expenditure also contributes to market growth, while sustainability efforts align with global pharmaceutical trends.

  • Advanced healthcare and pharmaceutical infrastructure exist.
  • Increasing consumer preference for natural and effective medicines.
  • R&D investments enhance product quality and delivery methods.

Quality Assurance Trends in Pharma Grade Synthetic Camphor Market in Germany

Sales of pharma grade synthetic camphor in Germany are forecasted to grow at a CAGR of 1.3%, emphasizing high standards in pharmaceutical quality and safety. The country’s aging population and increased chronic pain and respiratory conditions contribute to steady demand. German manufacturers engage extensively in research collaborations to develop innovative delivery systems like patches and inhalers. Compliance with stringent EU regulatory requirements ensures product efficacy and consumer trust. Germany is also focusing on sustainable manufacturing and transparent supply chains, enhancing its reputation as a responsible pharmaceutical market.

  • Strong focus on pharmaceutical quality and compliance.
  • Increasing demand driven by aging and chronic health issues.
  • Collaborative research accelerates innovation.

Market Penetration Trends in Pharma Grade Synthetic Camphor Market in the United States

Revenue from pharma grade synthetic camphor in the U.S. is projected to grow at a CAGR of 1.2%, supported by a mature pharmaceutical market and advanced healthcare infrastructure. Consumers increasingly prefer high-quality, non-opioid analgesics, promoting demand for camphor-based products. The U.S. pharmaceutical sector is active in research and development, focusing on improved drug delivery technologies and formulations to enhance patient compliance. Regulations ensure product safety and efficacy, fostering market confidence. Expansion in online pharmaceutical retail channels improves product accessibility and sales. Rising respiratory and musculoskeletal disorders contribute to relatively steady market growth.
  • Mature, robust pharmaceutical infrastructure supports growth.
  • Consumer preference for non-opioid pain relief options increases.
  • Active R&D promotes innovation in formulations and delivery.
  • Regulatory compliance ensures high product safety standards.
  • Online pharmaceutical sales channels expand market reach.

Competitive Landscape of the Pharma Grade Synthetic Camphor Market

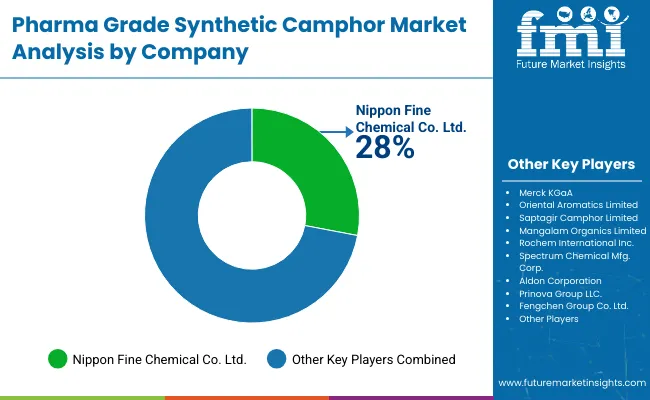
Pharma Grade Synthetic Camphor Market By Company

The market is moderately consolidated with key players differentiating themselves through advanced processing expertise, innovative product development, and established regional presence. Leading companies leverage large-scale production capabilities and diverse product portfolios of camphor-based pharmaceutical and personal care products. Their strengths include stringent quality controls, advanced synthetic processes, and extensive distribution networks.

Other significant players such as Nature’s Answer USA and Cadilla Healthcare focus on cost-effective manufacturing and supply chain optimization to meet increasing demand for high-purity and specialty synthetic camphor products. Regional manufacturers emphasize local sourcing, product customization, and adherence to stringent pharmaceutical standards to serve niche markets. Barriers to entry remain moderate, primarily due to the necessity for specialized synthetic processes, compliance with regulatory standards, and ensuring product consistency and safety. Competitiveness depends increasingly on innovation, sustainable sourcing, and the capability to meet shifting consumer preferences and evolving regulatory requirements across diverse geographic regions.

Report Scope - Pharma Grade Synthetic Camphor Market

Items Values
Quantitative Units (2025) USD 466.4 Million
Formulation Type Topical and Inhalation
Application Respiratory Disorders, Muscular Rheumatism, Counterirritant and Antipruritic, Others ( Cosmetic a nd Personal Care Uses )
Distribution Channel Conventional B2B, which comprises tenders, direct procurement, and wholesalers & distributors; and Online B2B, which includes internal channels and external channels.
Regions Covered North America, Latin America, Europe, Asia Pacific, Middle East & Africa
Countries Covered United States, Canada, Mexico, Germany, United Kingdom, France, China, India, Japan, Australia, South Korea, Brazil, and 40+ other countries
Key Companies Profiled Merck KGaA, Oriental Aromatics Limited, Saptagir Camphor Limited, Mangalam Organics Limited, Nippon Fine Chemical Co., Ltd., Rochem International, Inc., Spectrum Chemical Mfg. Corp., Aldon Corporation, Prinova Group LLC., Fengchen Group Co. Ltd.
Additional Attributes Revenue by formulation type , and application; demand for high-purity and specialty products; innovations in synthesis and formulations; expansion in pharmaceutical and personal care sectors; emphasis on supply chain efficiency and quality assurance

Key Segments

By Formulation Type:

In terms of formulation type, the industry is divided into topical and inhalation.

By Application:

In terms of application, the industry is segregated into respiratory disorders, muscular rheumatism, counterirritant and antipruritic and others

By Distribution Channels:

In terms of distribution channels, the industry is segregated into conventional B2B (tenders, direct procurement, wholesalers & distributors) and online B2B (internal channel, external channel)

By Region:

Key countries of North America, Latin America, Western Europe, Eastern Europe, South Asia & Pacific, East Asia and Middle East and Africa (MEA) have been covered in the report.

Table of Content

  1. Executive Summary
    • Global Market Outlook
    • Demand-side Trends
    • Supply-side Trends
    • Technology Roadmap Analysis
    • Analysis and Recommendations
  2. Market Overview
    • Market Coverage / Taxonomy
    • Market Definition / Scope / Limitations
  3. Market Background
    • Market Dynamics
      • Drivers
      • Restraints
      • Opportunity
      • Trends
    • Scenario Forecast
      • Demand in Optimistic Scenario
      • Demand in Likely Scenario
      • Demand in Conservative Scenario
    • Opportunity Map Analysis
    • Product Life Cycle Analysis
    • Supply Chain Analysis
      • Supply Side Participants and their Roles
        • Producers
        • Mid-Level Participants (Traders/ Agents/ Brokers)
        • Wholesalers and Distributors
      • Value Added and Value Created at Node in the Supply Chain
      • List of Raw Material Suppliers
      • List of Existing and Potential Buyer’s
    • Investment Feasibility Matrix
    • Value Chain Analysis
      • Profit Margin Analysis
      • Wholesalers and Distributors
      • Retailers
    • PESTLE and Porter’s Analysis
    • Regulatory Landscape
      • By Key Regions
      • By Key Countries
    • Regional Parent Market Outlook
    • Production and Consumption Statistics
    • Import and Export Statistics
  4. Global Market Analysis 2020 to 2024 and Forecast, 2025 to 2035
    • Historical Market Size Value (USD Million) & Volume (Metric Tons) Analysis, 2020 to 2024
    • Current and Future Market Size Value (USD Million) & Volume (Metric Tons) Projections, 2025 to 2035
      • Y-o-Y Growth Trend Analysis
      • Absolute $ Opportunity Analysis
  5. Global Market Pricing Analysis 2020 to 2024 and Forecast 2025 to 2035
  6. Global Market Analysis 2020 to 2024 and Forecast 2025 to 2035, By Formulation Type
    • Introduction / Key Findings
    • Historical Market Size Value (USD Million) & Volume (Metric Tons) Analysis By Formulation Type, 2020 to 2024
    • Current and Future Market Size Value (USD Million) & Volume (Metric Tons) Analysis and Forecast By Formulation Type, 2025 to 2035
      • Topical
      • Inhalation
    • Y-o-Y Growth Trend Analysis By Formulation Type, 2020 to 2024
    • Absolute $ Opportunity Analysis By Formulation Type, 2025 to 2035
  7. Global Market Analysis 2020 to 2024 and Forecast 2025 to 2035, By Application
    • Introduction / Key Findings
    • Historical Market Size Value (USD Million) & Volume (Metric Tons) Analysis By Application, 2020 to 2024
    • Current and Future Market Size Value (USD Million) & Volume (Metric Tons) Analysis and Forecast By Application, 2025 to 2035
      • Respiratory Disorders
      • Muscular Rheumatism
      • Counterirritant and Antipruritic
      • Others
    • Y-o-Y Growth Trend Analysis By Application, 2020 to 2024
    • Absolute $ Opportunity Analysis By Application, 2025 to 2035
  8. Global Market Analysis 2020 to 2024 and Forecast 2025 to 2035, By Distribution Channels
    • Introduction / Key Findings
    • Historical Market Size Value (USD Million) & Volume (Metric Tons) Analysis By Distribution Channels, 2020 to 2024
    • Current and Future Market Size Value (USD Million) & Volume (Metric Tons) Analysis and Forecast By Distribution Channels, 2025 to 2035
      • Conventional B2B
        • Tenders
        • Direct Procurement
        • Wholesalers & Distributors
      • Online B2B
        • Internal Channel
        • External Channel
    • Y-o-Y Growth Trend Analysis By Distribution Channels, 2020 to 2024
    • Absolute $ Opportunity Analysis By Distribution Channels, 2025 to 2035
  9. Global Market Analysis 2020 to 2024 and Forecast 2025 to 2035, By Region
    • Introduction
    • Historical Market Size Value (USD Million) & Volume (Metric Tons) Analysis By Region, 2020 to 2024
    • Current Market Size Value (USD Million) & Volume (Metric Tons) Analysis and Forecast By Region, 2025 to 2035
      • North America
      • Latin America
      • Western Europe
      • Eastern Europe
      • East Asia
      • South Asia & Pacific
      • Middle East and Africa
    • Market Attractiveness Analysis By Region
  10. North America Market Analysis 2020 to 2024 and Forecast 2025 to 2035, By Country
    • Historical Market Size Value (USD Million) & Volume (Metric Tons) Trend Analysis By Market Taxonomy, 2020 to 2024
    • Market Size Value (USD Million) & Volume (Metric Tons) Forecast By Market Taxonomy, 2025 to 2035
      • By Country
        • U.S.
        • Canada
        • Mexico
      • By Formulation Type
      • By Application
      • By Distribution Channels
    • Market Attractiveness Analysis
      • By Country
      • By Formulation Type
      • By Application
      • By Distribution Channels
    • Key Takeaways
  11. Latin America Market Analysis 2020 to 2024 and Forecast 2025 to 2035, By Country
    • Historical Market Size Value (USD Million) & Volume (Metric Tons) Trend Analysis By Market Taxonomy, 2020 to 2024
    • Market Size Value (USD Million) & Volume (Metric Tons) Forecast By Market Taxonomy, 2025 to 2035
      • By Country
        • Brazil 
        • Argentina
        • Rest of LATAM
      • By Formulation Type
      • By Application
      • By Distribution Channels
    • Market Attractiveness Analysis
      • By Country
      • By Formulation Type
      • By Application
      • By Distribution Channels
    • Key Takeaways
  12. Western Europe Market Analysis 2020 to 2024 and Forecast 2025 to 2035, By Country
    • Historical Market Size Value (USD Million) & Volume (Metric Tons) Trend Analysis By Market Taxonomy, 2020 to 2024
    • Market Size Value (USD Million) & Volume (Metric Tons) Forecast By Market Taxonomy, 2025 to 2035
      • By Country
        • Germany
        • Italy
        • France
        • UK
        • Spain
        • BENELUX
        • Nordic
        • Rest of W.Europe
      • By Formulation Type
      • By Application
      • By Distribution Channels
    • Market Attractiveness Analysis
      • By Country
      • By Formulation Type
      • By Application
      • By Distribution Channels
    • Key Takeaways
  13. Eastern Europe Market Analysis 2020 to 2024 and Forecast 2025 to 2035, By Country
    • Historical Market Size Value (USD Million) & Volume (Metric Tons) Trend Analysis By Market Taxonomy, 2020 to 2024
    • Market Size Value (USD Million) & Volume (Metric Tons) Forecast By Market Taxonomy, 2025 to 2035
      • By Country
        • Russia
        • Hungary
        • Poland
        • Balkan & Baltics
        • Rest of E. Europe
      • By Formulation Type
      • By Application
      • By Distribution Channels
    • Market Attractiveness Analysis
      • By Country
      • By Formulation Type
      • By Application
      • By Distribution Channels
    • Key Takeaways
  14. East Asia Market Analysis 2020 to 2024 and Forecast 2025 to 2035, By Country
    • Historical Market Size Value (USD Million) & Volume (Metric Tons) Trend Analysis By Market Taxonomy, 2020 to 2024
    • Market Size Value (USD Million) & Volume (Metric Tons) Forecast By Market Taxonomy, 2025 to 2035
      • By Country
        • China
        • Japan
        • South Korea
      • By Formulation Type
      • By Application
      • By Distribution Channels
    • Market Attractiveness Analysis
      • By Country
      • By Formulation Type
      • By Application
      • By Distribution Channels
    • Key Takeaways
  15. South Asia & Pacific Market Analysis 2020 to 2024 and Forecast 2025 to 2035, By Country
    • Historical Market Size Value (USD Million) & Volume (Metric Tons) Trend Analysis By Market Taxonomy, 2020 to 2024
    • Market Size Value (USD Million) & Volume (Metric Tons) Forecast By Market Taxonomy, 2025 to 2035
      • By Country
        • India
        • Australia & New Zealand
        • ASEAN
        • Rest of SAP
      • By Formulation Type
      • By Application
      • By Distribution Channels
    • Market Attractiveness Analysis
      • By Country
      • By Formulation Type
      • By Application
      • By Distribution Channels
    • Key Takeaways
  16. Middle East and Africa Market Analysis 2020 to 2024 and Forecast 2025 to 2035, By Country
    • Historical Market Size Value (USD Million) & Volume (Metric Tons) Trend Analysis By Market Taxonomy, 2020 to 2024
    • Market Size Value (USD Million) & Volume (Metric Tons) Forecast By Market Taxonomy, 2025 to 2035
      • By Country
        • GCC Countries
        • Northern Africa
        • South Africa
        • Turkiye
        • Rest of MEA
      • By Formulation Type
      • By Application
      • By Distribution Channels
    • Market Attractiveness Analysis
      • By Country
      • By Formulation Type
      • By Application
      • By Distribution Channels
    • Key Takeaways
  17. Key Countries Market Analysis
    • U.S.
      • Pricing Analysis
      • Market Share Analysis, 2024
        • By Formulation Type
        • By Application
        • By Distribution Channels
    • Canada
      • Pricing Analysis
      • Market Share Analysis, 2024
        • By Formulation Type
        • By Application
        • By Distribution Channels
    • Brazil
      • Pricing Analysis
      • Market Share Analysis, 2024
        • By Formulation Type
        • By Application
        • By Distribution Channels
    • Mexico
      • Pricing Analysis
      • Market Share Analysis, 2024
        • By Formulation Type
        • By Application
        • By Distribution Channels
    • Argentina
      • Pricing Analysis
      • Market Share Analysis, 2024
        • By Formulation Type
        • By Application
        • By Distribution Channels
  18. Market Structure Analysis
    • Competition Dashboard
    • Competition Benchmarking
    • Market Share Analysis of Top Players
      • By Regional
      • By Formulation Type
      • By Application
      • By Distribution Channels
  19. Competition Analysis
    • Competition Deep Dive
      • Merck KGaA
        • Overview
        • Product Portfolio
        • Profitability by Market Segments (Product/Age /Sales Channel/Region)
        • Sales Footprint
        • Strategy Overview
          • Marketing Strategy
          • Product Strategy
          • Channel Strategy
      • Oriental Aromatics Limited
        • Overview
        • Product Portfolio
        • Profitability by Market Segments (Product/Age /Sales Channel/Region)
        • Sales Footprint
        • Strategy Overview
          • Marketing Strategy
          • Product Strategy
          • Channel Strategy
      • Saptagir Camphor Limited
        • Overview
        • Product Portfolio
        • Profitability by Market Segments (Product/Age /Sales Channel/Region)
        • Sales Footprint
        • Strategy Overview
          • Marketing Strategy
          • Product Strategy
          • Channel Strategy
      • Mangalam Organics Limited
        • Overview
        • Product Portfolio
        • Profitability by Market Segments (Product/Age /Sales Channel/Region)
        • Sales Footprint
        • Strategy Overview
          • Marketing Strategy
          • Product Strategy
          • Channel Strategy
      • Nippon Fine Chemical Co., Ltd.
        • Overview
        • Product Portfolio
        • Profitability by Market Segments (Product/Age /Sales Channel/Region)
        • Sales Footprint
        • Strategy Overview
          • Marketing Strategy
          • Product Strategy
          • Channel Strategy
      • Rochem International, Inc.
        • Overview
        • Product Portfolio
        • Profitability by Market Segments (Product/Age /Sales Channel/Region)
        • Sales Footprint
        • Strategy Overview
          • Marketing Strategy
          • Product Strategy
          • Channel Strategy
      • Spectrum Chemical Mfg. Corp.
        • Overview
        • Product Portfolio
        • Profitability by Market Segments (Product/Age /Sales Channel/Region)
        • Sales Footprint
        • Strategy Overview
          • Marketing Strategy
          • Product Strategy
          • Channel Strategy
      • Aldon Corporation
        • Overview
        • Product Portfolio
        • Profitability by Market Segments (Product/Age /Sales Channel/Region)
        • Sales Footprint
        • Strategy Overview
          • Marketing Strategy
          • Product Strategy
          • Channel Strategy
      • Prinova Group LLC.
        • Overview
        • Product Portfolio
        • Profitability by Market Segments (Product/Age /Sales Channel/Region)
        • Sales Footprint
        • Strategy Overview
          • Marketing Strategy
          • Product Strategy
          • Channel Strategy
      • Fengchen Group Co. Ltd.
        • Overview
        • Product Portfolio
        • Profitability by Market Segments (Product/Age /Sales Channel/Region)
        • Sales Footprint
        • Strategy Overview
          • Marketing Strategy
          • Product Strategy
          • Channel Strategy
  20. Assumptions & Acronyms Used
  21. Research Methodology

List of Tables

  • Table 1: Global Market Value (USD Million) Forecast by Region, 2020-2035
  • Table 2: Global Market Volume (Metric Tons) Forecast by Region, 2020-2035
  • Table 3: Global Market Value (USD Million) Forecast by Formulation Type, 2020-2035
  • Table 4: Global Market Volume (Metric Tons) Forecast by Formulation Type, 2020-2035
  • Table 5: Global Market Value (USD Million) Forecast by Application, 2020-2035
  • Table 6: Global Market Volume (Metric Tons) Forecast by Application, 2020-2035
  • Table 7: Global Market Value (USD Million) Forecast by Distribution Channels, 2020-2035
  • Table 8: Global Market Volume (Metric Tons) Forecast by Distribution Channels, 2020-2035
  • Table 9: North America Market Value (USD Million) Forecast by Country, 2020-2035
  • Table 10: North America Market Volume (Metric Tons) Forecast by Country, 2020-2035
  • Table 11: North America Market Value (USD Million) Forecast by Formulation Type, 2020-2035
  • Table 12: North America Market Volume (Metric Tons) Forecast by Formulation Type, 2020-2035
  • Table 13: North America Market Value (USD Million) Forecast by Application, 2020-2035
  • Table 14: North America Market Volume (Metric Tons) Forecast by Application, 2020-2035
  • Table 15: North America Market Value (USD Million) Forecast by Distribution Channels, 2020-2035
  • Table 16: North America Market Volume (Metric Tons) Forecast by Distribution Channels, 2020-2035
  • Table 17: Latin America Market Value (USD Million) Forecast by Country, 2020-2035
  • Table 18: Latin America Market Volume (Metric Tons) Forecast by Country, 2020-2035
  • Table 19: Latin America Market Value (USD Million) Forecast by Formulation Type, 2020-2035
  • Table 20: Latin America Market Volume (Metric Tons) Forecast by Formulation Type, 2020-2035
  • Table 21: Latin America Market Value (USD Million) Forecast by Application, 2020-2035
  • Table 22: Latin America Market Volume (Metric Tons) Forecast by Application, 2020-2035
  • Table 23: Latin America Market Value (USD Million) Forecast by Distribution Channels, 2020-2035
  • Table 24: Latin America Market Volume (Metric Tons) Forecast by Distribution Channels, 2020-2035
  • Table 25: Western Europe Market Value (USD Million) Forecast by Country, 2020-2035
  • Table 26: Western Europe Market Volume (Metric Tons) Forecast by Country, 2020-2035
  • Table 27: Western Europe Market Value (USD Million) Forecast by Formulation Type, 2020-2035
  • Table 28: Western Europe Market Volume (Metric Tons) Forecast by Formulation Type, 2020-2035
  • Table 29: Western Europe Market Value (USD Million) Forecast by Application, 2020-2035
  • Table 30: Western Europe Market Volume (Metric Tons) Forecast by Application, 2020-2035
  • Table 31: Western Europe Market Value (USD Million) Forecast by Distribution Channels, 2020-2035
  • Table 32: Western Europe Market Volume (Metric Tons) Forecast by Distribution Channels, 2020-2035
  • Table 33: Eastern Europe Market Value (USD Million) Forecast by Country, 2020-2035
  • Table 34: Eastern Europe Market Volume (Metric Tons) Forecast by Country, 2020-2035
  • Table 35: Eastern Europe Market Value (USD Million) Forecast by Formulation Type, 2020-2035
  • Table 36: Eastern Europe Market Volume (Metric Tons) Forecast by Formulation Type, 2020-2035
  • Table 37: Eastern Europe Market Value (USD Million) Forecast by Application, 2020-2035
  • Table 38: Eastern Europe Market Volume (Metric Tons) Forecast by Application, 2020-2035
  • Table 39: Eastern Europe Market Value (USD Million) Forecast by Distribution Channels, 2020-2035
  • Table 40: Eastern Europe Market Volume (Metric Tons) Forecast by Distribution Channels, 2020-2035
  • Table 41: East Asia Market Value (USD Million) Forecast by Country, 2020-2035
  • Table 42: East Asia Market Volume (Metric Tons) Forecast by Country, 2020-2035
  • Table 43: East Asia Market Value (USD Million) Forecast by Formulation Type, 2020-2035
  • Table 44: East Asia Market Volume (Metric Tons) Forecast by Formulation Type, 2020-2035
  • Table 45: East Asia Market Value (USD Million) Forecast by Application, 2020-2035
  • Table 46: East Asia Market Volume (Metric Tons) Forecast by Application, 2020-2035
  • Table 47: East Asia Market Value (USD Million) Forecast by Distribution Channels, 2020-2035
  • Table 48: East Asia Market Volume (Metric Tons) Forecast by Distribution Channels, 2020-2035
  • Table 49: South Asia & Pacific Market Value (USD Million) Forecast by Country, 2020-2035
  • Table 50: South Asia & Pacific Market Volume (Metric Tons) Forecast by Country, 2020-2035
  • Table 51: South Asia & Pacific Market Value (USD Million) Forecast by Formulation Type, 2020-2035
  • Table 52: South Asia & Pacific Market Volume (Metric Tons) Forecast by Formulation Type, 2020-2035
  • Table 53: South Asia & Pacific Market Value (USD Million) Forecast by Application, 2020-2035
  • Table 54: South Asia & Pacific Market Volume (Metric Tons) Forecast by Application, 2020-2035
  • Table 55: South Asia & Pacific Market Value (USD Million) Forecast by Distribution Channels, 2020-2035
  • Table 56: South Asia & Pacific Market Volume (Metric Tons) Forecast by Distribution Channels, 2020-2035
  • Table 57: Middle East and Africa Market Value (USD Million) Forecast by Country, 2020-2035
  • Table 58: Middle East and Africa Market Volume (Metric Tons) Forecast by Country, 2020-2035
  • Table 59: Middle East and Africa Market Value (USD Million) Forecast by Formulation Type, 2020-2035
  • Table 60: Middle East and Africa Market Volume (Metric Tons) Forecast by Formulation Type, 2020-2035
  • Table 61: Middle East and Africa Market Value (USD Million) Forecast by Application, 2020-2035
  • Table 62: Middle East and Africa Market Volume (Metric Tons) Forecast by Application, 2020-2035
  • Table 63: Middle East and Africa Market Value (USD Million) Forecast by Distribution Channels, 2020-2035
  • Table 64: Middle East and Africa Market Volume (Metric Tons) Forecast by Distribution Channels, 2020-2035

List of Figures

  • Figure 1: Global Market Volume (Metric Tons) Forecast 2020-2035
  • Figure 2: Global Market Pricing Analysis
  • Figure 3: Global Market Value (USD Million) Forecast 2020-2035
  • Figure 4: Global Market Value Share and BPS Analysis by Formulation Type, 2025 and 2035
  • Figure 5: Global Market Y-o-Y Growth Comparison by Formulation Type, 2025-2035
  • Figure 6: Global Market Attractiveness Analysis by Formulation Type
  • Figure 7: Global Market Value Share and BPS Analysis by Application, 2025 and 2035
  • Figure 8: Global Market Y-o-Y Growth Comparison by Application, 2025-2035
  • Figure 9: Global Market Attractiveness Analysis by Application
  • Figure 10: Global Market Value Share and BPS Analysis by Distribution Channels, 2025 and 2035
  • Figure 11: Global Market Y-o-Y Growth Comparison by Distribution Channels, 2025-2035
  • Figure 12: Global Market Attractiveness Analysis by Distribution Channels
  • Figure 13: Global Market Value (USD Million) Share and BPS Analysis by Region, 2025 and 2035
  • Figure 14: Global Market Y-o-Y Growth Comparison by Region, 2025-2035
  • Figure 15: Global Market Attractiveness Analysis by Region
  • Figure 16: North America Market Incremental $ Opportunity, 2025-2035
  • Figure 17: Latin America Market Incremental $ Opportunity, 2025-2035
  • Figure 18: Western Europe Market Incremental $ Opportunity, 2025-2035
  • Figure 19: Eastern Europe Market Incremental $ Opportunity, 2025-2035
  • Figure 20: East Asia Market Incremental $ Opportunity, 2025-2035
  • Figure 21: South Asia & Pacific Market Incremental $ Opportunity, 2025-2035
  • Figure 22: Middle East and Africa Market Incremental $ Opportunity, 2025-2035
  • Figure 23: North America Market Value Share and BPS Analysis by Country, 2025 and 2035
  • Figure 24: North America Market Value Share and BPS Analysis by Formulation Type, 2025 and 2035
  • Figure 25: North America Market Y-o-Y Growth Comparison by Formulation Type, 2025-2035
  • Figure 26: North America Market Attractiveness Analysis by Formulation Type
  • Figure 27: North America Market Value Share and BPS Analysis by Application, 2025 and 2035
  • Figure 28: North America Market Y-o-Y Growth Comparison by Application, 2025-2035
  • Figure 29: North America Market Attractiveness Analysis by Application
  • Figure 30: North America Market Value Share and BPS Analysis by Distribution Channels, 2025 and 2035
  • Figure 31: North America Market Y-o-Y Growth Comparison by Distribution Channels, 2025-2035
  • Figure 32: North America Market Attractiveness Analysis by Distribution Channels
  • Figure 33: Latin America Market Value Share and BPS Analysis by Country, 2025 and 2035
  • Figure 34: Latin America Market Value Share and BPS Analysis by Formulation Type, 2025 and 2035
  • Figure 35: Latin America Market Y-o-Y Growth Comparison by Formulation Type, 2025-2035
  • Figure 36: Latin America Market Attractiveness Analysis by Formulation Type
  • Figure 37: Latin America Market Value Share and BPS Analysis by Application, 2025 and 2035
  • Figure 38: Latin America Market Y-o-Y Growth Comparison by Application, 2025-2035
  • Figure 39: Latin America Market Attractiveness Analysis by Application
  • Figure 40: Latin America Market Value Share and BPS Analysis by Distribution Channels, 2025 and 2035
  • Figure 41: Latin America Market Y-o-Y Growth Comparison by Distribution Channels, 2025-2035
  • Figure 42: Latin America Market Attractiveness Analysis by Distribution Channels
  • Figure 43: Western Europe Market Value Share and BPS Analysis by Country, 2025 and 2035
  • Figure 44: Western Europe Market Value Share and BPS Analysis by Formulation Type, 2025 and 2035
  • Figure 45: Western Europe Market Y-o-Y Growth Comparison by Formulation Type, 2025-2035
  • Figure 46: Western Europe Market Attractiveness Analysis by Formulation Type
  • Figure 47: Western Europe Market Value Share and BPS Analysis by Application, 2025 and 2035
  • Figure 48: Western Europe Market Y-o-Y Growth Comparison by Application, 2025-2035
  • Figure 49: Western Europe Market Attractiveness Analysis by Application
  • Figure 50: Western Europe Market Value Share and BPS Analysis by Distribution Channels, 2025 and 2035
  • Figure 51: Western Europe Market Y-o-Y Growth Comparison by Distribution Channels, 2025-2035
  • Figure 52: Western Europe Market Attractiveness Analysis by Distribution Channels
  • Figure 53: Eastern Europe Market Value Share and BPS Analysis by Country, 2025 and 2035
  • Figure 54: Eastern Europe Market Value Share and BPS Analysis by Formulation Type, 2025 and 2035
  • Figure 55: Eastern Europe Market Y-o-Y Growth Comparison by Formulation Type, 2025-2035
  • Figure 56: Eastern Europe Market Attractiveness Analysis by Formulation Type
  • Figure 57: Eastern Europe Market Value Share and BPS Analysis by Application, 2025 and 2035
  • Figure 58: Eastern Europe Market Y-o-Y Growth Comparison by Application, 2025-2035
  • Figure 59: Eastern Europe Market Attractiveness Analysis by Application
  • Figure 60: Eastern Europe Market Value Share and BPS Analysis by Distribution Channels, 2025 and 2035
  • Figure 61: Eastern Europe Market Y-o-Y Growth Comparison by Distribution Channels, 2025-2035
  • Figure 62: Eastern Europe Market Attractiveness Analysis by Distribution Channels
  • Figure 63: East Asia Market Value Share and BPS Analysis by Country, 2025 and 2035
  • Figure 64: East Asia Market Value Share and BPS Analysis by Formulation Type, 2025 and 2035
  • Figure 65: East Asia Market Y-o-Y Growth Comparison by Formulation Type, 2025-2035
  • Figure 66: East Asia Market Attractiveness Analysis by Formulation Type
  • Figure 67: East Asia Market Value Share and BPS Analysis by Application, 2025 and 2035
  • Figure 68: East Asia Market Y-o-Y Growth Comparison by Application, 2025-2035
  • Figure 69: East Asia Market Attractiveness Analysis by Application
  • Figure 70: East Asia Market Value Share and BPS Analysis by Distribution Channels, 2025 and 2035
  • Figure 71: East Asia Market Y-o-Y Growth Comparison by Distribution Channels, 2025-2035
  • Figure 72: East Asia Market Attractiveness Analysis by Distribution Channels
  • Figure 73: South Asia & Pacific Market Value Share and BPS Analysis by Country, 2025 and 2035
  • Figure 74: South Asia & Pacific Market Value Share and BPS Analysis by Formulation Type, 2025 and 2035
  • Figure 75: South Asia & Pacific Market Y-o-Y Growth Comparison by Formulation Type, 2025-2035
  • Figure 76: South Asia & Pacific Market Attractiveness Analysis by Formulation Type
  • Figure 77: South Asia & Pacific Market Value Share and BPS Analysis by Application, 2025 and 2035
  • Figure 78: South Asia & Pacific Market Y-o-Y Growth Comparison by Application, 2025-2035
  • Figure 79: South Asia & Pacific Market Attractiveness Analysis by Application
  • Figure 80: South Asia & Pacific Market Value Share and BPS Analysis by Distribution Channels, 2025 and 2035
  • Figure 81: South Asia & Pacific Market Y-o-Y Growth Comparison by Distribution Channels, 2025-2035
  • Figure 82: South Asia & Pacific Market Attractiveness Analysis by Distribution Channels
  • Figure 83: Middle East and Africa Market Value Share and BPS Analysis by Country, 2025 and 2035
  • Figure 84: Middle East and Africa Market Value Share and BPS Analysis by Formulation Type, 2025 and 2035
  • Figure 85: Middle East and Africa Market Y-o-Y Growth Comparison by Formulation Type, 2025-2035
  • Figure 86: Middle East and Africa Market Attractiveness Analysis by Formulation Type
  • Figure 87: Middle East and Africa Market Value Share and BPS Analysis by Application, 2025 and 2035
  • Figure 88: Middle East and Africa Market Y-o-Y Growth Comparison by Application, 2025-2035
  • Figure 89: Middle East and Africa Market Attractiveness Analysis by Application
  • Figure 90: Middle East and Africa Market Value Share and BPS Analysis by Distribution Channels, 2025 and 2035
  • Figure 91: Middle East and Africa Market Y-o-Y Growth Comparison by Distribution Channels, 2025-2035
  • Figure 92: Middle East and Africa Market Attractiveness Analysis by Distribution Channels
  • Figure 93: Global Market - Tier Structure Analysis
  • Figure 94: Global Market - Company Share Analysis

Frequently Asked Questions

How big is the pharma grade synthetic camphor market in 2025?

The global pharma grade synthetic camphor market is estimated to be valued at USD 466.4 million in 2025.

What will be the size of the pharma grade synthetic camphor market in 2035?

The market size for pharma grade synthetic camphor is projected to reach USD 677.2 million by 2035.

How much will be the pharma grade synthetic camphor market growth between 2025 and 2035?

The pharma grade synthetic camphor market is expected to grow at a 3.8% CAGR between 2025 and 2035.

Which formulation type segment is projected to lead in the pharma grade synthetic camphor market in 2025?

The topical formulation segment is projected to lead in the pharma grade synthetic camphor market with 73% market share in 2025.

Which application segment to contribute significant share in the pharma grade synthetic camphor market in 2025?

In terms of application, the respiratory disorders segment is expected to command 27% share in the pharma grade synthetic camphor market in 2025.

Explore Similar Insights

Future Market Insights

Pharma Grade Synthetic Camphor Market

Chat With

MaRIA

Hi There, I am MaRIA, Your Market Research Intelligence Assistant. How may I help you?