Reports

- Global Locations -

Headquarters

Future Market Insights, Inc.

Christiana Corporate, 200
Continental Drive, Suite 401,
Newark, Delaware - 19713,
United States

T: +1-845-579-5705

Americas

Future Market Insights, Inc.

616 Corporate Way, Suite 2-9018,
Valley Cottage, NY 10989, United States

T: +1-347-918-3531

MEA

Future Market Insights

1602-6 Jumeirah Bay X2 Tower, Plot No: JLT-PH2-X2A,
Jumeirah Lakes Towers, Dubai,
United Arab Emirates

Europe

Future Market Insights

3rd Floor, 207 Regent Street,
W1B 3HH London
United Kingdom

T: + 44 (0) 20 8123 9659
D: +44 (0) 20 3287 4268

Asia Pacific

Future Market Insights

IndiaLand Global Tech Park, Unit UG-1, Behind Grand HighStreet, Phase 1, Hinjawadi, MH, Pune – 411057, India

Market Snapshot (2022 to 2032)

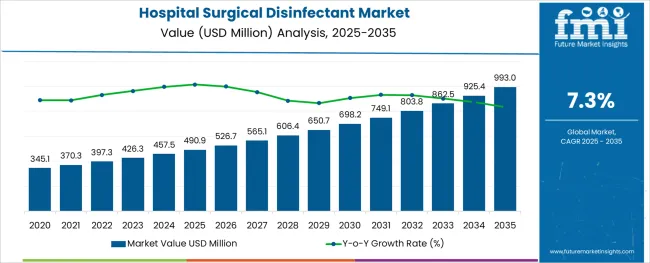
Newly-released Hospital Surgical Disinfectant market analysis report by Future Market Insights shows that global sales of the Hospital Surgical Disinfectant market in 2021 were held at US$ 370.3 million. With 7.3%, the projected market growth from 2022 to 2032 is expected to be significantly higher than the historical growth. The absolute dollar opportunity for the Hospital Surgical Disinfectant market is projected at US$ 401.5 million.

Attribute Details
Global Hospital Surgical Disinfectant Market (2022) US$ 395.1 million
Global Hospital Surgical Disinfectant Market (2032) US$ 796.6 million
Global Hospital Surgical Disinfectant Market CAGR (2022 to 2032) 7.3%
The USA Hospital Surgical Disinfectant Market (2022) US$ 117.3 million
Key Companies Profiled
  • 3M
  • Ecolab
  • Becton, Dickinson and Company (BD)
  • Sage Products LLC
  • B. Braun Melsungen AG
  • Johnson & Johnson
  • Kimberly-Clark Corporation
  • Cardinal Health
  • The Clorox Company
  • Schulke & Mayr GmbH

Don't pay for what you don't need

Customize your report by selecting specific countries or regions and save 30%!

Revenue of Hospital Surgical Disinfectant market from 2017 to 2021 Compared to Demand Outlook for 2022 to 2032

As per the Hospital Surgical Disinfectant market research by Future Market Insights - a market research and competitive intelligence provider, historically, from 2017 to 2021, the market value of the Hospital Surgical Disinfectant market increased at around 6.3% CAGR, wherein, North America held a significant share in the global market.

Healthcare-associated infections (HAI) are a serious issue for both patients and healthcare staff worldwide. With an increase in the number of hospitalizations and HAIs globally, the demand for surgical tool disinfection is increasing to reduce the risk of microbial contamination. According to WHO, hundreds of millions of patients worldwide get HCAIs each year. In rich nations, 7 out of every 100 hospitalized patients have at least one HAI, whereas 10 in underdeveloped countries have at least one HAI. Owing to this, the Hospital Surgical Disinfectant market is projected to grow at a CAGR of 7.3% over the coming 10 years.

What will be the growth prospects of Hospital Surgical Disinfectant market?

According to the Healthcare Cost and Utilization Project (HCUP), approximately 9 million operations were done in ambulatory care settings in the United States in 2020. In the event of operations, one of the most important needs in healthcare facilities is the use of surgical disinfection solutions. These products are more typically used in hospitals and other medical settings to lower the risk of infection during surgery and other operations because they prevent or limit the development of germs on the skin. As a result, such occurrences are projected to boost the market throughout the forecast period.

Surgical and diagnostic procedures may be required, which may require medical consumables Surgical Disinfectant. Hospitalization rates are predicted to rise as the frequency of chronic illnesses such as cardiovascular disease, cancer, diabetes, and other autoimmune disorders rises. The adoption of unhealthy and sedentary lifestyles, as well as antibiotic resistance, are the key factors to the increased prevalence of chronic diseases. According to the National Center for Health Statistics, an estimated 157 million Americans suffer from chronic sickness, with 81 million suffering from several conditions, as of 2018. Because of the rising frequency of chronic diseases, hospital admissions have skyrocketed. Surgical disinfectants are needed in hospitals to keep humans and non-living materials germ-free. Such factors are predicted to drive demand for hospital surgical disinfectants throughout the forecast period.

Sabyasachi Ghosh
Sabyasachi Ghosh

Principal Consultant

Talk to Analyst

Find your sweet spots for generating winning opportunities in this market.

Which Region is projected to offer the Largest Opportunity for Hospital Surgical Disinfectant market?

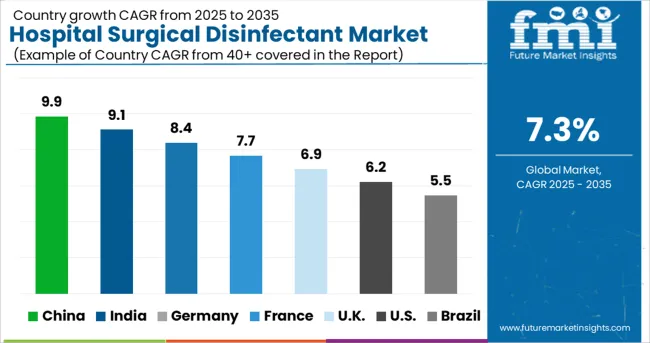
Hospital Surgical Disinfectant market revenue is estimated to expand at the fastest rate in APAC from 2022 to 2032, with around 8.9% and 9.9% projected growth rates in China and Japan, respectively. Some of the significant corporations, that have manufacturing units in all major APAC locations, have begun to extend their production units to other APAC sites in order to boost the speed of distribution. While this suggests a shift in global geographical diversification, it represents a substantial potential for the market.

Hospital-acquired illnesses and advancements in healthcare infrastructure contribute to the increased use of hospital surgical disinfectants. Furthermore, regulatory regulations aimed at providing safe and high-quality healthcare services are expected to drive market expansion throughout the projection period.

For example, the Chinese regulatory authority, the National Medical Products Administration, declared that it will expedite the registration of medical disinfectants that fulfill applicable requirements in the United States, Japan, and the European Union. As a result, these factors are projected to drive market expansion throughout the forecast period. Furthermore, rising illnesses and surgeries in the region are likely to drive market expansion even further. The area's highest number of procedures and surgeries is also propelling the industry in this region. Medical tourism is popular in Asian nations such as China, India, and Thailand.
Country-wise Analysis

The USA Hospital Surgical Disinfectant Market

The USA dominated the North America Hospital Surgical Disinfectant market and is poised to reach USD$ 220.3 million by 2032. The favorable factors in USA market growth are reimbursement and technological advancement facilities in the country. The growing number of hospital admission and the ease of medicare reimbursement policy favors the market growth.

In the United States, according to the American Hospital Association, there were 6,090 community hospitals, 208 Federal Government hospitals, and 625 nonfederal psychiatric hospitals. The number of admissions for chronic diseases has significantly increased, raising product demand and accelerating market expansion. The availability of strong transportation and easy access to healthcare facilities are two fundamental contributors to the market expansion.

According to the United States Department of Health and Human Services, 0.4% of the roughly 150 million Americans who get admitted to a hospital on any given day are contaminated by an HAI. The loss of health insurance is likely to cause more people to seek medical care, along with the number of snakebites, dengue fever, tuberculosis, malaria, and typhoid, as well as the anticipated increase in cases of COVID-19 in the USA, which are predicted to expand the market.

The United Kingdom Hospital Surgical Disinfectant Market

The market in the United Kingdom is projected to grow from US$ 17.7 million in 2022 to reach a valuation of US$ 41.1 million by 2032. From 2022 to 2032, the market is projected to garner an absolute dollar opportunity of US$ 23.4 million, growing at a CAGR of 8.9%.

Japan Hospital Surgical Disinfectant Market

The market in Japan is projected to reach a valuation of US$ 32.6 million by 2032, growing at a CAGR of 9.9% from 2022 to 2032. The market in Japan is likely to garner an absolute dollar opportunity of US$ 19.7 million from 2022 to 2032.

South Korea Hospital Surgical Disinfectant Market

The market in South Korea is projected to reach a valuation of US$ 13.3 million by 2032, growing at a CAGR of 5.8%. The market in the country will witness an absolute dollar opportunity of US$ 5.8 million from 2022 to 2032.

Get the data you need at a Fraction of the cost

Personalize your report by choosing insights you need
and save 40%!

Category-wise Insights

Which Hospital Surgical Disinfectant product has been capturing higher demand?

The market for hydrogen peroxide solutions is expected to grow at 5.8% CAGR during the forecast period. The rising demand for hydrogen peroxide-based solutions to be merged with other additives, such as iodine and alcohol, is stimulating market development. In addition, the demand for hydrogen peroxide has grown as a result of a rise in the demand for hand wash products, such as sanitizers, which are efficient against many germs.

To increase knowledge and use among patients of surgical disinfectants prior to and during surgical procedures, the CDC recommends that patients shower with a detergent containing hydrogen peroxide prior to undergoing treatment.

Competitive Analysis

Corporations are expanding their corporate footprint in emerging areas through strategic alliances and agreements, as well as focusing on improving distribution networks. This is expected to boost the expansion of the high-level disinfection services market.

The key vendors in the global market are 3M, Ecolab, Becton, Dickinson and Company (BD), Sage Products LLC, B. Braun Melsungen AG, Johnson & Johnson, Kimberly-Clark Corporation, Cardinal Health, The Clorox Company, Schulke & Mayr GmbH, among others.

Some of the recent development in the Hospital Surgical Disinfectant market are:

  • In March 2021, Halsted is reported to have developed the latex glove to protect the hands of his scrub nurse, Caroline Hampton, from the harsh antiseptics in widespread use as disinfectants.
  • In February 2019 Schulke & Mayr struck a distribution deal with DKSH, a key service provider, DKSH will sell and promote a wide variety of Schulke's disinfection products in China under the terms of this agreement.

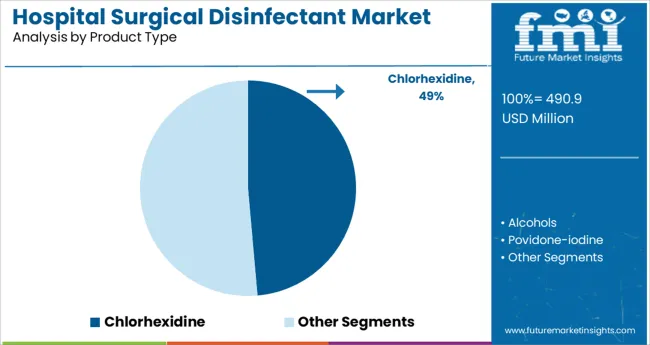
Market Segments Covered in Hospital Surgical Disinfectant Industry Analysis

By Product Type:

  • Chlorhexidine
  • Alcohols
  • Povidone-iodine
  • Octenidine
  • Hydrogen Peroxide
  • Other Product Types

By Region:

  • North America
  • Latin America
  • Europe
  • APAC
  • Middle East and Africa (MEA)

Frequently Asked Questions

How much is the current worth of the Hospital Surgical Disinfectant market?

The global market is worth more than US$ 395.1 million at present.

What is the sales forecast for Hospital Surgical Disinfectant market?

The value of the Hospital Surgical Disinfectant market is projected to increase at a CAGR of around 7.3% from 2022 to 2032.

What was the last 5 year’s market CAGR?

The value of the Hospital Surgical Disinfectant market increased at a CAGR of around 6.3% from 2017 to 2021.

Which are the top 5 countries driving demand for Hospital Surgical Disinfectant?

The top 5 countries driving demand for the market are the USA, China, The United Kingdom, Japan, and South Korea.

What is the outlook for the market in North America?

The value of the Hospital Surgical Disinfectant market is projected to increase at a CAGR of around 6.6% from 2022 to 2032 in North America.

At what percentage is sales of Hospital Surgical Disinfectant going to register growth in the USA?

The US market for Hospital Surgical disinfectants is projected to expand at a CAGR of around 6.5% during 2022 to 2032.

Who are the key players for Hospital Surgical Disinfectant product?

The major companies are 3M, Ecolab, Sage Products LLC, B. Braun Melsungen AG, and Kimberly-Clark Corporation.

Table of Content

1. Executive Summary | Hospital Surgical Disinfectant Market

    1.1. Global Market Outlook

    1.2. Summary of Statistics

    1.3. Key Market Characteristics & Attributes

    1.4. Analysis and Recommendations

2. Market Overview

    2.1. Market Coverage / Taxonomy

    2.2. Market Definition / Scope / Limitations

3. Market Risks and Trends Assessment

    3.1. Risk Assessment

        3.1.1. COVID-19 Crisis and Impact on Demand

        3.1.2. COVID-19 Impact Benchmark with Previous Crisis

        3.1.3. Impact on Market Value (US$ million)

        3.1.4. Assessment by Key Countries

        3.1.5. Assessment by Key Market Segments

        3.1.6. Action Points and Recommendation for Suppliers

    3.2. Key Trends Impacting the Market

    3.3. Formulation and Product Development Trends

4. Market Background and Foundation Data Points

    4.1. Global Market (US$ million)

    4.2. Market Opportunity Assessment (US$ million)

        4.2.1. Total Available Market

        4.2.2. Product Typeable Addressable Market

        4.2.3. Product Typeable Obtainable Market

    4.3. Market Scenario Forecast

        4.3.1. Demand in optimistic Scenario

        4.3.2. Demand in Likely Scenario

        4.3.3. Demand in Conservative Scenario

    4.4. Investment Feasibility Analysis

        4.4.1. Investment in Established Markets

            4.4.1.1. In Short Term

            4.4.1.2. In Long Term

        4.4.2. Investment in Emerging Markets

            4.4.2.1. In Short Term

            4.4.2.2. In Long Term

    4.5. Forecast Factors - Relevance & Impact

        4.5.1. Top Companies Historical Growth

        4.5.2. Global Market Growth

        4.5.3. Adoption Rate, by Country

    4.6. Market Dynamics

        4.6.1. Market Driving Factors and Impact Assessment

        4.6.2. Prominent Market Challenges and Impact Assessment

        4.6.3. Market Opportunities

        4.6.4. Prominent Trends in the Global Market & Their Impact Assessment

5. Key Success Factors

    5.1. Manufacturers’ Focus on Low Penetration High Growth Markets

    5.2. Banking on with Segments High Incremental Opportunity

    5.3. Peer Benchmarking

6. Global Market Demand Analysis 2017 to 2021 and Forecast, 2022 to 2032

    6.1. Historical Market Analysis, 2017 to 2021

    6.2. Current and Future Market Projections, 2022 to 2032

    6.3. Y-o-Y Growth Trend Analysis

7. Global Market Value Analysis 2017 to 2021 and Forecast, 2022 to 2032

    7.1. Historical Market Value (US$ million) Analysis, 2017 to 2021

    7.2. Current and Future Market Value (US$ million) Projections, 2022 to 2032

        7.2.1. Y-o-Y Growth Trend Analysis

        7.2.2. Absolute $ Opportunity Analysis

8. Global Market Analysis 2017 to 2021 and Forecast 2022 to 2032, By Product Type

    8.1. Introduction / Key Findings

    8.2. Historical Market Size (US$ million) Analysis By Product Type, 2017 to 2021

    8.3. Current and Future Market Size (US$ million) Analysis and Forecast By Product Type, 2022 to 2032

        8.3.1. Chlorhexidine

        8.3.2. Alcohols

        8.3.3. Povidone-iodine

        8.3.4. Octenidine

        8.3.5. Hydrogen Peroxide

        8.3.6. Other Product Types

    8.4. Market Attractiveness Analysis By Product Type

9. Global Market Analysis 2017 to 2021 and Forecast 2022 to 2032, By Region

    9.1. Introduction

    9.2. Historical Market Size (US$ million) Analysis By Region, 2017 to 2021

    9.3. Current Market Size (US$ million) & Analysis and Forecast By Region, 2022 to 2032

        9.3.1. North America

        9.3.2. Latin America

        9.3.3. Europe

        9.3.4. Asia Pacific

        9.3.5. Middle East and Africa (MEA)

    9.4. Market Attractiveness Analysis By Region

10. North America Market Analysis 2017 to 2021 and Forecast 2022 to 2032

    10.1. Introduction

    10.2. Pricing Analysis

    10.3. Historical Market Value (US$ million) Trend Analysis By Market Taxonomy, 2017 to 2021

    10.4. Market Value (US$ million) & Forecast By Market Taxonomy, 2022 to 2032

        10.4.1. By Country

            10.4.1.1. The USA

            10.4.1.2. Canada

        10.4.2. By Product Type

    10.5. Market Attractiveness Analysis

        10.5.1. By Country

        10.5.2. By Product Type

11. Latin America Market Analysis 2017 to 2021 and Forecast 2022 to 2032

    11.1. Introduction

    11.2. Pricing Analysis

    11.3. Historical Market Value (US$ million) Trend Analysis By Market Taxonomy, 2017 to 2021

    11.4. Market Value (US$ million) & Forecast By Market Taxonomy, 2022 to 2032

        11.4.1. By Country

            11.4.1.1. Brazil

            11.4.1.2. Mexico

            11.4.1.3. Rest of Latin America

        11.4.2. By Product Type

    11.5. Market Attractiveness Analysis

        11.5.1. By Country

        11.5.2. By Product Type

12. Europe Market Analysis 2017 to 2021 and Forecast 2022 to 2032

    12.1. Introduction

    12.2. Pricing Analysis

    12.3. Historical Market Value (US$ million) Trend Analysis By Market Taxonomy, 2017 to 2021

    12.4. Market Value (US$ million) & Forecast By Market Taxonomy, 2022 to 2032

        12.4.1. By Country

            12.4.1.1. Germany

            12.4.1.2. France

            12.4.1.3. The United Kingdom

            12.4.1.4. Italy

            12.4.1.5. Benelux

            12.4.1.6. Nordic Countries

            12.4.1.7. Rest of Europe

        12.4.2. By Product Type

    12.5. Market Attractiveness Analysis

        12.5.1. By Country

        12.5.2. By Product Type

13. Asia Pacific Market Analysis 2017 to 2021 and Forecast 2022 to 2032

    13.1. Introduction

    13.2. Pricing Analysis

    13.3. Historical Market Value (US$ million) Trend Analysis By Market Taxonomy, 2017 to 2021

    13.4. Market Value (US$ million) & Forecast By Market Taxonomy, 2022 to 2032

        13.4.1. By Country

            13.4.1.1. China

            13.4.1.2. Japan

            13.4.1.3. South Korea

            13.4.1.4. Rest of Asia Pacific

        13.4.2. By Product Type

    13.5. Market Attractiveness Analysis

        13.5.1. By Country

        13.5.2. By Product Type

14. Middle East and Africa Market Analysis 2017 to 2021 and Forecast 2022 to 2032

    14.1. Introduction

    14.2. Pricing Analysis

    14.3. Historical Market Value (US$ million) Trend Analysis By Market Taxonomy, 2017 to 2021

    14.4. Market Value (US$ million) & Forecast By Market Taxonomy, 2022 to 2032

        14.4.1. By Country

            14.4.1.1. GCC Countries

            14.4.1.2. South Africa

            14.4.1.3. Turkey

            14.4.1.4. Rest of Middle East and Africa

        14.4.2. By Product Type

    14.5. Market Attractiveness Analysis

        14.5.1. By Country

        14.5.2. By Product Type

15. Key Countries Market Analysis 2017 to 2021 and Forecast 2022 to 2032

    15.1. Introduction

        15.1.1. Market Value Proportion Analysis, By Key Countries

        15.1.2. Global Vs. Country Growth Comparison

    15.2. US Market Analysis

        15.2.1. Value Proportion Analysis by Market Taxonomy

        15.2.2. Value & Analysis and Forecast by Market Taxonomy, 2017 to 2032

            15.2.2.1. By Product Type

    15.3. Canada Market Analysis

        15.3.1. Value Proportion Analysis by Market Taxonomy

        15.3.2. Value & Analysis and Forecast by Market Taxonomy, 2017 to 2032

            15.3.2.1. By Product Type

    15.4. Mexico Market Analysis

        15.4.1. Value Proportion Analysis by Market Taxonomy

        15.4.2. Value & Analysis and Forecast by Market Taxonomy, 2017 to 2032

            15.4.2.1. By Product Type

    15.5. Brazil Market Analysis

        15.5.1. Value Proportion Analysis by Market Taxonomy

        15.5.2. Value & Analysis and Forecast by Market Taxonomy, 2017 to 2032

            15.5.2.1. By Product Type

    15.6. Germany Market Analysis

        15.6.1. Value Proportion Analysis by Market Taxonomy

        15.6.2. Value & Analysis and Forecast by Market Taxonomy, 2017 to 2032

            15.6.2.1. By Product Type

    15.7. France Market Analysis

        15.7.1. Value Proportion Analysis by Market Taxonomy

        15.7.2. Value & Analysis and Forecast by Market Taxonomy, 2017 to 2032

            15.7.2.1. By Product Type

    15.8. Italy Market Analysis

        15.8.1. Value Proportion Analysis by Market Taxonomy

        15.8.2. Value & Analysis and Forecast by Market Taxonomy, 2017 to 2032

            15.8.2.1. By Product Type

    15.9. BENELUX Market Analysis

        15.9.1. Value Proportion Analysis by Market Taxonomy

        15.9.2. Value & Analysis and Forecast by Market Taxonomy, 2017 to 2032

            15.9.2.1. By Product Type

    15.10. UK Market Analysis

        15.10.1. Value Proportion Analysis by Market Taxonomy

        15.10.2. Value & Analysis and Forecast by Market Taxonomy, 2017 to 2032

            15.10.2.1. By Product Type

    15.11. Nordic Countries Market Analysis

        15.11.1. Value Proportion Analysis by Market Taxonomy

        15.11.2. Value & Analysis and Forecast by Market Taxonomy, 2017 to 2032

            15.11.2.1. By Product Type

    15.12. China Market Analysis

        15.12.1. Value Proportion Analysis by Market Taxonomy

        15.12.2. Value & Analysis and Forecast by Market Taxonomy, 2017 to 2032

            15.12.2.1. By Product Type

    15.13. Japan Market Analysis

        15.13.1. Value Proportion Analysis by Market Taxonomy

        15.13.2. Value & Analysis and Forecast by Market Taxonomy, 2017 to 2032

            15.13.2.1. By Product Type

    15.14. South Korea Market Analysis

        15.14.1. Value Proportion Analysis by Market Taxonomy

        15.14.2. Value & Analysis and Forecast by Market Taxonomy, 2017 to 2032

            15.14.2.1. By Product Type

    15.15. GCC Countries Market Analysis

        15.15.1. Value Proportion Analysis by Market Taxonomy

        15.15.2. Value & Analysis and Forecast by Market Taxonomy, 2017 to 2032

            15.15.2.1. By Product Type

    15.16. South Africa Market Analysis

        15.16.1. Value Proportion Analysis by Market Taxonomy

        15.16.2. Value & Analysis and Forecast by Market Taxonomy, 2017 to 2032

            15.16.2.1. By Product Type

    15.17. Turkey Market Analysis

        15.17.1. Value Proportion Analysis by Market Taxonomy

        15.17.2. Value & Analysis and Forecast by Market Taxonomy, 2017 to 2032

            15.17.2.1. By Product Type

        15.17.3. Competition Landscape and Player Concentration in the Country

16. Market Structure Analysis

    16.1. Market Analysis by Tier of Companies

    16.2. Market Concentration

    16.3. Market Share Analysis of Top Players

    16.4. Market Presence Analysis

        16.4.1. By Regional footprint of Players

        16.4.2. Product footprint by Players

17. Competition Analysis

    17.1. Competition Dashboard

    17.2. Competition Benchmarking

    17.3. Competition Deep Dive

        17.3.1. 3M

            17.3.1.1. Overview

            17.3.1.2. Product Portfolio

            17.3.1.3. Sales Footprint

            17.3.1.4. Strategy Overview

        17.3.2. ECOLAB

            17.3.2.1. Overview

            17.3.2.2. Product Portfolio

            17.3.2.3. Sales Footprint

            17.3.2.4. Strategy Overview

        17.3.3. BD

            17.3.3.1. Overview

            17.3.3.2. Product Portfolio

            17.3.3.3. Sales Footprint

            17.3.3.4. Strategy Overview

        17.3.4. SAGE PRODUCTS LLC

            17.3.4.1. Overview

            17.3.4.2. Product Portfolio

            17.3.4.3. Sales Footprint

            17.3.4.4. Strategy Overview

        17.3.5. B. BRAUN MELSUNGEN AG

            17.3.5.1. Overview

            17.3.5.2. Product Portfolio

            17.3.5.3. Sales Footprint

            17.3.5.4. Strategy Overview

        17.3.6. JOHNSON & JOHNSON

            17.3.6.1. Overview

            17.3.6.2. Product Portfolio

            17.3.6.3. Sales Footprint

            17.3.6.4. Strategy Overview

        17.3.7. KIMBERLY-CLARK CORPORATION

            17.3.7.1. Overview

            17.3.7.2. Product Portfolio

            17.3.7.3. Sales Footprint

            17.3.7.4. Strategy Overview

        17.3.8. CARDINAL HEALTH

            17.3.8.1. Overview

            17.3.8.2. Product Portfolio

            17.3.8.3. Sales Footprint

            17.3.8.4. Strategy Overview

        17.3.9. THE CLOROX COMPANY

            17.3.9.1. Overview

            17.3.9.2. Product Portfolio

            17.3.9.3. Sales Footprint

            17.3.9.4. Strategy Overview

        17.3.10. SCHULKE & MAYR GMBH

            17.3.10.1. Overview

            17.3.10.2. Product Portfolio

            17.3.10.3. Sales Footprint

            17.3.10.4. Strategy Overview

18. Assumptions and Acronyms Used

19. Research Methodology

List of Tables

Table 1: Global Market Value (US$ million), By Product Type, 2017 to 2021

Table 2: Global Market Value (US$ million), By Product Type, 2022 to 2032

Table 3: Global Market, By Region, 2017 to 2021

Table 4: Global Market, By Region, 2022 to 2032

Table 5: North America Market Value (US$ million), By Product Type, 2017 to 2021

Table 6: North America Market Value (US$ million), By Product Type, 2022 to 2032

Table 7: North America Market, By Country, 2017 to 2021

Table 8: North America Market, By Country, 2022 to 2032

Table 9: Latin America Market Value (US$ million), By Product Type, 2017 to 2021

Table 10: Latin America Market Value (US$ million), By Product Type, 2022 to 2032

Table 11: Latin America Market, By Country, 2017 to 2021

Table 12: Latin America Market, By Country, 2022 to 2032

Table 13: Europe Market Value (US$ million), By Product Type, 2017 to 2021

Table 14: Europe Market Value (US$ million), By Product Type, 2022 to 2032

Table 15: Europe Market, By Country, 2017 to 2021

Table 16: Europe Market, By Country, 2022 to 2032

Table 17: Asia Pacific Market Value (US$ million), By Product Type, 2017 to 2021

Table 18: Asia Pacific Market Value (US$ million), By Product Type, 2022 to 2032

Table 19: Asia Pacific Market, By Country, 2017 to 2021

Table 20: Asia Pacific Market, By Country, 2022 to 2032

Table 21: MEA Market Value (US$ million), By Product Type, 2017 to 2021

Table 22: MEA Market Value (US$ million), By Product Type, 2022 to 2032

Table 23: MEA Market, By Country, 2017 to 2021

Table 24: MEA Market, By Country, 2022 to 2032

Table 25: Global Market Incremental $ Opportunity, By Product Type, 2017 to 2021

Table 26: Global Market Incremental $ Opportunity, By Region, 2022 to 2032

Table 27: North America Market Incremental $ Opportunity, By Product Type, 2017 to 2021

Table 28: North America Market Incremental $ Opportunity, By Country, 2022 to 2032

Table 29: Latin America Market Incremental $ Opportunity, By Product Type, 2017 to 2021

Table 30: Latin America Market Incremental $ Opportunity, By Country, 2022 to 2032

Table 31: Europe Market Incremental $ Opportunity, By Product Type, 2017 to 2021

Table 32: Europe Market Incremental $ Opportunity, By Country, 2022 to 2032

Table 33: Asia Pacific Market Incremental $ Opportunity, By Product Type, 2017 to 2021

Table 34: Asia Pacific Market Incremental $ Opportunity, By Country, 2022 to 2032

Table 35: MEA Market Incremental $ Opportunity, By Product Type, 2017 to 2021

Table 36: MEA Market Incremental $ Opportunity, By Country, 2022 to 2032

List of Charts

Figure 1: Global Market Value (US$ million) and Year-on-Year Growth, 2017 to 2032

Figure 2: Global Market Absolute $ Historical Gain (2017 to 2021) and Opportunity (2022 to 2032), US$ million

Figure 3: Global Market Share, By Product Type, 2022 to 2032

Figure 4: Global Market Y-o-Y Growth Projections, By Product Type - 2022 to 2032

Figure 5: Global Market Attractiveness Index, By Product Type - 2022 to 2032

Figure 6: Global Market Share, By Region, 2022 to 2032

Figure 7: Global Market Y-o-Y Growth Projections, By Region - 2022 to 2032

Figure 8: Global Market Attractiveness Index, By Region - 2022 to 2032

Figure 9: North America Market Value (US$ million) and Year-on-Year Growth, 2017 to 2032

Figure 10: North America Market Absolute $ Opportunity Historical (2017 to 2021) and Forecast Period (2022 to 2032), US$ million

Figure 11: North America Market Share, By Product Type, 2022 to 2032

Figure 12: North America Market Y-o-Y Growth Projections, By Product Type - 2022 to 2032

Figure 13: North America Market Attractiveness Index, By Product Type - 2022 to 2032

Figure 14: North America Market Share, By Country, 2022 to 2032

Figure 15: North America Market Y-o-Y Growth Projections, By Country - 2022 to 2032

Figure 16: North America Market Attractiveness Index, By Country - 2022 to 2032

Figure 17: Latin America Market Value (US$ million) and Year-on-Year Growth, 2017 to 2032

Figure 18: Latin America Market Absolute $ Opportunity Historical (2017 to 2021) and Forecast Period (2022 to 2032), US$ million

Figure 19: Latin America Market Share, By Product Type, 2022 to 2032

Figure 20: Latin America Market Y-o-Y Growth Projections, By Product Type - 2022 to 2032

Figure 21: Latin America Market Attractiveness Index, By Product Type - 2022 to 2032

Figure 22: Latin America Market Share, By Country, 2022 to 2032

Figure 23: Latin America Market Y-o-Y Growth Projections, By Country - 2022 to 2032

Figure 24: Latin America Market Attractiveness Index, By Country - 2022 to 2032

Figure 25: Europe Market Value (US$ million) and Year-on-Year Growth, 2017 to 2032

Figure 26: Europe Market Absolute $ Opportunity Historical (2017 to 2021) and Forecast Period (2022 to 2032), US$ million

Figure 27: Europe Market Share, By Product Type, 2022 to 2032

Figure 28: Europe Market Y-o-Y Growth Projections, By Product Type - 2022 to 2032

Figure 29: Europe Market Attractiveness Index, By Product Type - 2022 to 2032

Figure 30: Europe Market Share, By Country, 2022 to 2032

Figure 31: Europe Market Y-o-Y Growth Projections, By Country - 2022 to 2032

Figure 32: Europe Market Attractiveness Index, By Country - 2022 to 2032

Figure 33: MEA Market Value (US$ million) and Year-on-Year Growth, 2017 to 2032

Figure 34: MEA Market Absolute $ Opportunity Historical (2017 to 2021) and Forecast Period (2022 to 2032), US$ million

Figure 35: MEA Market Share, By Product Type, 2022 to 2032

Figure 36: MEA Market Y-o-Y Growth Projections, By Product Type - 2022 to 2032

Figure 37: MEA Market Attractiveness Index, By Product Type - 2022 to 2032

Figure 38: MEA Market Share, By Country, 2022 to 2032

Figure 39: MEA Market Y-o-Y Growth Projections, By Country - 2022 to 2032

Figure 40: MEA Market Attractiveness Index, By Country - 2022 to 2032

Figure 41: Asia Pacific Market Value (US$ million) and Year-on-Year Growth, 2017 to 2032

Figure 42: Asia Pacific Market Absolute $ Opportunity Historical (2017 to 2021) and Forecast Period (2022 to 2032), US$ million

Figure 43: Asia Pacific Market Share, By Product Type, 2022 to 2032

Figure 44: Asia Pacific Market Y-o-Y Growth Projections, By Product Type - 2022 to 2032

Figure 45: Asia Pacific Market Attractiveness Index, By Product Type - 2022 to 2032

Figure 46: Asia Pacific Market Share, By Country, 2022 to 2032

Figure 47: Asia Pacific Market Y-o-Y Growth Projections, By Country - 2022 to 2032

Figure 48: Asia Pacific Market Attractiveness Index, By Country - 2022 to 2032

Figure 49: USA Market Value (US$ million) and Forecast, 2022 to 2032

Figure 50: USA Market Share, By Product Type, 2021

Figure 51: Canada Market Value (US$ million) and Forecast, 2022 to 2032

Figure 52: Canada Market Share, By Product Type, 2021

Figure 53: Brazil Market Value (US$ million) and Forecast, 2022 to 2032

Figure 54: Brazil Market Share, By Product Type, 2021

Figure 55: Mexico Market Value (US$ million) and Forecast, 2022 to 2032

Figure 56: Mexico Market Share, By Product Type, 2021

Figure 57: Germany Market Value (US$ million) and Forecast, 2022 to 2032

Figure 58: Germany Market Share, By Product Type, 2021

Figure 59: The United Kingdom Market Value (US$ million) and Forecast, 2022 to 2032

Figure 60: The United Kingdom Market Share, By Product Type, 2021

Figure 61: France Market Value (US$ million) and Forecast, 2022 to 2032

Figure 62: France Market Share, By Product Type, 2021

Figure 63: Italy Market Value (US$ million) and Forecast, 2022 to 2032

Figure 64: Italy Market Share, By Product Type, 2021

Figure 65: BENELUX Market Value (US$ million) and Forecast, 2022 to 2032

Figure 66: BENELUX Market Share, By Product Type, 2021

Figure 67: Nordic Countries Market Value (US$ million) and Forecast, 2022 to 2032

Figure 68: Nordic Countries Market Share, By Product Type, 2021

Figure 69: China Market Value (US$ million) and Forecast, 2022 to 2032

Figure 70: China Market Share, By Product Type, 2021

Figure 71: Japan Market Value (US$ million) and Forecast, 2022 to 2032

Figure 72: Japan Market Share, By Product Type, 2021

Figure 73: South Korea Market Value (US$ million) and Forecast, 2022 to 2032

Figure 74: South Korea Market Share, By Product Type, 2021

Figure 75: GCC Countries Market Value (US$ million) and Forecast, 2022 to 2032

Figure 76: GCC Countries Market Share, By Product Type, 2021

Figure 77: South Africa Market Value (US$ million) and Forecast, 2022 to 2032

Figure 78: South Africa Market Share, By Product Type, 2021

Figure 79: Turkey Market Value (US$ million) and Forecast, 2022 to 2032

Figure 80: Turkey Market Share, By Product Type, 2021

Recommendations

Healthcare

Directed Energy-Based Surgical Systems Market

Published : November 2022

Healthcare

Dental Diagnostic and Surgical Equipment Market

Published : September 2022

Explore Healthcare Insights

View Reports

Hospital Surgical Disinfectant Market