Hospital Supplies Market
Market Insights on Hospital Supplies covering sales outlook, demand forecast & up-to-date key trends
Hospital Supplies Market by Product, End User & Region | Forecast 2022 to 2032
Hospital Supplies Market Outlook (2022 to 2032)
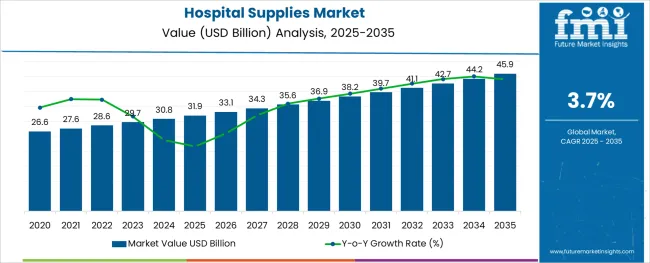
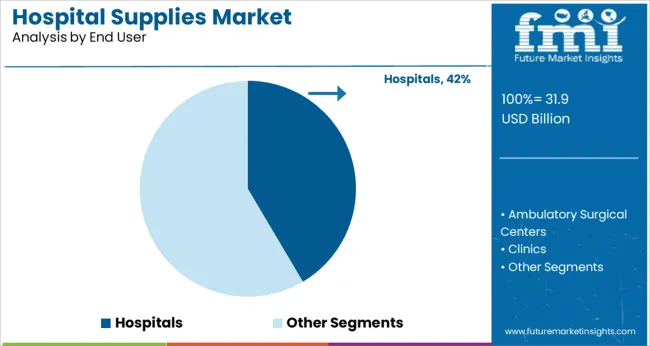
[250 Pages Report] The global demand for hospital supplies is expected to increase at 3.7% CAGR over the forecast period from 2022 to 2032. Sales in the hospital supplies market are estimated to reach a valuation of US$ 29.5 Billion in 2022. According to the study, hospitals held a substantial share of 47.2% in 2021 in the global hospital supplies market.
Data Points |
Market Insights |
Hospital Supplies Market Value 2021 |
US$ 28.6 Billion |
Hospital Supplies Market Value 2022 |
US$ 29.5 Billion |
Hospital Supplies Market Value 2032 |
US$ 42.3 Billion |
Hospital Supplies Market CAGR 2022 to 2032 |
3.7% |
Market Share of Top 5 Countries |
53.3% |
Don't pay for what you don't need
Customize your report by selecting specific countries or regions and save 30%!
Sales Analysis of Hospital Supplies Market from 2017 to 2021 Vs Demand Outlook for 2022 to 2032
According to Future Market Insights (FMI), the overall sales of hospital supplies grew at a CAGR of 3.3% between 2017 and 2021. However, the demand in the hospital supplies market is expected to increase at a CAGR of 3.5%, reaching US$ 42.3 Billion by the end of 2032.
The global hospital supplies market held around 20% of the global medical supplies market which was valued at nearly US$ 138 Billion in the year 2021.
Hospital settings and other healthcare units are at a greater risk of infections and viral exposure, resulting in a rising prevalence of hospital-acquired infections for over a decade. Several measures are being considered to prevent and reduce the prevalence rate such as the use of disposable procedure kits and trays, sterile and disposable products, sterile medical devices, disposable gloves, and other disposable medical supplies.
For instance, in March 2022, Becton, Dickinson & Company launched a TCR/BCR multi-omic assay which aids in speeding the discovery of infectious diseases, autoimmune disorders, and immune-oncology as well.
According to a survey conducted by CDC, in 2019, about 1 in 31 patients had at least one healthcare-associated infection. In addition, it is also noticed that the prevalence rate of hospital-acquired infections in low-income countries is far higher than in high-income countries.
For instance, a study published in the International Journal of Research and Public Health in 2020 states that a 7.5% prevalence of hospital-acquired infection was observed in high-income countries, although others have reported rates of 4.5% in the USA and 5.7%-7.1% in Europe, while in low- and middle-income countries, however, the prevalence rate ranged between 5.7% and 19.2%.
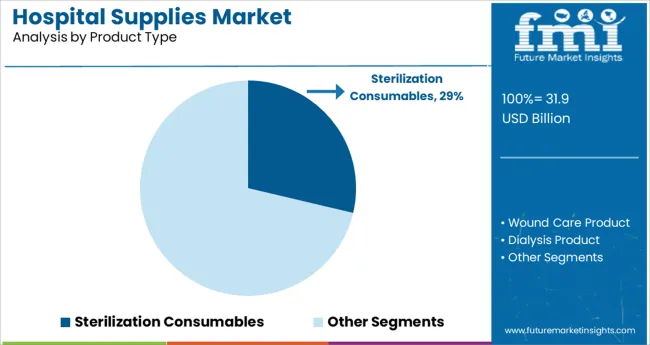
The hospital supplies market includes different product types such as wound care products, dialysis products, sterilization consumables, infusion products, and hypodermic and radiology products amongst others.
Based on product, hypodermic and radiology products like syringes, needles and consumable products for radiography and ultrasound were the dominant market segment in the global market in 2021, which contributed 17.6% of the revenue share.
The global hospital supplies market is expected to be valued at US$ 42.3 Billion by the end of 2032, registering a CAGR of 3.7% over the forecast period.
What are the Key Opportunities for Hospital Supplies Manufacturers?
Growing awareness regarding health & hygiene practices, particularly in hospitals will offer lucrative opportunities to market players. The rising disposable income and large patient pool due to a lack of awareness regarding hygiene in emerging economies will drive sales in the market.
Increasing expenditure on healthcare services is leading to the emergence of more and new hospitals worldwide, which in turn, is spurring demand for hospital supplies.
Other factors such as the growth in nosocomial infections have not only increased the mortality and morbidity rate but also the healthcare burden by stretching the length of hospitalization. Therefore, organizations such as the CDC and WHO are putting immense efforts into layout guidelines and conducting vigorous studies to control the occurrence of hospital-acquired infections.
However, despite these efforts, there is still a significant rise in the prevalence of these infections. Thus, increasing research and development efforts to develop hygienic solutions in the hospital supplies industry to minimize exposure to infection and other viral diseases expect to uncap lucrative opportunities in the hospital supplies market.
Find your sweet spots for generating winning opportunities in this market.
Talk to AnalystWhich Factors are Restraining Demand for Hospital Supplies?
Lack of awareness regarding hospital-acquired infection and hygiene in developing countries is contributing to the rapid rise of hospital-acquired infection in these countries. According to a study published in the Journal of Epidemiology and Community Health, more than 20% of all hospital-acquired infections are associated with intensive care unit visits.
Most emerging nations have about 2-3-fold higher hospital-acquired infection populations. Thus, the lack of awareness in developing countries regarding hospital-acquired infection and its diagnosis is projected to restrict the growth in the hospital-acquired infection testing market. This is expected to have a negative impact on sales of hospital supplies.
When most countries in the developed regions have strongly built health insurance coverage, these policies are less spread in developing countries. World Health Organization states that the world's partial population is not able to obtain essential health services.
According to a national survey, only one-fifth of the Indian population is insured under health insurance.
Most health insurance schemes do not cover disposables such as disposable gloves or masks utilized during surgical procedures. This adds to the overall cost imparted on the patient’s budget. Thus, the lack of proper health insurance that covers essential healthcare services and the cost of various hospital supplies in underdeveloped and developing countries may restrain the growth in the hospital supplies market.
Country-wise Insights
Why is the USA Hospital Supplies Market Considered Lucrative?
Rising Demand for Wound Care Products in the USA to Fuel Growth
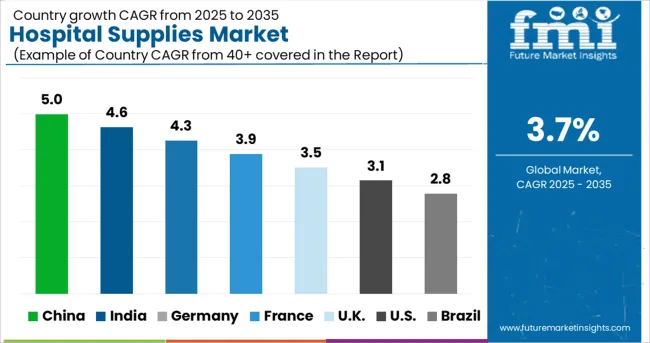
According to FMI, the USA is expected to dominate the North American hospital supplies market, with a total market share of 92.8% in 2021, and is projected to continue to exhibit high growth through 2022 & beyond.
According to CDC, approximately 5% of patients acquire hospital-associated infections in developed countries. Hence, rising in the number of patient admissions, high demand for treatment, and increased prevalence of hospital-acquired infection and adoption of medical hygiene practices will continue pushing sales in the USA.
What is Driving the Germany Hospital Supplies Market?
Growth in the Medical Automation Market in Germany will Spur Demand for Hospital Supplies
Germany is set to exhibit growth at a CAGR of around 3.5% in the Europe hospital supplies market during the forecast period. Rising awareness of hospital-acquired infection and strong healthcare infrastructure, attractive reimbursement policies along with the best Research and Development performance in the industry will drive the growth of the hospital supplies market in Germany.
What will be the Demand Outlook in the China Hospital Supplies Market?
Expansion of the Portable Medical Devices Market in China Will Fuel Growth
Sales in the China market are projected to expand at a CAGR rate of 4.1% and hold about half of the East Asia hospital supplies market share and are expected to dominate throughout the forecast period, finds FMI.
Growing investments in research & development activities and technological advancements in the healthcare sector will drive sales in the market. China is expected to spearhead the growth in East Asia due to technological advancement, wide availability of consumable medical supply products, and the presence of numerous players in the healthcare sector.
What is Driving the India Hospital Supplies Market?
Rising Demand for Sterile and Disposable Products Will Boost the India Market
Total demand in India accounted for 45.3% of the market share in 2021 and is projected to increase with a CAGR of 4.0% over the forecast period. Growing prevalence of antibacterial-resistant infections and hospital-acquired infections spurring demand for hospital supplies.
With rising expenditure on healthcare services, developing economies like India are focussing more on innovation and technology in the healthcare sector which is in turn fuelling the hospital supplies market within the country.
Get the data you need at a Fraction of the cost
Personalize your report by choosing insights you need
and save 40%!
Category-wise Insights
Which Product Type is Most Preferred in Hospital Supplies Market?
Sales of Hypodermic and Radiology Products to Remain High
Based on product type, the hypodermic and radiology products segment accounted for 17.6% of the global market share in 2021. Sales in this segment are forecast to increase at a CAGR of 3.6% over the forecast period. Products like needles and syringes are routinely used in hospitals or diagnostic labs for drawing blood or injecting medicines.
On the other hand, radiology equipment like X-ray machines and C-Arms which are often employed in routine diagnosis by doctors, especially during surgical procedures require related disposable products to avoid spreading the infection to patients.
Which is the Leading End User in Hospital Supplies Market?
Demand for Hospital Supplies in the Hospital Segment Will Gain Momentum
By end-user, the hospital segment held a market share of 47.2% in 2021, with sales poised to grow at a CAGR of 3.9% over the upcoming decade. Hospitals have a large patient population and are exposed to numerous viral infections. Thus, to minimize the prevalence of healthcare-associated infection, hospitals are focusing on maintaining a hygienic environment which in turn is spurring demand for hospital supplies.
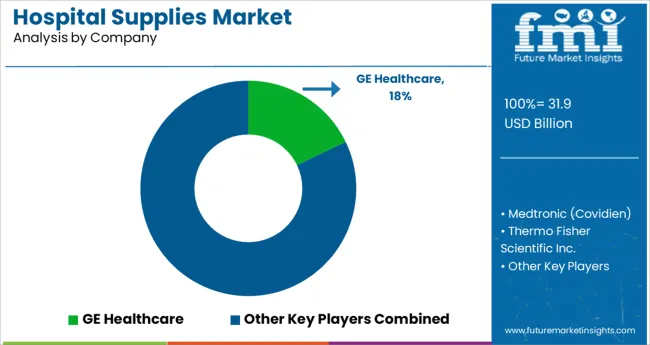
Competitive Landscape
The hospital supplies market is highly fragmented. There are numerous players in the global market involved in developing cutting-edge solutions for the development of efficient products that can meet their customer’s needs.
Leading hospital supplies manufacturers are focusing on mergers, acquisitions, collaborations, and new product launches to increase sales and expand their global footprint. They are also focusing on improving their market presence by expanding their product line across countries to capitalize on untapped opportunities. For instance:
- In April 2022, GE Healthcare partnered with Unilabs to provide cutting-edge MRI, CT Scan, ultrasound, mammography, and X-ray machines in Portugal.
- In March 2022, Cardinal Health Inc. launched its first surgical incise drape combined with chlorhexidine gluconate (CHG) to reduce the risk of onsite surgical contamination by gram-negative bacteria. This incise is sturdy, and breathable and provides a sterile surface to avoid any further contamination.
- In December 2021, Medtronic plc launched the INVOS 7100 system. This will help clinicians to monitor organ-specific oxygen levels in patients to identify warning signs for children and even neonates.
- In December 2021, Thermo Fischer Scientific acquired PPD Inc.
Scope Of Report
Attribute |
Details |
Forecast Period |
2022 to 2032 |
Historical Data Available for |
2017 to 2021 |
Market Analysis |
US$ Billion for Value |
Key Regions Covered |
North America, Latin America, Europe, South Asia, East Asia, Oceania, and Middle East & Africa |
Key Countries Covered |
The USA, Canada, Brazil, Mexico, Argentina, the UK, Germany, France, Italy, Spain, Russia, BENELUX, China, Japan, South Korea, India, Thailand, Indonesia, Malaysia, Australia, New Zealand, North Africa, GCC Countries, Turkey, and South Africa |
Key Market Segments Covered |
Product, End User, and Region |
Key Companies Profiled |
|
Key Market Segments Covered in Hospital Supplies Industry Research
By Product:
- Sterilization Consumables
- Wound Care Products
- Dialysis Products
- Infusion Products
- Hypodermic & Radiology Products
- Intubation & Respiratory Supplies
- Surgical Procedure Kits & Trays
- Blood Management & Diagnostic Supplies
- General Disposable Products
By End User:
- Hospitals
- Ambulatory Surgical Centres
- Clinics
- Diagnostic Centres
- Long Term Care Centres
- Nursing Facilities
By Region:
- North America
- Latin America
- Europe
- South Asia
- East Asia
- Oceania
- The Middle East and Africa (MEA)
Frequently Asked Questions
How much is the hospital supplies market currently worth?
The global hospital supplies market is expected to be worth US$ 29.5 Billion in 2022 and is set to expand by 1.4X over the next ten years.
What is the sales forecast for the hospital supplies market through 2032?
The hospital supplies market is expected to reach US$ 42.3 Billion by end of 2032, exhibiting growth at a CAGR of 3.7% between 2022 and 2032.
What are the key trends driving sales in the hospital supplies market?
Key trends influencing sales in the hospital supplies market include increasing adoption of advanced hospital supplies, higher consumption of hospital supplies and strategic collaborations, mergers, and acquisitions among key players.
Which region has the highest market share in the global hospital supplies market?
South Asia is expected to lead the global market, contributing over 23% of the revenue share in 2021.
Which are the top 5 countries driving demand for hospital supplies?
The U.S., Japan, China, Germany, and India are the top five countries, which are expected to drive demand in the hospital supplies market.
Which are the key manufacturers of hospital supplies market?
GE Healthcare, Medtronic (Covidien), Thermo Fischer Scientific Inc., Becton, Dickinson and Company, Cardinal Heath, Boston Scientific Corporation, B. Braun Melsungen AG, 3M Science, Molnlycke Health Care AB, Advanced Sterilization Services, Terumo, Baxter, Kimberly-Clark Corporation, Steris Corporation, Stryker Corporation, Getinge AB, Johnson and Johnson are the key manufacturers in this market.
Table of Content
1. Executive Summary | Hospital Supplies Market 1.1. Global Market Outlook 1.2. Demand Side Trends 1.3. Supply Side Trends 1.4. Analysis and Recommendations 2. Market Overview 2.1. Market Coverage / Taxonomy 2.2. Market Definition / Scope / Limitations 2.3. Inclusions and Exclusions 3. Key Market Trends 3.1. Key Trends Impacting the Market 3.2. Product Innovation / Development Trends 4. Market Background 4.1. Macro-Economic Factors 4.1.1. Global Healthcare Expenditure Outlook 4.1.2. Growth of the Healthcare Sector in Emerging Nations 4.1.3. Global Market 4.2. Forecast Factors - Relevance & Impact 4.2.1. Usage of Disposable Supplies 4.2.2. Increase in Demand for Disposable Supplies 4.2.3. Impact of Covid 4.2.4. Strategic Collaborations 4.2.5. Frequency of Product Launches 4.2.6. Rise of healthcare spending in developing economies 4.3. Market Dynamics 4.3.1. Drivers 4.3.2. Restraints 4.3.3. Opportunity Analysis 5. COVID-19 Crisis Analysis 5.1. COVID-19 and Impact Analysis 5.1.1. Revenue By Product Type 5.1.2. Revenue By End User 5.1.3. Revenue By Region 5.2. 2021 Market Scenario 6. Key Success Factors 6.1. Product Adoption/ Usage Analysis 6.2. Product USPs/ features 6.3. Key Promotional Strategies, By Key Manufacturers 6.4. Regulatory Scenario 6.5. Reimbursement Scenario 6.6. Value Chain Analysis 7. Global Market Demand (in Value or Size in US$ Billion) Analysis 2017 to 2021 and Forecast, 2022 to 2032 7.1. Historical Market Value (US$ Billion) Analysis, 2017 to 2021 7.2. Current and Future Market Size (US$ Billion) and Forecast Projections, 2022 to 2032 7.2.1. Y-o-Y Growth Trend Analysis 7.2.2. Absolute $ Opportunity Analysis 8. Global Market Analysis 2017 to 2021 and Forecast 2022 to 2032, by Product Type 8.1. Introduction / Key Findings 8.2. Historical Market Size (US$ Billion) By Product Type, 2017 to 2021 8.3. Current and Future Market Size (US$ Billion) and Forecast By Product Type, 2022 to 2032 8.3.1. Sterilization Consumables 8.3.2. Wound Care Product 8.3.3. Dialysis Product 8.3.4. Infusion Product 8.3.5. Hypodermic & Radiology Product 8.3.6. Intubation & Respiratory Supplies 8.3.7. Surgical Procedure Kits & Trays 8.3.8. Blood Management & Diagnostic Supplies 8.3.9. General Disposable Product 8.4. Market Attractiveness Analysis By Product Type 9. Global Market Analysis 2017 to 2021 and Forecast 2022 to 2032, by End User 9.1. Introduction / Key Findings 9.2. Historical Market Size (US$ Billion) By End User, 2017 to 2021 9.3. Current and Future Market Size (US$ Billion) and Forecast By End User, 2022 to 2032 9.3.1. Hospitals 9.3.2. Ambulatory Surgical Centers 9.3.3. Clinics 9.3.4. Diagnostic Centers 9.3.5. Long-Term Care Centers 9.3.6. Nursing Facilities 9.4. Market Attractiveness Analysis By End User 10. Global Market Analysis 2017 to 2021 and Forecast 2022 to 2032, by Region 10.1. Introduction 10.2. Historical Market Size (US$ Billion) and By Region, 2017 to 2021 10.3. Current and Future Market Size (US$ Billion) and Forecast By Region, 2022 to 2032 10.3.1. North America 10.3.2. Latin America 10.3.3. Europe 10.3.4. South Asia 10.3.5. East Asia 10.3.6. Oceania 10.3.7. Middle East and Africa (MEA) 10.4. Market Attractiveness Analysis By Region 11. North America Market Analysis 2017 to 2021 and Forecast 2022 to 2032 11.1. Introduction 11.2. Historical Market Size (US$ Billion) Trend Analysis By Market Taxonomy, 2017 to 2021 11.3. Current and Future Market Size (US$ Billion) and Forecast By Market Taxonomy, 2022 to 2032 11.3.1. By Country 11.3.1.1. United States of America 11.3.1.2. Canada 11.3.2. By Product Type 11.3.3. By End User 11.4. Market Attractiveness Analysis 11.4.1. By Country 11.4.2. By Product Type 11.4.3. By End User 11.5. Market Trends 11.6. Key Market Participants - Intensity Mapping 11.7. Drivers and Restraints - Impact Analysis 11.8. Country-Level Analysis & Forecast 11.8.1. USA Market Analysis 11.8.1.1. Introduction 11.8.1.2. Market Analysis and Forecast by Market Taxonomy 11.8.1.2.1. By Product Type 11.8.1.2.2. By End User 11.8.2. Canada Market Analysis 11.8.2.1. Introduction 11.8.2.2. Market Analysis and Forecast by Market Taxonomy 11.8.2.2.1. By Product Type 11.8.2.2.2. By End User 12. Latin America Market Analysis 2017 to 2021 and Forecast 2022 to 2032 12.1. Introduction 12.2. Historical Market Size (US$ Billion) Trend Analysis By Market Taxonomy, 2017 to 2021 12.3. Current and Future Market Size (US$ Billion) and Forecast By Market Taxonomy, 2022 to 2032 12.3.1. By Country 12.3.1.1. Brazil 12.3.1.2. Mexico 12.3.1.3. Argentina 12.3.1.4. Rest of Latin America 12.3.2. By Product Type 12.3.3. By End User 12.4. Market Attractiveness Analysis 12.4.1. By Country 12.4.2. By Product Type 12.4.3. By End User 12.5. Market Trends 12.6. Key Market Participants - Intensity Mapping 12.7. Drivers and Restraints - Impact Analysis 12.8. Country-Level Analysis & Forecast 12.8.1. Brazil Market Analysis 12.8.1.1. Introduction 12.8.1.2. Market Analysis and Forecast by Market Taxonomy 12.8.1.2.1. By Product Type 12.8.1.2.2. By End User 12.8.2. Mexico Market Analysis 12.8.2.1. Introduction 12.8.2.2. Market Analysis and Forecast by Market Taxonomy 12.8.2.2.1. By Product Type 12.8.2.2.2. By End User 12.8.3. Argentina Market Analysis 12.8.3.1. Introduction 12.8.3.2. Market Analysis and Forecast by Market Taxonomy 12.8.3.2.1. By Product Type 12.8.3.2.2. By End User 13. Europe Market Analysis 2017 to 2021 and Forecast 2022 to 2032 13.1. Introduction 13.2. Historical Market Size (US$ Billion) Trend Analysis By Market Taxonomy, 2017 to 2021 13.3. Current and Future Market Size (US$ Billion) and Forecast By Market Taxonomy, 2022 to 2032 13.3.1. By Country 13.3.1.1. United Kingdom 13.3.1.2. Germany 13.3.1.3. France 13.3.1.4. Italy 13.3.1.5. Spain 13.3.1.6. BENELUX 13.3.1.7. Russia 13.3.1.8. Rest of Europe 13.3.2. By Product Type 13.3.3. By End User 13.4. Market Attractiveness Analysis 13.4.1. By Country 13.4.2. By Product Type 13.4.3. By End User 13.5. Market Trends 13.6. Key Market Participants - Intensity Mapping 13.7. Drivers and Restraints - Impact Analysis 13.8. Country-Level Analysis & Forecast 13.8.1. UK Market Analysis 13.8.1.1. Introduction 13.8.1.2. Market Analysis and Forecast by Market Taxonomy 13.8.1.2.1. By Product Type 13.8.1.2.2. By End User 13.8.2. Germany Market Analysis 13.8.2.1. Introduction 13.8.2.2. Market Analysis and Forecast by Market Taxonomy 13.8.2.2.1. By Product Type 13.8.2.2.2. By End User 13.8.3. France Market Analysis 13.8.3.1. Introduction 13.8.3.2. Market Analysis and Forecast by Market Taxonomy 13.8.3.2.1. By Product Type 13.8.3.2.2. By End User 13.8.4. Italy Market Analysis 13.8.4.1. Introduction 13.8.4.2. Market Analysis and Forecast by Market Taxonomy 13.8.4.2.1. By Product Type 13.8.4.2.2. By End User 13.8.5. Spain Market Analysis 13.8.5.1. Introduction 13.8.5.2. Market Analysis and Forecast by Market Taxonomy 13.8.5.2.1. By Product Type 13.8.5.2.2. By End User 13.8.6. BENELUX Market Analysis 13.8.6.1. Introduction 13.8.6.2. Market Analysis and Forecast by Market Taxonomy 13.8.6.2.1. By Product Type 13.8.6.2.2. By End User 13.8.7. Russia Market Analysis 13.8.7.1. Introduction 13.8.7.2. Market Analysis and Forecast by Market Taxonomy 13.8.7.2.1. By Product Type 13.8.7.2.2. By End User 14. South Asia Market Analysis 2017 to 2021 and Forecast 2022 to 2032 14.1. Introduction 14.2. Historical Market Size (US$ Billion) and Trend Analysis & Forecast By Market Taxonomy, 2017 to 2021 14.3. Current and Future Market Size (US$ Billion) and Forecast By Market Taxonomy, 2022 to 2032 14.3.1. By Country 14.3.1.1. India 14.3.1.2. Thailand 14.3.1.3. Indonesia 14.3.1.4. Malaysia 14.3.1.5. Rest of South Asia 14.3.2. By Product Type 14.3.3. By End User 14.4. Market Attractiveness Analysis 14.4.1. By Country 14.4.2. By Product Type 14.4.3. By End User 14.5. Market Trends 14.6. Key Market Participants - Intensity Mapping 14.7. Drivers and Restraints - Impact Analysis 14.8. Country-Level Analysis & Forecast 14.8.1. India Market Analysis 14.8.1.1. Introduction 14.8.1.2. Market Analysis and Forecast by Market Taxonomy 14.8.1.2.1. By Product Type 14.8.1.2.2. By End User 14.8.2. Indonesia Market Analysis 14.8.2.1. Introduction 14.8.2.2. Market Analysis and Forecast by Market Taxonomy 14.8.2.2.1. By Product Type 14.8.2.2.2. By End User 14.8.3. Malaysia Market Analysis 14.8.3.1. Introduction 14.8.3.2. Market Analysis and Forecast by Market Taxonomy 14.8.3.2.1. By Product Type 14.8.3.2.2. By End User 14.8.4. Thailand Market Analysis 14.8.4.1. Introduction 14.8.4.2. Market Analysis and Forecast by Market Taxonomy 14.8.4.2.1. By Product Type 14.8.4.2.2. By End User 15. East Asia Market Analysis 2017 to 2021 and Forecast 2022 to 2032 15.1. Introduction 15.2. Historical Market Size (US$ Billion) Trend Analysis By Market Taxonomy, 2017 to 2021 15.3. Current and Future Market Size (US$ Billion) and Forecast By Market Taxonomy, 2022 to 2032 15.3.1. By Country 15.3.1.1. China 15.3.1.2. Japan 15.3.1.3. South Korea 15.3.2. By Product Type 15.3.3. By End User 15.4. Market Attractiveness Analysis 15.4.1. By Country 15.4.2. By Product Type 15.4.3. By End User 15.5. Market Trends 15.6. Key Market Participants - Intensity Mapping 15.7. Drivers and Restraints - Impact Analysis 15.8. Country-Level Analysis & Forecast 15.8.1. China Market Analysis 15.8.1.1. Introduction 15.8.1.2. Market Analysis and Forecast by Market Taxonomy 15.8.1.2.1. By Product Type 15.8.1.2.2. By End User 15.8.2. Japan Market Analysis 15.8.2.1. Introduction 15.8.2.2. Market Analysis and Forecast by Market Taxonomy 15.8.2.2.1. By Product Type 15.8.2.2.2. By End User 15.8.3. South Korea Market Analysis 15.8.3.1. Introduction 15.8.3.2. Market Analysis and Forecast by Market Taxonomy 15.8.3.2.1. By Product Type 15.8.3.2.2. By End User 16. Oceania Market Analysis 2017 to 2021 and Forecast 2022 to 2032 16.1. Introduction 16.2. Historical Market Size (US$ Billion) Trend Analysis By Market Taxonomy, 2017 to 2021 16.3. Current and Future Market Size (US$ Billion) and Forecast By Market Taxonomy, 2022 to 2032 16.3.1. By Country 16.3.1.1. Australia 16.3.1.2. New Zealand 16.3.2. By Product Type 16.3.3. By End User 16.4. Market Attractiveness Analysis 16.4.1. By Product Type 16.4.2. By End User 16.5. Market Trends 16.6. Key Market Participants - Intensity Mapping 16.7. Drivers and Restraints - Impact Analysis 16.8. Country-Level Analysis & Forecast 16.8.1. Australia Market Analysis 16.8.1.1. Introduction 16.8.1.2. Market Analysis and Forecast by Market Taxonomy 16.8.1.2.1. By Product Type 16.8.1.2.2. By End User 16.8.2. New Zealand Market Analysis 16.8.2.1. Introduction 16.8.2.2. Market Analysis and Forecast by Market Taxonomy 16.8.2.2.1. By Product Type 16.8.2.2.2. By End User 17. Middle East & Africa Market Analysis 2017 to 2021 and Forecast 2022 to 2032 17.1. Introduction 17.2. Historical Market Size (US$ Billion) and Trend Analysis & Forecast By Market Taxonomy, 2017 to 2021 17.3. Current and Future Market Size (US$ Billion) and Forecast By Market Taxonomy, 2022 to 2032 17.3.1. By Country 17.3.1.1. Turkey 17.3.1.2. GCC Countries 17.3.1.3. North Africa 17.3.1.4. South Africa 17.3.1.5. Rest of MEA 17.3.2. By Product Type 17.3.3. By End User 17.4. Market Attractiveness Analysis 17.4.1. By Country 17.4.2. By Product Type 17.4.3. By End User 17.5. Market Trends 17.6. Key Market Participants - Intensity Mapping 17.7. Drivers and Restraints - Impact Analysis 17.8. Country-Level Analysis & Forecast 17.8.1. Turkey Market Analysis 17.8.1.1. Introduction 17.8.1.2. Market Analysis and Forecast by Market Taxonomy 17.8.1.2.1. By Product Type 17.8.1.2.2. By End User 17.8.2. GCC Countries Market Analysis 17.8.2.1. Introduction 17.8.2.2. Market Analysis and Forecast by Market Taxonomy 17.8.2.2.1. By Product Type 17.8.2.2.2. By End User 17.8.3. North Africa Market Analysis 17.8.3.1. Introduction 17.8.3.2. Market Analysis and Forecast by Market Taxonomy 17.8.3.2.1. By Product Type 17.8.3.2.2. By End User 17.8.4. South Africa Market Analysis 17.8.4.1. Introduction 17.8.4.2. Market Analysis and Forecast by Market Taxonomy 17.8.4.2.1. By Product Type 17.8.4.2.2. By End User 18. Market Structure Analysis 18.1. Market Analysis by Tier of Companies 18.2. Market Concentration 18.3. Market Share Analysis of Top Players 18.4. Market Presence Analysis 18.4.1. By Regional Footprint of Players 18.4.2. Product Footprint by Players 18.4.3. Channel Footprint by Players 19. Competition Analysis 19.1. Competition Dashboard 19.2. Competition Benchmarking 19.3. Competition Deep Dive 19.3.1.1. GE Healthcare 19.3.1.1.1. Overview 19.3.1.1.2. Component Portfolio 19.3.1.1.3. Profitability by Market Segments (Component/Channel/Region) 19.3.1.1.4. Sales Footprint 19.3.1.1.5. Strategy Overview 19.3.1.1.5.1. Marketing Strategies 19.3.1.1.5.2. Channel Strategies 19.3.1.1.5.3. Product Strategies 19.3.1.2. Medtronic (Covidien) 19.3.1.2.1. Overview 19.3.1.2.2. Component Portfolio 19.3.1.2.3. Profitability by Market Segments (Component/Channel/Region) 19.3.1.2.4. Sales Footprint 19.3.1.2.5. Strategy Overview 19.3.1.2.5.1. Marketing Strategies 19.3.1.2.5.2. Channel Strategies 19.3.1.2.5.3. Product Strategies 19.3.1.3. Thermo Fischer Scientific Inc. 19.3.1.3.1. Overview 19.3.1.3.2. Component Portfolio 19.3.1.3.3. Profitability by Market Segments (Component/Channel/Region) 19.3.1.3.4. Sales Footprint 19.3.1.3.5. Strategy Overview 19.3.1.3.5.1. Marketing Strategies 19.3.1.3.5.2. Channel Strategies 19.3.1.3.5.3. Product Strategies 19.3.1.4. Becton, Dickinson, and Company 19.3.1.4.1. Overview 19.3.1.4.2. Component Portfolio 19.3.1.4.3. Profitability by Market Segments (Component/Channel/Region) 19.3.1.4.4. Sales Footprint 19.3.1.4.5. Strategy Overview 19.3.1.4.5.1. Marketing Strategies 19.3.1.4.5.2. Channel Strategies 19.3.1.4.5.3. Product Strategies 19.3.1.5. Cardinal Heath 19.3.1.5.1. Overview 19.3.1.5.2. Component Portfolio 19.3.1.5.3. Profitability by Market Segments (Component/Channel/Region) 19.3.1.5.4. Sales Footprint 19.3.1.5.5. Strategy Overview 19.3.1.5.5.1. Marketing Strategies 19.3.1.5.5.2. Channel Strategies 19.3.1.5.5.3. Product Strategies 19.3.1.6. Boston Scientific Corporation 19.3.1.6.1. Overview 19.3.1.6.2. Component Portfolio 19.3.1.6.3. Profitability by Market Segments (Component/Channel/Region) 19.3.1.6.4. Sales Footprint 19.3.1.6.5. Strategy Overview 19.3.1.6.5.1. Marketing Strategies 19.3.1.6.5.2. Channel Strategies 19.3.1.6.5.3. Product Strategies 19.3.1.7. B. Braun Melsungen AG 19.3.1.7.1. Overview 19.3.1.7.2. Component Portfolio 19.3.1.7.3. Profitability by Market Segments (Component/Channel/Region) 19.3.1.7.4. Sales Footprint 19.3.1.7.5. Strategy Overview 19.3.1.7.5.1. Marketing Strategies 19.3.1.7.5.2. Channel Strategies 19.3.1.7.5.3. Product Strategies 19.3.1.8. 3M Science 19.3.1.8.1. Overview 19.3.1.8.2. Component Portfolio 19.3.1.8.3. Profitability by Market Segments (Component/Channel/Region) 19.3.1.8.4. Sales Footprint 19.3.1.8.5. Strategy Overview 19.3.1.8.5.1. Marketing Strategies 19.3.1.8.5.2. Channel Strategies 19.3.1.8.5.3. Product Strategies 19.3.1.9. Molnlycke Health Care AB 19.3.1.9.1. Overview 19.3.1.9.2. Component Portfolio 19.3.1.9.3. Profitability by Market Segments (Component/Channel/Region) 19.3.1.9.4. Sales Footprint 19.3.1.9.5. Strategy Overview 19.3.1.9.5.1. Marketing Strategies 19.3.1.9.5.2. Channel Strategies 19.3.1.9.5.3. Product Strategies 19.3.1.10. Advanced Sterilization Services 19.3.1.10.1. Overview 19.3.1.10.2. Component Portfolio 19.3.1.10.3. Profitability by Market Segments (Component/Channel/Region) 19.3.1.10.4. Sales Footprint 19.3.1.10.5. Strategy Overview 19.3.1.10.5.1. Marketing Strategies 19.3.1.10.5.2. Channel Strategies 19.3.1.10.5.3. Product Strategies 19.3.1.11. Terumo 19.3.1.11.1. Overview 19.3.1.11.2. Component Portfolio 19.3.1.11.3. Profitability by Market Segments (Component/Channel/Region) 19.3.1.11.4. Sales Footprint 19.3.1.11.5. Strategy Overview 19.3.1.11.5.1. Marketing Strategies 19.3.1.11.5.2. Channel Strategies 19.3.1.11.5.3. Product Strategies 19.3.1.12. Baxter 19.3.1.12.1. Overview 19.3.1.12.2. Component Portfolio 19.3.1.12.3. Profitability by Market Segments (Component/Channel/Region) 19.3.1.12.4. Sales Footprint 19.3.1.12.5. Strategy Overview 19.3.1.12.5.1. Marketing Strategies 19.3.1.12.5.2. Channel Strategies 19.3.1.12.5.3. Product Strategies 19.3.1.13. Kimberly-Clark Corporation 19.3.1.13.1. Overview 19.3.1.13.2. Component Portfolio 19.3.1.13.3. Profitability by Market Segments (Component/Channel/Region) 19.3.1.13.4. Sales Footprint 19.3.1.13.5. Strategy Overview 19.3.1.13.5.1. Marketing Strategies 19.3.1.13.5.2. Channel Strategies 19.3.1.13.5.3. Product Strategies 19.3.1.14. Steris Corporation 19.3.1.14.1. Overview 19.3.1.14.2. Component Portfolio 19.3.1.14.3. Profitability by Market Segments (Component/Channel/Region) 19.3.1.14.4. Sales Footprint 19.3.1.14.5. Strategy Overview 19.3.1.14.5.1. Marketing Strategies 19.3.1.14.5.2. Channel Strategies 19.3.1.14.5.3. Product Strategies 19.3.1.15. Stryker Corporation 19.3.1.15.1. Overview 19.3.1.15.2. Component Portfolio 19.3.1.15.3. Profitability by Market Segments (Component/Channel/Region) 19.3.1.15.4. Sales Footprint 19.3.1.15.5. Strategy Overview 19.3.1.15.5.1. Marketing Strategies 19.3.1.15.5.2. Channel Strategies 19.3.1.15.5.3. Product Strategies 19.3.1.16. Getinge AB 19.3.1.16.1. Overview 19.3.1.16.2. Component Portfolio 19.3.1.16.3. Profitability by Market Segments (Component/Channel/Region) 19.3.1.16.4. Sales Footprint 19.3.1.16.5. Strategy Overview 19.3.1.16.5.1. Marketing Strategies 19.3.1.16.5.2. Channel Strategies 19.3.1.16.5.3. Product Strategies 19.3.1.17. Johnson and Johnson 19.3.1.17.1. Overview 19.3.1.17.2. Component Portfolio 19.3.1.17.3. Profitability by Market Segments (Component/Channel/Region) 19.3.1.17.4. Sales Footprint 19.3.1.17.5. Strategy Overview 19.3.1.17.5.1. Marketing Strategies 19.3.1.17.5.2. Channel Strategies 19.3.1.17.5.3. Product Strategies 20. Assumptions and Acronyms Used 21. Research Methodology
Don't pay for what you don't need
Customize your report by selecting specific countries or regions and save 30%!
List of Tables
Table 1: Global Market Value (US$ Billion) Forecast by Region, 2017 to 2032 Table 2: Global Market Value (US$ Billion) Forecast by Product, 2017 to 2032 Table 3: Global Market Value (US$ Billion) Forecast by End User, 2017 to 2032 Table 4: North America Market Value (US$ Billion) Forecast by Country, 2017 to 2032 Table 5: North America Market Value (US$ Billion) Forecast by Product, 2017 to 2032 Table 6: North America Market Value (US$ Billion) Forecast by End User, 2017 to 2032 Table 7: Latin America Market Value (US$ Billion) Forecast by Country, 2017 to 2032 Table 8: Latin America Market Value (US$ Billion) Forecast by Product, 2017 to 2032 Table 9: Latin America Market Value (US$ Billion) Forecast by End User, 2017 to 2032 Table 10: Europe Market Value (US$ Billion) Forecast by Country, 2017 to 2032 Table 11: Europe Market Value (US$ Billion) Forecast by Product, 2017 to 2032 Table 12: Europe Market Value (US$ Billion) Forecast by End User, 2017 to 2032 Table 13: East Asia Market Value (US$ Billion) Forecast by Country, 2017 to 2032 Table 14: East Asia Market Value (US$ Billion) Forecast by Product, 2017 to 2032 Table 15: East Asia Market Value (US$ Billion) Forecast by End User, 2017 to 2032 Table 16: South Asia Market Value (US$ Billion) Forecast by Country, 2017 to 2032 Table 17: South Asia Market Value (US$ Billion) Forecast by Product, 2017 to 2032 Table 18: South Asia Market Value (US$ Billion) Forecast by End User, 2017 to 2032 Table 19: Oceania Market Value (US$ Billion) Forecast by Country, 2017 to 2032 Table 20: Oceania Market Value (US$ Billion) Forecast by Product, 2017 to 2032 Table 21: Oceania Market Value (US$ Billion) Forecast by End User, 2017 to 2032 Table 22: MEA Market Value (US$ Billion) Forecast by Country, 2017 to 2032 Table 23: MEA Market Value (US$ Billion) Forecast by Product, 2017 to 2032 Table 24: MEA Market Value (US$ Billion) Forecast by End User, 2017 to 2032
Find your sweet spots for generating winning opportunities in this market.
Talk to AnalystList of Charts
Figure 1: Global Market Value (US$ Billion) by Product, 2022 to 2032 Figure 2: Global Market Value (US$ Billion) by End User, 2022 to 2032 Figure 3: Global Market Value (US$ Billion) by Region, 2022 to 2032 Figure 4: Global Market Value (US$ Billion) Analysis by Region, 2017 to 2032 Figure 5: Global Market Value Share (%) and BPS Analysis by Region, 2022 to 2032 Figure 6: Global Market Y-o-Y Growth (%) Projections by Region, 2022 to 2032 Figure 7: Global Market Value (US$ Billion) Analysis by Product, 2017 to 2032 Figure 8: Global Market Value Share (%) and BPS Analysis by Product, 2022 to 2032 Figure 9: Global Market Y-o-Y Growth (%) Projections by Product, 2022 to 2032 Figure 10: Global Market Value (US$ Billion) Analysis by End User, 2017 to 2032 Figure 11: Global Market Value Share (%) and BPS Analysis by End User, 2022 to 2032 Figure 12: Global Market Y-o-Y Growth (%) Projections by End User, 2022 to 2032 Figure 13: Global Market Attractiveness by Product, 2022 to 2032 Figure 14: Global Market Attractiveness by End User, 2022 to 2032 Figure 15: Global Market Attractiveness by Region, 2022 to 2032 Figure 16: North America Market Value (US$ Billion) by Product, 2022 to 2032 Figure 17: North America Market Value (US$ Billion) by End User, 2022 to 2032 Figure 18: North America Market Value (US$ Billion) by Country, 2022 to 2032 Figure 19: North America Market Value (US$ Billion) Analysis by Country, 2017 to 2032 Figure 20: North America Market Value Share (%) and BPS Analysis by Country, 2022 to 2032 Figure 21: North America Market Y-o-Y Growth (%) Projections by Country, 2022 to 2032 Figure 22: North America Market Value (US$ Billion) Analysis by Product, 2017 to 2032 Figure 23: North America Market Value Share (%) and BPS Analysis by Product, 2022 to 2032 Figure 24: North America Market Y-o-Y Growth (%) Projections by Product, 2022 to 2032 Figure 25: North America Market Value (US$ Billion) Analysis by End User, 2017 to 2032 Figure 26: North America Market Value Share (%) and BPS Analysis by End User, 2022 to 2032 Figure 27: North America Market Y-o-Y Growth (%) Projections by End User, 2022 to 2032 Figure 28: North America Market Attractiveness by Product, 2022 to 2032 Figure 29: North America Market Attractiveness by End User, 2022 to 2032 Figure 30: North America Market Attractiveness by Country, 2022 to 2032 Figure 31: Latin America Market Value (US$ Billion) by Product, 2022 to 2032 Figure 32: Latin America Market Value (US$ Billion) by Application, 2022 to 2032 Figure 33: Latin America Market Value (US$ Billion) by End User, 2022 to 2032 Figure 34: Latin America Market Value (US$ Billion) by Country, 2022 to 2032 Figure 35: Latin America Market Value (US$ Billion) Analysis by Country, 2017 to 2032 Figure 36: Latin America Market Value Share (%) and BPS Analysis by Country, 2022 to 2032 Figure 37: Latin America Market Y-o-Y Growth (%) Projections by Country, 2022 to 2032 Figure 38: Latin America Market Value (US$ Billion) Analysis by Product, 2017 to 2032 Figure 39: Latin America Market Value Share (%) and BPS Analysis by Product, 2022 to 2032 Figure 40: Latin America Market Y-o-Y Growth (%) Projections by Product, 2022 to 2032 Figure 41: Latin America Market Value (US$ Billion) Analysis by End User, 2017 to 2032 Figure 42: Latin America Market Value Share (%) and BPS Analysis by End User, 2022 to 2032 Figure 43: Latin America Market Y-o-Y Growth (%) Projections by End User, 2022 to 2032 Figure 44: Latin America Market Attractiveness by Product, 2022 to 2032 Figure 45: Latin America Market Attractiveness by End User, 2022 to 2032 Figure 46: Latin America Market Attractiveness by Country, 2022 to 2032 Figure 47: Europe Market Value (US$ Billion) by Product, 2022 to 2032 Figure 48: Europe Market Value (US$ Billion) by End User, 2022 to 2032 Figure 49: Europe Market Value (US$ Billion) by Country, 2022 to 2032 Figure 50: Europe Market Value (US$ Billion) Analysis by Country, 2017 to 2032 Figure 51: Europe Market Value Share (%) and BPS Analysis by Country, 2022 to 2032 Figure 52: Europe Market Y-o-Y Growth (%) Projections by Country, 2022 to 2032 Figure 53: Europe Market Value (US$ Billion) Analysis by Product, 2017 to 2032 Figure 54: Europe Market Value Share (%) and BPS Analysis by Product, 2022 to 2032 Figure 55: Europe Market Y-o-Y Growth (%) Projections by Product, 2022 to 2032 Figure 56: Europe Market Value (US$ Billion) Analysis by End User, 2017 to 2032 Figure 57: Europe Market Value Share (%) and BPS Analysis by End User, 2022 to 2032 Figure 58: Europe Market Y-o-Y Growth (%) Projections by End User, 2022 to 2032 Figure 59: Europe Market Attractiveness by Product, 2022 to 2032 Figure 60: Europe Market Attractiveness by End User, 2022 to 2032 Figure 61: Europe Market Attractiveness by Country, 2022 to 2032 Figure 62: East Asia Market Value (US$ Billion) by Product, 2022 to 2032 Figure 63: East Asia Market Value (US$ Billion) by End User, 2022 to 2032 Figure 64: East Asia Market Value (US$ Billion) by Country, 2022 to 2032 Figure 65: East Asia Market Value (US$ Billion) Analysis by Country, 2017 to 2032 Figure 66: East Asia Market Value Share (%) and BPS Analysis by Country, 2022 to 2032 Figure 67: East Asia Market Y-o-Y Growth (%) Projections by Country, 2022 to 2032 Figure 68: East Asia Market Value (US$ Billion) Analysis by Product, 2017 to 2032 Figure 69: East Asia Market Value Share (%) and BPS Analysis by Product, 2022 to 2032 Figure 70: East Asia Market Y-o-Y Growth (%) Projections by Product, 2022 to 2032 Figure 71: East Asia Market Value (US$ Billion) Analysis by End User, 2017 to 2032 Figure 72: East Asia Market Value Share (%) and BPS Analysis by End User, 2022 to 2032 Figure 73: East Asia Market Y-o-Y Growth (%) Projections by End User, 2022 to 2032 Figure 74: East Asia Market Attractiveness by Product, 2022 to 2032 Figure 75: East Asia Market Attractiveness by End User, 2022 to 2032 Figure 76: East Asia Market Attractiveness by Country, 2022 to 2032 Figure 77: South Asia Market Value (US$ Billion) by Product, 2022 to 2032 Figure 78: South Asia Market Value (US$ Billion) by End User, 2022 to 2032 Figure 79: South Asia Market Value (US$ Billion) by Country, 2022 to 2032 Figure 80: South Asia Market Value (US$ Billion) Analysis by Country, 2017 to 2032 Figure 81: South Asia Market Value Share (%) and BPS Analysis by Country, 2022 to 2032 Figure 82: South Asia Market Y-o-Y Growth (%) Projections by Country, 2022 to 2032 Figure 83: South Asia Market Value (US$ Billion) Analysis by Product, 2017 to 2032 Figure 84: South Asia Market Value Share (%) and BPS Analysis by Product, 2022 to 2032 Figure 85: South Asia Market Y-o-Y Growth (%) Projections by Product, 2022 to 2032 Figure 86: South Asia Market Value (US$ Billion) Analysis by End User, 2017 to 2032 Figure 87: South Asia Market Value Share (%) and BPS Analysis by End User, 2022 to 2032 Figure 88: South Asia Market Y-o-Y Growth (%) Projections by End User, 2022 to 2032 Figure 89: South Asia Market Attractiveness by Product, 2022 to 2032 Figure 90: South Asia Market Attractiveness by End User, 2022 to 2032 Figure 91: South Asia Market Attractiveness by Country, 2022 to 2032 Figure 92: Oceania Market Value (US$ Billion) by Product, 2022 to 2032 Figure 93: Oceania Market Value (US$ Billion) by End User, 2022 to 2032 Figure 94: Oceania Market Value (US$ Billion) by Country, 2022 to 2032 Figure 95: Oceania Market Value (US$ Billion) Analysis by Country, 2017 to 2032 Figure 96: Oceania Market Value Share (%) and BPS Analysis by Country, 2022 to 2032 Figure 97: Oceania Market Y-o-Y Growth (%) Projections by Country, 2022 to 2032 Figure 98: Oceania Market Value (US$ Billion) Analysis by Product, 2017 to 2032 Figure 99: Oceania Market Value Share (%) and BPS Analysis by Product, 2022 to 2032 Figure 100: Oceania Market Y-o-Y Growth (%) Projections by Product, 2022 to 2032 Figure 101: Oceania Market Value (US$ Billion) Analysis by End User, 2017 to 2032 Figure 102: Oceania Market Value Share (%) and BPS Analysis by End User, 2022 to 2032 Figure 103: Oceania Market Y-o-Y Growth (%) Projections by End User, 2022 to 2032 Figure 104: Oceania Market Attractiveness by Product, 2022 to 2032 Figure 105: Oceania Market Attractiveness by End User, 2022 to 2032 Figure 106: Oceania Market Attractiveness by Country, 2022 to 2032 Figure 107: MEA Market Value (US$ Billion) by Product, 2022 to 2032 Figure 108: MEA Market Value (US$ Billion) by End User, 2022 to 2032 Figure 109: MEA Market Value (US$ Billion) by Country, 2022 to 2032 Figure 110: MEA Market Value (US$ Billion) Analysis by Country, 2017 to 2032 Figure 111: MEA Market Value Share (%) and BPS Analysis by Country, 2022 to 2032 Figure 112: MEA Market Y-o-Y Growth (%) Projections by Country, 2022 to 2032 Figure 113: MEA Market Value (US$ Billion) Analysis by Product, 2017 to 2032 Figure 114: MEA Market Value Share (%) and BPS Analysis by Product, 2022 to 2032 Figure 115: MEA Market Y-o-Y Growth (%) Projections by Product, 2022 to 2032 Figure 116: MEA Market Value (US$ Billion) Analysis by End User, 2017 to 2032 Figure 117: MEA Market Value Share (%) and BPS Analysis by End User, 2022 to 2032 Figure 118: MEA Market Y-o-Y Growth (%) Projections by End User, 2022 to 2032 Figure 119: MEA Market Attractiveness by Product, 2022 to 2032 Figure 120: MEA Market Attractiveness by End User, 2022 to 2032 Figure 121: MEA Market Attractiveness by Country, 2022 to 2032
Recommendations
Explore Healthcare Insights
View Reports