Impact Resistant Glass Market Size and Share Forecast Outlook From 2024 to 2034

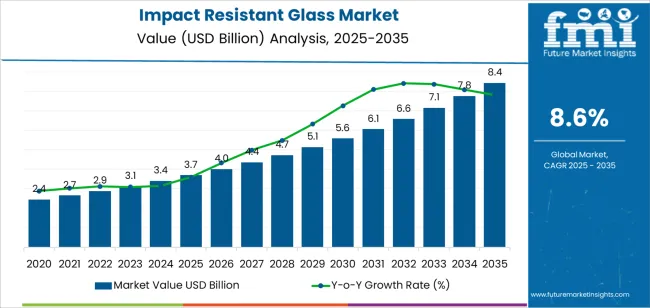
The impact resistant glass market is projected to be worth USD 3.4 billion in 2024. The market is anticipated to reach USD 7.8 billion by 2034. The market is further expected to surge at a CAGR of 8.6% during the forecast period 2024 to 2034.

Key Market Trends and Highlights

There is a rising demand for impact resistant glass, with growing concerns about safety and security in residential, commercial, and automotive sectors. The glass offers protection against breakage, vandalism, burglary, and natural disasters.

  • The implementation of stringent building codes and regulations related to safety standards is driving the demand for impact resistant glass in construction projects. Governments and regulatory bodies worldwide are emphasizing the use of safety glass in buildings to minimize risks during natural disasters and accidents.
  • The growth in construction activities, particularly in emerging economies, is fueling the demand for impact resistant glass. Urbanization, population growth, and infrastructure development projects are driving the construction sector, thereby increasing the need for safety glass solutions.
  • Ongoing advancements in glass manufacturing technologies have led to the development of innovative impact resistant glass products with enhanced performance characteristics. Manufacturers are investing in research and development to improve the strength, durability, and optical clarity of impact resistant glass.
Attributes Key Insights
Impact Resistant Glass Market Estimated Size in 2024 USD 3.4 billion
Projected Market Value in 2034 USD 7.8 billion
Value-based CAGR from 2024 to 2034 8.6%

Comparison of Historical vs Future Outlook on Changing Consumer Trends for Impact Resistant Glass

The scope for impact resistant glass rose at a 10.2% CAGR between 2019 and 2023. The global market is anticipated to grow at a moderate CAGR of 8.6% over the forecast period 2024 to 2034.

The market witnessed steady growth, during the period, driven by factors such as increasing urbanization, rising construction activities, stringent safety regulations, and growing awareness about the benefits of impact resistant glass in various applications.

Technological advancements, such as improvements in glass manufacturing processes, the development of innovative coatings, and the integration of smart glass technologies, contributed to the expansion of the market.

Demand for impact resistant glass surged across sectors including construction, automotive, retail, hospitality, and healthcare, fueled by safety concerns, aesthetic preferences, and regulatory compliance requirements.

Market players focused on product innovation, customization, and strategic partnerships to differentiate their offerings, expand market share, and address emerging customer needs.

The market forecast 2024 to 2034 anticipates robust growth in the market, driven by several key factors. Continued urbanization and infrastructure development in emerging economies, leading to increased demand for impact resistant glass in commercial and residential construction projects. Rising awareness about safety, security, and energy efficiency, driving the adoption of impact resistant glass in buildings, vehicles, and infrastructure.

Stringent building codes, regulations, and sustainability standards mandating the use of safety glass solutions in construction and renovation projects. Technological advancements enabling the development of high performance impact resistant glass products with enhanced strength, durability, and thermal insulation properties.

Factors Driving the Demand for Impact Resistant Glass

Impact resistant glass products with energy efficient properties are gaining popularity among consumers and businesses. The focus on sustainability and energy conservation is driving the adoption of energy efficient glazing solutions, which offer thermal insulation and reduce the reliance on artificial heating and cooling systems.

  • The automotive industry is a significant consumer of impact resistant glass for vehicle windows, windshields, and sunroofs. The growing demand for automobiles, coupled with advancements in automotive safety standards, is driving the adoption of impact resistant glass in the automotive sector.
  • Increasing disposable income levels and urbanization are driving consumer spending on premium and safety enhanced products, including impact resistant glass for homes, offices, and vehicles.
  • Heightened awareness about the impacts of climate change and the need for resilient infrastructure is encouraging investments in impact resistant glass solutions. Governments, businesses, and individuals are increasingly recognizing the importance of adapting to changing environmental conditions and mitigating risks posed by extreme weather events.

Factors Restraining the Growth of the Impact Resistant Glass Market

Impact resistant glass tends to be more expensive than traditional glass products due to the additional manufacturing processes and specialized materials required to enhance its durability and strength.

The higher costs associated with impact resistant glass may deter budget conscious consumers and businesses from adopting these solutions, particularly in price sensitive markets.

  • Despite the benefits of impact resistant glass in enhancing safety, security, and energy efficiency, there may be limited awareness and education among consumers, architects, builders, and developers about its advantages and applications. Lack of awareness about the performance characteristics, durability, and long term cost savings associated with impact resistant glass solutions may hinder market adoption and demand.
  • Retrofitting existing buildings and structures with impact resistant glass can be logistically challenging and expensive. Retrofitting projects may require extensive modifications to existing window frames, building structures, and architectural elements, which can increase costs and disrupt ongoing operations.
  • Some consumers and designers may perceive impact resistant glass as less aesthetically pleasing or restrictive in terms of design options compared to conventional glass products. Concerns about design limitations, visibility distortions, and aesthetic preferences may influence purchasing decisions and deter adoption of impact resistant glass solutions in architectural and interior design applications.

Analysis of Top Countries, Producing and Installing Impact Resistant Glass

The below table showcases revenues in terms of the top 5 leading countries, spearheaded by Korea and the United Kingdom. The countries are expected to lead the market through 2034.

Countries Forecast CAGRs from 2024 to 2034
The United States 9.0%
China 8.9%
The United Kingdom 9.6%
Japan 8.8%
Korea 11.3%

Stringent Building Codes and Regulations Driving the Market in the United States

The impact resistant glass market in the United States expected to expand at a CAGR of 9.0% through 2034. The country has well established building codes and regulations that emphasize safety and resilience in construction.

The adoption of impact resistant glass is driven by building codes in hurricane prone regions such as Florida, where impact resistant glazing is mandated for certain buildings to mitigate damage from hurricanes and severe storms.

The United States is susceptible to a variety of natural disasters, including hurricanes, tornadoes, earthquakes, and wildfires. There is a heightened awareness of the importance of impact resistant glass in protecting buildings and occupants from damage and injury during extreme weather events.

Renovation and Retrofitting to Accelerate Market Growth in the United Kingdom

The impact resistant glass market in the United Kingdom is anticipated to expand at a CAGR of 9.6% through 2034. The country has a significant stock of older buildings that require renovation, refurbishment, and retrofitting to meet contemporary safety and performance standards.

Impact resistant glass can be retrofitted to existing structures to improve safety, security, and energy efficiency without compromising architectural integrity or historical significance.

Safety and security are paramount considerations for building occupants and property owners in the United Kingdom. Impact resistant glass provides enhanced protection against intruders, burglars, and vandalism, offering peace of mind for homeowners, businesses, and public institutions.

Technological Advancements in Glass Manufacturing Spearhead the Market in China

Impact resistant glass trends in China are taking a turn for the better. An 8.9% CAGR is forecast for the country from 2024 to 2034. Technological innovations in glass manufacturing processes have led to the development of advanced impact resistant glass products with improved strength, clarity, and performance characteristics.

Chinese glass manufacturers invest in research and development to enhance product quality, durability, and aesthetic appeal to meet the evolving demands of the market.

Impact resistant glass is widely used in the automotive and transportation sectors for vehicle windows, windshields, and other glazing applications. The rapid expansion of the automotive industry in China, coupled with increasing consumer demand for safety features and comfort, drives the demand for impact resistant glass products in automobile manufacturing.
Preference for High Quality Building Materials Fueling the Market in Japan

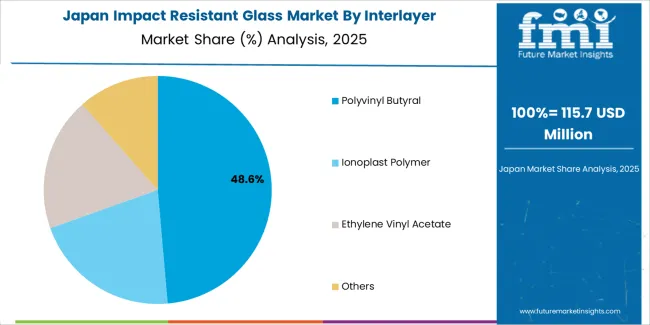
The impact resistant glass market in Japan is poised to expand at a CAGR of 8.8% through 2034. Japanese consumers prioritize quality, reliability, and durability when selecting building materials for residential and commercial properties.

Impact resistant glass is perceived as a premium building material that offers superior safety, security, and longevity compared to conventional glass products, driving its adoption in architectural and interior design applications.

Japan is a leading producer of automotive vehicles and components, driving innovation in automotive glazing technologies. Impact resistant glass is used in vehicle windows, windshields, and sunroofs to improve occupant safety, visibility, and crashworthiness in automobiles. The demand for impact resistant glass in the automotive sector contributes to market growth in Japan.
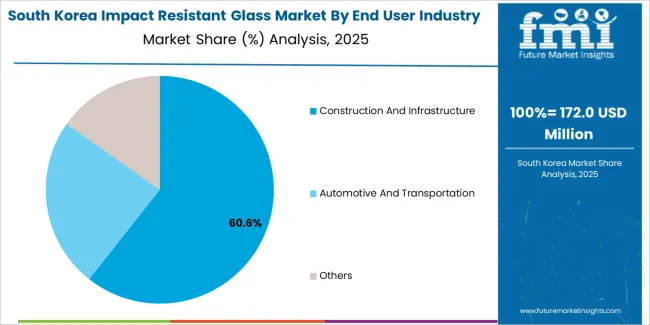
Safety and Security Concerns Driving the Demand in Korea

The impact resistant glass market in Korea is anticipated to expand at a CAGR of 11.3% through 2034.Safety and security concerns are paramount in the Korean society, driving the demand for impact resistant glass in residential, commercial, and public buildings.

Impact resistant glass provides protection against break ins, forced entry attempts, and vandalism, enhancing the safety and security of occupants and assets.

The luxury real estate market in Korea caters to affluent consumers seeking high end residential properties, penthouses, and luxury condominiums with premium amenities and state of the art features. Impact resistant glass adds value to luxury properties by offering exclusivity, prestige, and superior performance in terms of safety, security, and comfort.

Impact Resistant Glass Industry Analysis by Top Investment Segments

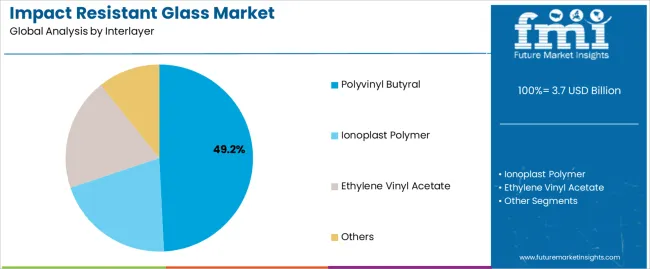
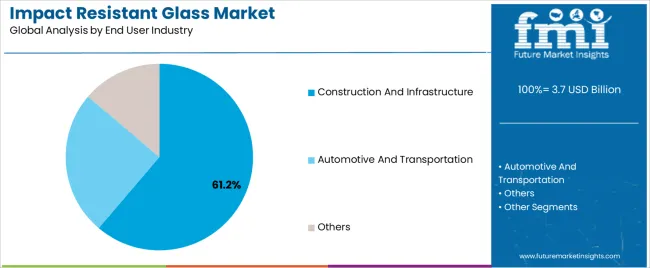
The below table highlights how polyvinyl butyral segment is projected to lead the market in terms of interlayer, and is expected to account for a CAGR of 8.3% through 2034. Based on end user industry, the construction and infrastructure segment is expected to account for a CAGR of 8.1% through 2034.

Category CAGR from 2024 to 2034
Polyvinyl Butyral 8.3%
Construction and Infrastructure 8.1%

Polyvinyl Butyral Claims High Demand for Impact Resistant Glass

Based on interlayer, the polyvinyl butyral segment is expected to continue dominating the impact resistant glass market. Polyvinyl butyral is known for its excellent impact resistance properties, making it an ideal interlayer material for impact resistant glass. PVB helps hold glass fragments together upon impact, reducing the risk of shattering and enhancing safety in buildings, vehicles, and other applications.

The use of polyvinyl butyral interlayers significantly improves the safety and security of glass structures by providing resistance to forced entry, vandalism, and natural disasters such as hurricanes and earthquakes. There is a growing demand for impact resistant glass featuring polyvinyl butyral interlayers, as safety regulations and building codes become more stringent.

Construction and Infrastructure Segment to Hold High Demand for Impact Resistant Glass

In terms of end user industry, the construction and infrastructure segment is expected to continue dominating the impact resistant glass market. Increasingly stringent safety regulations and building codes mandate the use of impact resistant glass in construction projects, particularly in high rise buildings, commercial structures, and public infrastructure.

Impact resistant glass helps mitigate the risk of glass breakage, injuries, and property damage during natural disasters, accidents, and forced entry attempts.

Rapid urbanization, population growth, and infrastructure development drive the demand for impact resistant glass in urban centers, transportation hubs, and public facilities. There is a growing need for resilient building materials, including impact resistant glass, to enhance safety, durability, and sustainability in construction projects.
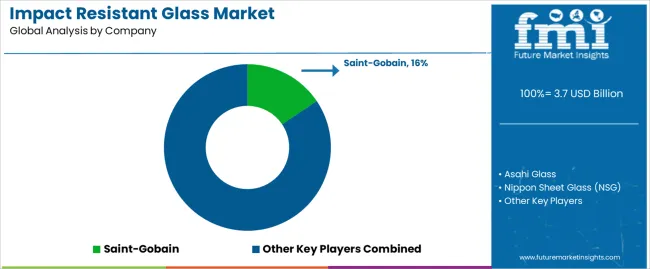
Key Players and Market Concentration in the Impact Resistant Glass Market

The competitive landscape of the impact resistant glass market is characterized by the presence of numerous global, regional, and local players competing based on product innovation, technological advancements, pricing strategies, distribution networks, and market positioning.

The market is dynamic and evolving, driven by changing consumer preferences, regulatory requirements, and technological innovations in glass manufacturing and processing.

Company Portfolio

  • Asahi Glass, also known as AGC, is a global glass manufacturing company that offers a wide range of glass products, including impact resistant glass solutions. The impact resistant glass products of the company are designed to meet stringent safety standards and are used in various applications such as automotive, construction, and electronics.
  • Nippon Sheet Glass is a leading glass manufacturer known for its high quality glass products, including impact resistant glass. The impact resistant glass offerings by the company include laminated glass and tempered glass solutions that provide enhanced safety and security in buildings, vehicles, and other applications.

Key Shifting Preferences Covered in the Impact Resistant Glass Industry Report

  • Opportunities for Impact Resistant Glass Market in India
  • Categorical Analysis on Acrylonitrile Butadiene Styrene
  • Adjacent Study on Tempered Glass Market, Laminated Glass Market, and Bulletproof Glass Market
  • Competition Analysis in the Impact Resistant Glass Market with Focus on Asahi Glass, Saint-Gobain, Nippon Sheet Glass’ Strategy
  • Strategies for Safety Glass Manufacturers
  • Commercial Sector Demand for Safety Glass

Key Shifting Preferences Covered in the Impact Resistant Glass Market Report

Attribute Details
Estimated Market Size in 2024 USD 3.4 billion
Projected Market Valuation in 2034 USD 7.8 billion
Value-based CAGR 2024 to 2034 8.6%
Forecast Period 2024 to 2034
Historical Data Available for 2019 to 2023
Market Analysis Value in USD billion
Key Regions Covered North America; Latin America; Western Europe; Eastern Europe; South Asia and Pacific; East Asia; The Middle East & Africa
Key Market Segments Covered Interlayer, End User Industry, Region
Key Countries Profiled The United States, Canada, Brazil, Mexico, Germany, France, France, Spain, Italy, Russia, Poland, Czech Republic, Romania, India, Bangladesh, Australia, New Zealand, China, Japan, South Korea, GCC countries, South Africa, Israel
Key Companies Profiled Asahi Glass; Nippon Sheet Glass (NSG); Saint-Gobain; Guardian Industries; Fuyao Glass Industry Group; Central Glass; Sisecam Group; Taiwan Glass; Vitro, S.A.B. De C.V.; CGS Holding Co., Ltd.; Cardinal Glass Industries; Euroglas GmbH

Top Segments Studied in the Impact Resistant Glass Market

By Interlayer:

  • Polyvinyl Butyral
  • Ionoplast Polymer
  • Ethylene Vinyl Acetate
  • Others

By End User Industry:

  • Construction and Infrastructure
  • Automotive and Transportation
  • Others

By Region:

  • North America
  • Latin America
  • Western Europe
  • Eastern Europe
  • South Asia and Pacific
  • East Asia
  • The Middle East and Africa

Table of Content

  • 1. Executive Summary
  • 2. Market Overview
  • 3. Market Background
  • 4. Global Market Analysis 2019 to 2023 and Forecast, 2024 to 2034
  • 5. Global Market Analysis 2019 to 2023 and Forecast 2024 to 2034, By Interlayer
    • 5.1. Polyvinyl Butyral
    • 5.2. Ionoplast Polymer
    • 5.3. Ethylene Vinyl Acetate
    • 5.4. Others
  • 6. Global Market Analysis 2019 to 2023 and Forecast 2024 to 2034, By End-Use Industry
    • 6.1. Construction & Infrastructure
    • 6.2. Automotive & Transportation
    • 6.3. Others
  • 7. Global Market Analysis 2019 to 2023 and Forecast 2024 to 2034, By Region
    • 7.1. North America
    • 7.2. Latin America
    • 7.3. Western Europe
    • 7.4. Eastern Europe
    • 7.5. South Asia and Pacific
    • 7.6. East Asia
    • 7.7. Middle East and Africa
  • 8. North America Market Analysis 2019 to 2023 and Forecast 2024 to 2034, By Country
  • 9. Latin America Market Analysis 2019 to 2023 and Forecast 2024 to 2034, By Country
  • 10. Western Europe Market Analysis 2019 to 2023 and Forecast 2024 to 2034, By Country
  • 11. Eastern Europe Market Analysis 2019 to 2023 and Forecast 2024 to 2034, By Country
  • 12. South Asia and Pacific Market Analysis 2019 to 2023 and Forecast 2024 to 2034, By Country
  • 13. East Asia Market Analysis 2019 to 2023 and Forecast 2024 to 2034, By Country
  • 14. Middle East and Africa Market Analysis 2019 to 2023 and Forecast 2024 to 2034, By Country
  • 15. Key Countries Market Analysis
  • 16. Market Structure Analysis
  • 17. Competition Analysis
    • 17.1. Asahi Glass
    • 17.2. Nippon Sheet Glass (NSG)
    • 17.3. Saint-Gobain
    • 17.4. Guardian Industries
    • 17.5. Fuyao Glass Industry Group
    • 17.6. Central Glass
    • 17.7. Sisecam Group
    • 17.8. Taiwan Glass
    • 17.9. Vitro, S.A.B. De C.V.
    • 17.10. CGS Holding Co., Ltd.
    • 17.11. Cardinal Glass Industries
    • 17.12. Euroglas GmbH
  • 18. Assumptions & Acronyms Used
  • 19. Research Methodology

List of Tables

Table 1: Global Market Value (US$ Million) Forecast by Region, 2019 to 2034

Table 2: Global Market Volume (Square Feet) Forecast by Region, 2019 to 2034

Table 3: Global Market Value (US$ Million) Forecast by Interlayer, 2019 to 2034

Table 4: Global Market Volume (Square Feet) Forecast by Interlayer, 2019 to 2034

Table 5: Global Market Value (US$ Million) Forecast by End-Use Industry, 2019 to 2034

Table 6: Global Market Volume (Square Feet) Forecast by End-Use Industry, 2019 to 2034

Table 7: North America Market Value (US$ Million) Forecast by Country, 2019 to 2034

Table 8: North America Market Volume (Square Feet) Forecast by Country, 2019 to 2034

Table 9: North America Market Value (US$ Million) Forecast by Interlayer, 2019 to 2034

Table 10: North America Market Volume (Square Feet) Forecast by Interlayer, 2019 to 2034

Table 11: North America Market Value (US$ Million) Forecast by End-Use Industry, 2019 to 2034

Table 12: North America Market Volume (Square Feet) Forecast by End-Use Industry, 2019 to 2034

Table 13: Latin America Market Value (US$ Million) Forecast by Country, 2019 to 2034

Table 14: Latin America Market Volume (Square Feet) Forecast by Country, 2019 to 2034

Table 15: Latin America Market Value (US$ Million) Forecast by Interlayer, 2019 to 2034

Table 16: Latin America Market Volume (Square Feet) Forecast by Interlayer, 2019 to 2034

Table 17: Latin America Market Value (US$ Million) Forecast by End-Use Industry, 2019 to 2034

Table 18: Latin America Market Volume (Square Feet) Forecast by End-Use Industry, 2019 to 2034

Table 19: Western Europe Market Value (US$ Million) Forecast by Country, 2019 to 2034

Table 20: Western Europe Market Volume (Square Feet) Forecast by Country, 2019 to 2034

Table 21: Western Europe Market Value (US$ Million) Forecast by Interlayer, 2019 to 2034

Table 22: Western Europe Market Volume (Square Feet) Forecast by Interlayer, 2019 to 2034

Table 23: Western Europe Market Value (US$ Million) Forecast by End-Use Industry, 2019 to 2034

Table 24: Western Europe Market Volume (Square Feet) Forecast by End-Use Industry, 2019 to 2034

Table 25: Eastern Europe Market Value (US$ Million) Forecast by Country, 2019 to 2034

Table 26: Eastern Europe Market Volume (Square Feet) Forecast by Country, 2019 to 2034

Table 27: Eastern Europe Market Value (US$ Million) Forecast by Interlayer, 2019 to 2034

Table 28: Eastern Europe Market Volume (Square Feet) Forecast by Interlayer, 2019 to 2034

Table 29: Eastern Europe Market Value (US$ Million) Forecast by End-Use Industry, 2019 to 2034

Table 30: Eastern Europe Market Volume (Square Feet) Forecast by End-Use Industry, 2019 to 2034

Table 31: South Asia and Pacific Market Value (US$ Million) Forecast by Country, 2019 to 2034

Table 32: South Asia and Pacific Market Volume (Square Feet) Forecast by Country, 2019 to 2034

Table 33: South Asia and Pacific Market Value (US$ Million) Forecast by Interlayer, 2019 to 2034

Table 34: South Asia and Pacific Market Volume (Square Feet) Forecast by Interlayer, 2019 to 2034

Table 35: South Asia and Pacific Market Value (US$ Million) Forecast by End-Use Industry, 2019 to 2034

Table 36: South Asia and Pacific Market Volume (Square Feet) Forecast by End-Use Industry, 2019 to 2034

Table 37: East Asia Market Value (US$ Million) Forecast by Country, 2019 to 2034

Table 38: East Asia Market Volume (Square Feet) Forecast by Country, 2019 to 2034

Table 39: East Asia Market Value (US$ Million) Forecast by Interlayer, 2019 to 2034

Table 40: East Asia Market Volume (Square Feet) Forecast by Interlayer, 2019 to 2034

Table 41: East Asia Market Value (US$ Million) Forecast by End-Use Industry, 2019 to 2034

Table 42: East Asia Market Volume (Square Feet) Forecast by End-Use Industry, 2019 to 2034

Table 43: Middle East and Africa Market Value (US$ Million) Forecast by Country, 2019 to 2034

Table 44: Middle East and Africa Market Volume (Square Feet) Forecast by Country, 2019 to 2034

Table 45: Middle East and Africa Market Value (US$ Million) Forecast by Interlayer, 2019 to 2034

Table 46: Middle East and Africa Market Volume (Square Feet) Forecast by Interlayer, 2019 to 2034

Table 47: Middle East and Africa Market Value (US$ Million) Forecast by End-Use Industry, 2019 to 2034

Table 48: Middle East and Africa Market Volume (Square Feet) Forecast by End-Use Industry, 2019 to 2034

List of Figures

Figure 1: Global Market Value (US$ Million) by Interlayer, 2024 to 2034

Figure 2: Global Market Value (US$ Million) by End-Use Industry, 2024 to 2034

Figure 3: Global Market Value (US$ Million) by Region, 2024 to 2034

Figure 4: Global Market Value (US$ Million) Analysis by Region, 2019 to 2034

Figure 5: Global Market Volume (Square Feet) Analysis by Region, 2019 to 2034

Figure 6: Global Market Value Share (%) and BPS Analysis by Region, 2024 to 2034

Figure 7: Global Market Y-o-Y Growth (%) Projections by Region, 2024 to 2034

Figure 8: Global Market Value (US$ Million) Analysis by Interlayer, 2019 to 2034

Figure 9: Global Market Volume (Square Feet) Analysis by Interlayer, 2019 to 2034

Figure 10: Global Market Value Share (%) and BPS Analysis by Interlayer, 2024 to 2034

Figure 11: Global Market Y-o-Y Growth (%) Projections by Interlayer, 2024 to 2034

Figure 12: Global Market Value (US$ Million) Analysis by End-Use Industry, 2019 to 2034

Figure 13: Global Market Volume (Square Feet) Analysis by End-Use Industry, 2019 to 2034

Figure 14: Global Market Value Share (%) and BPS Analysis by End-Use Industry, 2024 to 2034

Figure 15: Global Market Y-o-Y Growth (%) Projections by End-Use Industry, 2024 to 2034

Figure 16: Global Market Attractiveness by Interlayer, 2024 to 2034

Figure 17: Global Market Attractiveness by End-Use Industry, 2024 to 2034

Figure 18: Global Market Attractiveness by Region, 2024 to 2034

Figure 19: North America Market Value (US$ Million) by Interlayer, 2024 to 2034

Figure 20: North America Market Value (US$ Million) by End-Use Industry, 2024 to 2034

Figure 21: North America Market Value (US$ Million) by Country, 2024 to 2034

Figure 22: North America Market Value (US$ Million) Analysis by Country, 2019 to 2034

Figure 23: North America Market Volume (Square Feet) Analysis by Country, 2019 to 2034

Figure 24: North America Market Value Share (%) and BPS Analysis by Country, 2024 to 2034

Figure 25: North America Market Y-o-Y Growth (%) Projections by Country, 2024 to 2034

Figure 26: North America Market Value (US$ Million) Analysis by Interlayer, 2019 to 2034

Figure 27: North America Market Volume (Square Feet) Analysis by Interlayer, 2019 to 2034

Figure 28: North America Market Value Share (%) and BPS Analysis by Interlayer, 2024 to 2034

Figure 29: North America Market Y-o-Y Growth (%) Projections by Interlayer, 2024 to 2034

Figure 30: North America Market Value (US$ Million) Analysis by End-Use Industry, 2019 to 2034

Figure 31: North America Market Volume (Square Feet) Analysis by End-Use Industry, 2019 to 2034

Figure 32: North America Market Value Share (%) and BPS Analysis by End-Use Industry, 2024 to 2034

Figure 33: North America Market Y-o-Y Growth (%) Projections by End-Use Industry, 2024 to 2034

Figure 34: North America Market Attractiveness by Interlayer, 2024 to 2034

Figure 35: North America Market Attractiveness by End-Use Industry, 2024 to 2034

Figure 36: North America Market Attractiveness by Country, 2024 to 2034

Figure 37: Latin America Market Value (US$ Million) by Interlayer, 2024 to 2034

Figure 38: Latin America Market Value (US$ Million) by End-Use Industry, 2024 to 2034

Figure 39: Latin America Market Value (US$ Million) by Country, 2024 to 2034

Figure 40: Latin America Market Value (US$ Million) Analysis by Country, 2019 to 2034

Figure 41: Latin America Market Volume (Square Feet) Analysis by Country, 2019 to 2034

Figure 42: Latin America Market Value Share (%) and BPS Analysis by Country, 2024 to 2034

Figure 43: Latin America Market Y-o-Y Growth (%) Projections by Country, 2024 to 2034

Figure 44: Latin America Market Value (US$ Million) Analysis by Interlayer, 2019 to 2034

Figure 45: Latin America Market Volume (Square Feet) Analysis by Interlayer, 2019 to 2034

Figure 46: Latin America Market Value Share (%) and BPS Analysis by Interlayer, 2024 to 2034

Figure 47: Latin America Market Y-o-Y Growth (%) Projections by Interlayer, 2024 to 2034

Figure 48: Latin America Market Value (US$ Million) Analysis by End-Use Industry, 2019 to 2034

Figure 49: Latin America Market Volume (Square Feet) Analysis by End-Use Industry, 2019 to 2034

Figure 50: Latin America Market Value Share (%) and BPS Analysis by End-Use Industry, 2024 to 2034

Figure 51: Latin America Market Y-o-Y Growth (%) Projections by End-Use Industry, 2024 to 2034

Figure 52: Latin America Market Attractiveness by Interlayer, 2024 to 2034

Figure 53: Latin America Market Attractiveness by End-Use Industry, 2024 to 2034

Figure 54: Latin America Market Attractiveness by Country, 2024 to 2034

Figure 55: Western Europe Market Value (US$ Million) by Interlayer, 2024 to 2034

Figure 56: Western Europe Market Value (US$ Million) by End-Use Industry, 2024 to 2034

Figure 57: Western Europe Market Value (US$ Million) by Country, 2024 to 2034

Figure 58: Western Europe Market Value (US$ Million) Analysis by Country, 2019 to 2034

Figure 59: Western Europe Market Volume (Square Feet) Analysis by Country, 2019 to 2034

Figure 60: Western Europe Market Value Share (%) and BPS Analysis by Country, 2024 to 2034

Figure 61: Western Europe Market Y-o-Y Growth (%) Projections by Country, 2024 to 2034

Figure 62: Western Europe Market Value (US$ Million) Analysis by Interlayer, 2019 to 2034

Figure 63: Western Europe Market Volume (Square Feet) Analysis by Interlayer, 2019 to 2034

Figure 64: Western Europe Market Value Share (%) and BPS Analysis by Interlayer, 2024 to 2034

Figure 65: Western Europe Market Y-o-Y Growth (%) Projections by Interlayer, 2024 to 2034

Figure 66: Western Europe Market Value (US$ Million) Analysis by End-Use Industry, 2019 to 2034

Figure 67: Western Europe Market Volume (Square Feet) Analysis by End-Use Industry, 2019 to 2034

Figure 68: Western Europe Market Value Share (%) and BPS Analysis by End-Use Industry, 2024 to 2034

Figure 69: Western Europe Market Y-o-Y Growth (%) Projections by End-Use Industry, 2024 to 2034

Figure 70: Western Europe Market Attractiveness by Interlayer, 2024 to 2034

Figure 71: Western Europe Market Attractiveness by End-Use Industry, 2024 to 2034

Figure 72: Western Europe Market Attractiveness by Country, 2024 to 2034

Figure 73: Eastern Europe Market Value (US$ Million) by Interlayer, 2024 to 2034

Figure 74: Eastern Europe Market Value (US$ Million) by End-Use Industry, 2024 to 2034

Figure 75: Eastern Europe Market Value (US$ Million) by Country, 2024 to 2034

Figure 76: Eastern Europe Market Value (US$ Million) Analysis by Country, 2019 to 2034

Figure 77: Eastern Europe Market Volume (Square Feet) Analysis by Country, 2019 to 2034

Figure 78: Eastern Europe Market Value Share (%) and BPS Analysis by Country, 2024 to 2034

Figure 79: Eastern Europe Market Y-o-Y Growth (%) Projections by Country, 2024 to 2034

Figure 80: Eastern Europe Market Value (US$ Million) Analysis by Interlayer, 2019 to 2034

Figure 81: Eastern Europe Market Volume (Square Feet) Analysis by Interlayer, 2019 to 2034

Figure 82: Eastern Europe Market Value Share (%) and BPS Analysis by Interlayer, 2024 to 2034

Figure 83: Eastern Europe Market Y-o-Y Growth (%) Projections by Interlayer, 2024 to 2034

Figure 84: Eastern Europe Market Value (US$ Million) Analysis by End-Use Industry, 2019 to 2034

Figure 85: Eastern Europe Market Volume (Square Feet) Analysis by End-Use Industry, 2019 to 2034

Figure 86: Eastern Europe Market Value Share (%) and BPS Analysis by End-Use Industry, 2024 to 2034

Figure 87: Eastern Europe Market Y-o-Y Growth (%) Projections by End-Use Industry, 2024 to 2034

Figure 88: Eastern Europe Market Attractiveness by Interlayer, 2024 to 2034

Figure 89: Eastern Europe Market Attractiveness by End-Use Industry, 2024 to 2034

Figure 90: Eastern Europe Market Attractiveness by Country, 2024 to 2034

Figure 91: South Asia and Pacific Market Value (US$ Million) by Interlayer, 2024 to 2034

Figure 92: South Asia and Pacific Market Value (US$ Million) by End-Use Industry, 2024 to 2034

Figure 93: South Asia and Pacific Market Value (US$ Million) by Country, 2024 to 2034

Figure 94: South Asia and Pacific Market Value (US$ Million) Analysis by Country, 2019 to 2034

Figure 95: South Asia and Pacific Market Volume (Square Feet) Analysis by Country, 2019 to 2034

Figure 96: South Asia and Pacific Market Value Share (%) and BPS Analysis by Country, 2024 to 2034

Figure 97: South Asia and Pacific Market Y-o-Y Growth (%) Projections by Country, 2024 to 2034

Figure 98: South Asia and Pacific Market Value (US$ Million) Analysis by Interlayer, 2019 to 2034

Figure 99: South Asia and Pacific Market Volume (Square Feet) Analysis by Interlayer, 2019 to 2034

Figure 100: South Asia and Pacific Market Value Share (%) and BPS Analysis by Interlayer, 2024 to 2034

Figure 101: South Asia and Pacific Market Y-o-Y Growth (%) Projections by Interlayer, 2024 to 2034

Figure 102: South Asia and Pacific Market Value (US$ Million) Analysis by End-Use Industry, 2019 to 2034

Figure 103: South Asia and Pacific Market Volume (Square Feet) Analysis by End-Use Industry, 2019 to 2034

Figure 104: South Asia and Pacific Market Value Share (%) and BPS Analysis by End-Use Industry, 2024 to 2034

Figure 105: South Asia and Pacific Market Y-o-Y Growth (%) Projections by End-Use Industry, 2024 to 2034

Figure 106: South Asia and Pacific Market Attractiveness by Interlayer, 2024 to 2034

Figure 107: South Asia and Pacific Market Attractiveness by End-Use Industry, 2024 to 2034

Figure 108: South Asia and Pacific Market Attractiveness by Country, 2024 to 2034

Figure 109: East Asia Market Value (US$ Million) by Interlayer, 2024 to 2034

Figure 110: East Asia Market Value (US$ Million) by End-Use Industry, 2024 to 2034

Figure 111: East Asia Market Value (US$ Million) by Country, 2024 to 2034

Figure 112: East Asia Market Value (US$ Million) Analysis by Country, 2019 to 2034

Figure 113: East Asia Market Volume (Square Feet) Analysis by Country, 2019 to 2034

Figure 114: East Asia Market Value Share (%) and BPS Analysis by Country, 2024 to 2034

Figure 115: East Asia Market Y-o-Y Growth (%) Projections by Country, 2024 to 2034

Figure 116: East Asia Market Value (US$ Million) Analysis by Interlayer, 2019 to 2034

Figure 117: East Asia Market Volume (Square Feet) Analysis by Interlayer, 2019 to 2034

Figure 118: East Asia Market Value Share (%) and BPS Analysis by Interlayer, 2024 to 2034

Figure 119: East Asia Market Y-o-Y Growth (%) Projections by Interlayer, 2024 to 2034

Figure 120: East Asia Market Value (US$ Million) Analysis by End-Use Industry, 2019 to 2034

Figure 121: East Asia Market Volume (Square Feet) Analysis by End-Use Industry, 2019 to 2034

Figure 122: East Asia Market Value Share (%) and BPS Analysis by End-Use Industry, 2024 to 2034

Figure 123: East Asia Market Y-o-Y Growth (%) Projections by End-Use Industry, 2024 to 2034

Figure 124: East Asia Market Attractiveness by Interlayer, 2024 to 2034

Figure 125: East Asia Market Attractiveness by End-Use Industry, 2024 to 2034

Figure 126: East Asia Market Attractiveness by Country, 2024 to 2034

Figure 127: Middle East and Africa Market Value (US$ Million) by Interlayer, 2024 to 2034

Figure 128: Middle East and Africa Market Value (US$ Million) by End-Use Industry, 2024 to 2034

Figure 129: Middle East and Africa Market Value (US$ Million) by Country, 2024 to 2034

Figure 130: Middle East and Africa Market Value (US$ Million) Analysis by Country, 2019 to 2034

Figure 131: Middle East and Africa Market Volume (Square Feet) Analysis by Country, 2019 to 2034

Figure 132: Middle East and Africa Market Value Share (%) and BPS Analysis by Country, 2024 to 2034

Figure 133: Middle East and Africa Market Y-o-Y Growth (%) Projections by Country, 2024 to 2034

Figure 134: Middle East and Africa Market Value (US$ Million) Analysis by Interlayer, 2019 to 2034

Figure 135: Middle East and Africa Market Volume (Square Feet) Analysis by Interlayer, 2019 to 2034

Figure 136: Middle East and Africa Market Value Share (%) and BPS Analysis by Interlayer, 2024 to 2034

Figure 137: Middle East and Africa Market Y-o-Y Growth (%) Projections by Interlayer, 2024 to 2034

Figure 138: Middle East and Africa Market Value (US$ Million) Analysis by End-Use Industry, 2019 to 2034

Figure 139: Middle East and Africa Market Volume (Square Feet) Analysis by End-Use Industry, 2019 to 2034

Figure 140: Middle East and Africa Market Value Share (%) and BPS Analysis by End-Use Industry, 2024 to 2034

Figure 141: Middle East and Africa Market Y-o-Y Growth (%) Projections by End-Use Industry, 2024 to 2034

Figure 142: Middle East and Africa Market Attractiveness by Interlayer, 2024 to 2034

Figure 143: Middle East and Africa Market Attractiveness by End-Use Industry, 2024 to 2034

Figure 144: Middle East and Africa Market Attractiveness by Country, 2024 to 2034

Frequently Asked Questions

What is the anticipated value of the Impact Resistant Glass market in 2024?

The impact resistant glass market is projected to reach a valuation of USD 3.4 billion in 2024.

What is the expected CAGR for the Impact Resistant Glass market until 2034?

The impact resistant glass industry is set to expand by a CAGR of 8.6% through 2034.

How much valuation is projected for the Impact Resistant Glass market in 2034?

The impact resistant glass market is forecast to reach USD 7.8 billion by 2034.

Which country is projected to lead the Impact Resistant Glass market?

Korea is expected to be the top performing market, exhibiting a CAGR of 11.3% through 2034.

Which is the dominant interlayer in the Impact Resistant Glass domain?

Polyvinyl butyral segment is preferred, and is expected to account for a CAGR of 8.3% through 2034.

Explore Similar Insights

Future Market Insights

Impact Resistant Glass Market