In-mold Labels Market Size and Share Forecast Outlook 2025 to 2035

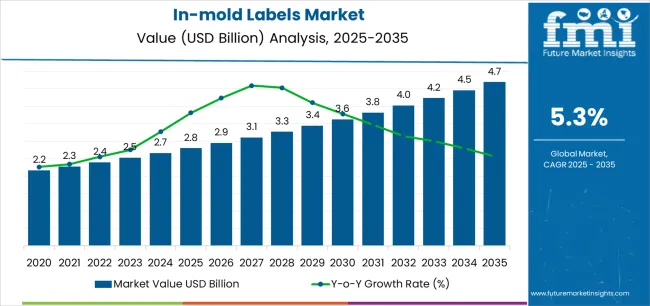
The global in-mold labels market is valued at USD 2.8 billion in 2025 and is slated to reach USD 4.7 billion by 2035, recording an absolute increase of USD 1.9 billion over the forecast period. This translates into a total growth of 67.9%, with the market forecast to expand at a CAGR of 5.3% between 2025 and 2035. The market size is expected to grow by approximately 1.68X during the same period, supported by increasing demand for premium packaging solutions, expanding food and beverage industry applications, and rising adoption of efficient labeling technologies across consumer goods, automotive, and personal care applications.
Quick Stats for In-mold Labels Market

  • In-mold Labels Market Value (2025): USD 2.8 billion
  • In-mold Labels Market Forecast Value (2035): USD 4.7 billion
  • In-mold Labels Market Forecast CAGR: 5.3%
  • Leading Technology in In-mold Labels Market: Injection Molding (68.7%)
  • Key Growth Regions in In-mold Labels Market: Asia Pacific, North America, and Europe
  • Key Players in In-mold Labels Market: Multi-Color Corporation, CCL Industries, Constantia Flexibles, Huhtamaki Group, Coveris Holdings, Fort Dearborn Company

In Mold Labels Market Market Value Analysis

Between 2025 and 2030, the in-mold labels market is projected to expand from USD 2.8 billion to USD 3.6 billion, resulting in a value increase of USD 0.8 billion, which represents 42.1% of the total forecast growth for the decade. This phase of development will be shaped by increasing consumer preference for premium packaging aesthetics, rising adoption of automation in packaging processes, and growing demand for labels with enhanced durability and visual appeal. Packaging manufacturers are expanding their in-mold labeling capabilities to address the growing demand for food packaging applications, personal care containers, and automotive component labeling requirements.

In-mold Labels Market Key Takeaways

Metric Value
Estimated Value in (2025E) USD 2.8 billion
Forecast Value in (2035F) USD 4.7 billion
Forecast CAGR (2025 to 2035) 5.3%

The packaging market contributes the largest share, accounting for approximately 35–40%, as IML technology is primarily used in packaging applications, including food and beverage, personal care, and consumer goods, offering high-quality graphics and durability. The plastic molding market adds around 25–30%, as IML is a critical component in injection and blow molding processes, where labels are integrated directly into the plastic products during manufacturing. This makes IML a key part of molded plastic product packaging.

The labeling market contributes about 15–18%, as IML is a prominent labeling solution in various industries due to its resistance to wear, moisture, and chemicals. It provides superior adhesion compared to traditional adhesive labels, making it ideal for products that need long-lasting, high-quality graphics. The consumer goods packaging market represents roughly 10–12%, as manufacturers seek innovative ways to enhance product appeal and differentiation through vibrant and durable labels. The food and beverage packaging market accounts for around 8–10%, as IML labels are widely used for food containers, bottles, and jars, where aesthetics, branding, and regulatory information play a key role in consumer purchasing decisions.

Why is the In-mold Labels Market Growing?

Market expansion is being supported by the increasing consumer demand for premium packaging aesthetics and the corresponding need for labeling solutions that can provide exceptional visual appeal, integrated application processes, and durability features while enabling cost-effective production and supporting brand differentiation strategies across food and beverage, personal care, and household products packaging operations. Modern brand owners and packaging manufacturers are increasingly focused on implementing labeling solutions that can improve packaging appearance, reduce production steps, and provide consistent performance throughout complex manufacturing and distribution networks. In-mold labels' proven ability to deliver exceptional visual quality, enable integrated manufacturing processes, and support cost-effective production make them essential components for contemporary packaging solutions and brand presentation strategies.

The growing emphasis on packaging efficiency and brand differentiation is driving demand for in-mold labels that can support integrated production requirements, improve manufacturing efficiency, and enable distinctive packaging designs. Brand owners' preference for labels that combine visual appeal with production efficiency and processing compatibility is creating opportunities for innovative in-mold labeling implementations. The rising influence of e-commerce packaging requirements and premium product positioning is also contributing to increased demand for in-mold labels that can provide enhanced durability, visual impact, and integration with automated packaging systems across diverse market applications.

Opportunity Pathways - In-mold Labels Market

The in-mold labels market is poised for robust growth and evolution. As brand owners, packaging manufacturers, and consumer goods companies seek labels that deliver exceptional visual appeal, production efficiency, and manufacturing integration, in-mold labels are gaining prominence not just as decorative elements but as strategic enablers of efficient packaging systems and brand communication.

Rising consumer preference for premium packaging in developing regions and expanding food processing industry globally amplify demand, while manufacturers are leveraging innovations in printing technology, smart labeling systems, and advanced material formulations.

Pathways like digital printing integration, enhanced barrier properties, and application-specific material configurations promise strong adoption rates, especially in high-growth segments. Geographic expansion and brand partnership development will capture volume, particularly where local manufacturing capabilities and packaging industry proximity are critical. Regulatory pressures around food safety requirements, packaging efficiency standards, recycling compatibility, and quality compliance give structural support.

  • Pathway A - Digital Printing & Variable Data Integration. Brand owners and packaging manufacturers increasingly require in-mold labels with digital printing capabilities for variable graphics, personalization features, and short-run production capabilities for market responsiveness. Label producers who develop digital-compatible solutions with high-resolution output can command premium positioning. Expected revenue pool: USD 420 million - USD 650 million.
  • Pathway B - Enhanced Barrier Properties & Food Safety. Growing demand for food safety compliance, extended shelf life, and enhanced barrier performance drives need for in-mold labels manufactured with specialized barrier films and FDA-approved materials while maintaining visual quality standards. Opportunity: USD 380 million - USD 590 million.
  • Pathway C - Automotive & Technical Applications. Advanced material formulations including heat-resistant, chemical-resistant, and UV-stable options enable superior performance in automotive interior, industrial equipment, and technical component applications. Revenue lift: USD 340 million - USD 520 million.
  • Pathway D - Premium Decoration & Holographic Effects. Expanding reach into high-end packaging solutions with metallic finishes, holographic elements, and specialized visual effects for luxury goods, cosmetics, and premium consumer products. Brand owners will seek partners who supply advanced decoration capabilities with visual impact. Pool: USD 310 million - USD 480 million.
  • Pathway E - Geographic Expansion & Emerging Market Development. Strong growth in Asia Pacific, particularly China, India, and Southeast Asia. Local production lowers costs, reduces logistics dependencies, and enables faster response to packaging industry requirements. Expected upside: USD 520 million - USD 820 million.
  • Pathway F - Direct Brand Partnerships & Custom Solutions. Increasing demand for direct manufacturer-to-brand relationships with customized labeling solutions, design services, and integrated production programs for specialized packaging applications. USD 390 million - USD 610 million.
  • Pathway G - Automation Compatible & High-Speed Systems. Developing labels optimized for automated application systems with precise dimensional tolerances, enhanced handling characteristics, and high-speed production compatibility. Growing demand from packaging manufacturers transitioning to automated labeling lines. Pool: USD 320 million - USD 490 million.

Segmental Analysis

The market is segmented by technology type, material type, end-use industry, printing technique, and region. By technology type, the market is divided into Injection Molding, Blow Molding, and Thermoforming. By material type, it covers Polypropylene (PP), Polyethylene (PE), PET, and others (PVC, PS). By end-use industry, it includes Food & Beverages, Personal Care & Cosmetics, Automotive, Household Products, and others. By printing technique, it is categorized into Flexographic, Digital, Gravure, and Screen Printing. Regionally, the market is divided into North America, Europe, Asia Pacific, Latin America, and Middle East & Africa.
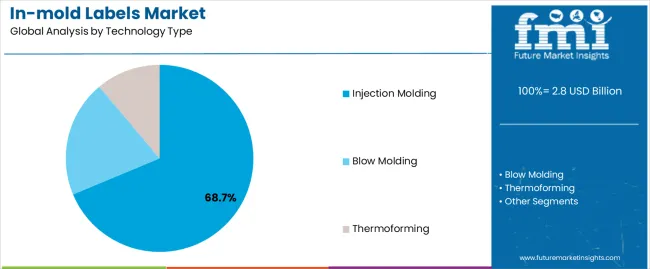
By Technology Type, the Injection Molding Segment Accounts for 68.7% Market Share

In Mold Labels Market Analysis By Technology Type

The injection molding segment is projected to account for 68.7% of the in-mold labels market in 2025, reaffirming its position as the dominant technology category. Brand owners and packaging manufacturers increasingly utilize injection molding in-mold labels for their optimal combination of production efficiency, dimensional accuracy, and cost-effectiveness characteristics, making them ideal for high-volume consumer goods applications. The injection molding technology's established industry acceptance and proven performance directly address the operational requirements for reliable label integration in diverse product categories and manufacturing environments.

This technology segment forms the foundation of modern packaging operations, as it represents the process with the greatest market penetration and established demand across food and beverage, personal care, and household products applications. Manufacturer investments in advanced injection molding equipment and process optimization continue to strengthen adoption among brand owners and packaging companies. With organizations prioritizing production efficiency and cost effectiveness, injection molding in-mold labels align with both performance requirements and budget constraints, making them the central component of comprehensive packaging strategies.
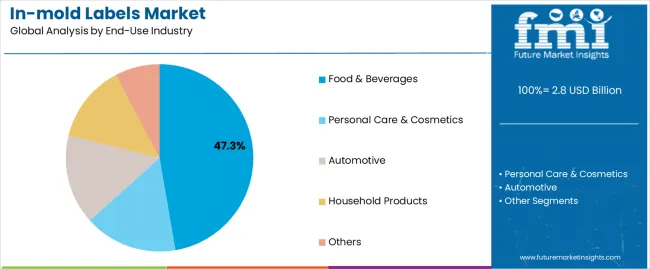
By End-Use Industry, the Food & Beverages Segment Accounts for 47.3% Market Share

In Mold Labels Market Analysis By End Use Industry

Food & Beverages applications are projected to represent 47.3% of in-mold labels utilization in 2025, underscoring their critical role as the primary market for delivering labels to dairy products, ready meals, beverage containers, and food packaging applications through integrated production processes. Food manufacturers prefer in-mold labels for their ability to provide food-safe decoration, moisture resistance, and visual appeal while ensuring regulatory compliance with packaging standards. Positioned as essential components for premium food packaging, in-mold labels offer both aesthetic advantages and functional performance benefits.

The segment is supported by continuous innovation in food-safe materials and the growing availability of customized label designs that enable brand differentiation with enhanced visual impact and regulatory compliance features. Food manufacturers are establishing long-term supply partnerships to support consistent in-mold label procurement and packaging standardization. As premium food packaging becomes more prevalent and brand differentiation increases, Food & Beverages applications will continue to dominate the market landscape while supporting comprehensive packaging solutions and consumer appeal strategies.

What are the Drivers, Restraints, and Key Trends of the In-mold Labels Market?

The in-mold labels market is advancing rapidly due to increasing consumer preference for premium packaging and growing adoption of efficient labeling solutions that provide superior visual appeal, integrated production processes, and cost-effectiveness while enabling streamlined manufacturing across food and beverage, personal care, and consumer goods applications. The market faces challenges, including high initial equipment costs, technical complexity in production setup, and the need for specialized expertise across different application requirements. Innovation in digital printing technologies and advanced material formulations continues to influence product development and market expansion patterns.

Advancement of Digital Printing Technologies

The growing adoption of digital printing systems, variable data capabilities, and short-run production technologies is enabling manufacturers to produce in-mold labels with superior customization options, enhanced visual quality, and flexible production functionalities. Advanced printing systems provide improved color accuracy while allowing more efficient job changeovers and real-time quality monitoring across various packaging operations and brand applications. Packaging manufacturers are increasingly recognizing the operational advantages of digital printing capabilities for customization optimization and production flexibility.

Integration of Advanced Material Formulations & Performance Enhancement

Modern in-mold label producers are incorporating high-performance films, specialized adhesive systems, and enhanced barrier properties to improve functional performance, enable extended shelf life, and deliver value-added solutions to quality-conscious brand owners and packaging manufacturers. These material innovations improve product protection while enabling new market opportunities, including premium packaging applications, technical component labeling, and specialized performance requirements. Advanced material integration also allows manufacturers to support brand differentiation goals and regulatory compliance beyond traditional labeling functionality.

Analysis of the In-mold Labels Market by Key Countries

Country CAGR (2025-2035)
China 7.4%
India 8.1%
USA 4.7%
Germany 4.2%
Brazil 6.3%
Japan 3.9%
France 4.5%

The in-mold labels market is experiencing varied growth globally, with India leading at an 8.1% CAGR through 2035, driven by the expanding consumer goods industry, growing food processing sector development, and significant investment in packaging infrastructure modernization. China follows at 7.4%, supported by rapid manufacturing expansion, increasing premium packaging adoption, and growing brand differentiation initiatives. The USA shows growth at 4.7%, emphasizing automation adoption and premium packaging trends. Germany demonstrates 4.2% growth, prioritizing packaging innovation and advanced manufacturing technologies. Brazil records 6.3%, focusing on consumer goods expansion and growing organized retail. Japan exhibits 3.9% growth, emphasizing quality standards and technical applications. France shows 4.5% growth, supported by luxury goods packaging and food industry development.

The report covers an in-depth analysis of 40+ countries, with top-performing countries are highlighted below.
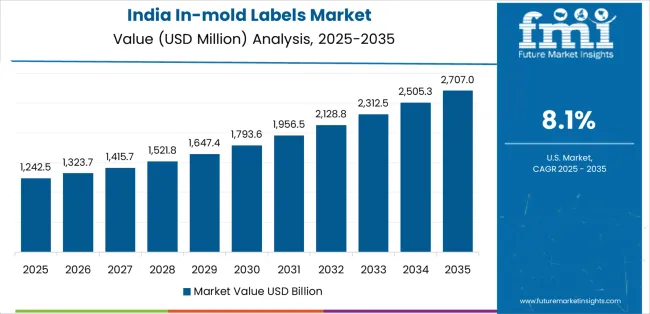
India Leads Global Market Growth with Consumer Goods Expansion Dominance

In Mold Labels Market Country Value Analysis

Revenue from in-mold labels in India is projected to exhibit exceptional growth with a CAGR of 8.1% through 2035, driven by expanding consumer goods industry and rapidly growing food processing sector supported by rising disposable incomes promoting premium packaging adoption. The country's strong position in manufacturing development and increasing investment in modern packaging technologies are creating substantial demand for in-mold labeling solutions. Major consumer goods companies and packaging manufacturers are establishing comprehensive labeling programs to serve both domestic market requirements and developing export opportunities.

  • Government support for manufacturing initiatives and food processing development is driving demand for in-mold labels throughout major production centers and emerging industrial regions.
  • Strong consumer goods growth and an expanding network of organized retail channels are supporting the rapid adoption of in-mold labels among manufacturers seeking enhanced brand presentation and packaging differentiation capabilities.

China Demonstrates Strong Market Potential with Manufacturing Leadership

Demand for in-mold labels in China is expanding at a CAGR of 7.4%, supported by the country's massive manufacturing base, expanding premium packaging requirements, and increasing adoption of advanced labeling technologies. The country's industrial capabilities and growing consumer market are driving requirements for comprehensive labeling solutions. International suppliers and domestic manufacturers are establishing extensive production and distribution capabilities to address the growing demand for in-mold labeling products.

  • Rising consumer spending and expanding premium product categories are creating opportunities for in-mold label adoption across consumer goods manufacturers, food processors, and personal care companies in major manufacturing regions.
  • Growing focus on brand differentiation and packaging quality is driving adoption of high-performance in-mold labeling systems among large-scale manufacturers seeking enhanced visual appeal and production efficiency.

USA Demonstrates Technology Leadership with Automation Integration

Revenue from in-mold labels in the USA is growing at a CAGR of 4.7%, supported by the country's established packaging industry, strong emphasis on production efficiency, and robust demand for premium packaging solutions in consumer goods and food processing applications. The nation's advanced manufacturing infrastructure and innovation-focused operations are driving sophisticated in-mold labeling systems throughout the production network. Leading manufacturers and technology providers are investing extensively in automation capabilities and advanced printing technologies to serve both domestic and international markets.

  • Rising demand for premium packaging aesthetics and mature manufacturing automation is creating requirements for high-performance in-mold labels with advanced visual capabilities among consumer goods companies seeking enhanced brand presentation and production efficiency.
  • Strong focus on operational optimization measures and growing investment in digital printing technologies are supporting adoption of customizable in-mold labels with variable graphics across food processing and personal care manufacturing operations in major markets.

Germany Focuses on Innovation Excellence and Quality Standards

Demand for in-mold labels in Germany is anticipated to expand at a CAGR of 4.2%, driven by the country's advanced manufacturing standards, innovative packaging technologies, and commitment to quality excellence. Germany's technical expertise and precision focus are supporting demand for in-mold labels in automotive applications, technical components, and premium consumer goods. Manufacturers are establishing comprehensive quality systems to serve the demanding domestic market and European export opportunities.

  • Advanced manufacturing precision and stringent quality requirements are driving adoption of high-specification in-mold labeling systems with precise dimensional control among automotive suppliers and technical component manufacturers implementing quality-critical applications.
  • Growing emphasis on innovation leadership and advanced material development is supporting market expansion for labels manufactured with specialized formulations and enhanced performance characteristics throughout the country's manufacturing sector.

Brazil Emphasizes Consumer Goods Development and Market Expansion

Revenue from in-mold labels in Brazil is expected to grow at a CAGR of 6.3%, supported by the country's growing consumer goods industry, expanding food processing sector, and increasing investment in modern packaging infrastructure. Brazil's large domestic market and commitment to industrial modernization are supporting demand for in-mold labeling solutions across multiple consumer segments. Manufacturers are establishing comprehensive production capabilities to serve the growing domestic market and regional opportunities.
  • Strong consumer market growth and expanding organized retail presence are driving adoption of premium packaging solutions with enhanced visual appeal among consumer goods manufacturers and food processors seeking brand differentiation.
  • Growing industrial modernization and increasing packaging investment are supporting market expansion for in-mold labeling systems with efficient production capabilities throughout the country's developing manufacturing sector.

Japan Exhibits Quality Leadership and Technical Applications

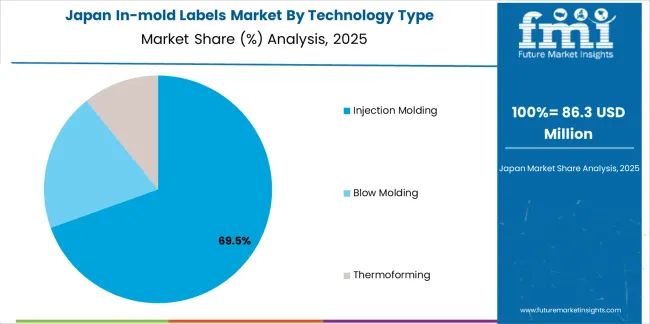
In Mold Labels Market Japan Market Share Analysis By Technology Type

Demand for in-mold labels in Japan is forecasted to expand at a CAGR of 3.9%, driven by the country's established manufacturing excellence, emphasis on quality standards, and strong position in technical applications. Japan's precision manufacturing capabilities and commitment to innovation are supporting investment in advanced labeling technologies throughout major industrial segments. Industry leaders are establishing comprehensive technical capabilities to serve automotive, electronics, and premium consumer goods applications.

  • Innovations in precision manufacturing and technical application requirements are creating demand for high-performance in-mold labels with specialized material properties among automotive suppliers and electronics manufacturers implementing quality-critical labeling programs.
  • Growing focus on premium positioning and advanced material development are driving adoption of innovative in-mold labeling systems with enhanced functional capabilities across consumer electronics and precision manufacturing operations throughout the country.

France Shows Luxury Goods Leadership and Food Industry Development

Revenue from in-mold labels in France is growing at a CAGR of 4.5%, supported by the country's luxury goods industry, growing food processing sector, and strategic position in European markets. France's established premium brands and integrated manufacturing infrastructure are driving demand for high-quality in-mold labels in cosmetics, food packaging, and luxury applications. Leading manufacturers are investing in specialized capabilities to serve premium market requirements and quality standards.
  • Luxury goods excellence and premium packaging requirements are creating demand for sophisticated in-mold labels with advanced decoration capabilities among cosmetics manufacturers and luxury brands seeking distinctive packaging solutions.
  • Strong position in food processing is supporting adoption of food-safe in-mold labeling systems with enhanced barrier properties throughout the country's established food manufacturing infrastructure.

Europe Market Split by Countries

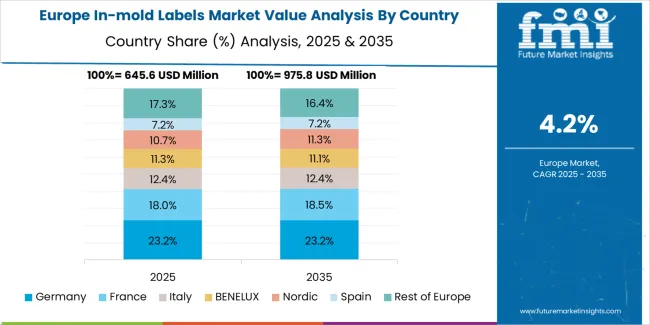
In Mold Labels Market Europe Country Market Share Analysis, 2025 & 2035

The in-mold labels market in Europe is projected to grow from USD 0.9 billion in 2025 to USD 1.4 billion by 2035, registering a CAGR of 4.6% over the forecast period. Germany is expected to maintain its leadership position with a 28.7% market share in 2025, adjusting to 29.2% by 2035, supported by its strong packaging industry infrastructure, advanced manufacturing capabilities, and comprehensive automotive applications serving diverse in-mold labeling requirements across Europe.

France follows with a 19.5% share in 2025, projected to reach 20.1% by 2035, driven by robust demand for in-mold labels in luxury goods packaging, food processing applications, and cosmetics industries, combined with established manufacturing infrastructure and quality-focused production capabilities. The United Kingdom holds a 16.2% share in 2025, expected to reach 16.8% by 2035, supported by strong consumer goods manufacturing and growing premium packaging adoption. Italy commands a 14.3% share in 2025, projected to reach 14.7% by 2035, while Spain accounts for 9.1% in 2025, expected to reach 9.4% by 2035. Netherlands maintains a 4.8% share in 2025, growing to 5.0% by 2035. The Rest of Europe region, including Nordic countries, Eastern Europe, Belgium, Austria, and other nations, is anticipated to maintain momentum, with its collective share adjusting from 7.4% to 4.8% by 2035, attributed to increasing packaging industry development in Eastern Europe and growing premium goods manufacturing in Nordic countries implementing advanced labeling systems.
Competitive Landscape of the In-mold Labels Market

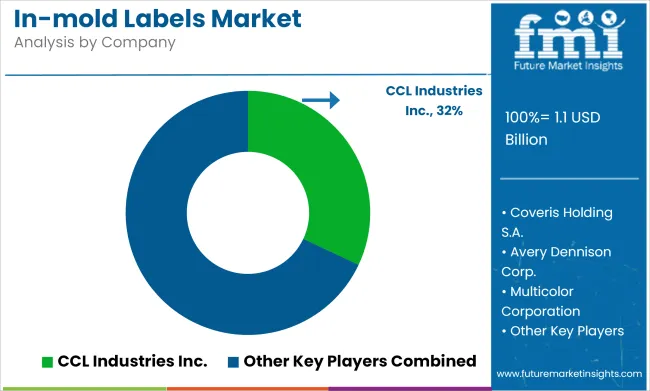
In Mold Labels Market Analysis By Company

The in-mold labels market is characterized by competition among established label manufacturers, specialized printing companies, and integrated packaging solutions providers. Companies are investing in printing technology research, material development optimization, automation integration, and comprehensive product portfolios to deliver consistent, high-quality, and application-specific in-mold labeling solutions. Innovation in digital printing capabilities, advanced material formulations, and production automation is central to strengthening market position and competitive advantage.

Multi-Color Corporation leads the market with strong global presence, offering comprehensive in-mold labeling solutions with a focus on food and beverage applications. CCL Industries provides specialized manufacturing capabilities with an emphasis on premium decoration and advanced printing technologies. Constantia Flexibles delivers innovative labeling products with a focus on barrier performance and global distribution networks. Huhtamaki Group specializes in comprehensive food packaging solutions and integrated labeling programs. Coveris Holdings focuses on high-quality manufacturing and diverse application capabilities. Fort Dearborn Company offers specialized labels for consumer goods with emphasis on digital printing compatibility.

Key Players in the In-mold Labels Market

  • Multi-Color Corporation
  • CCL Industries
  • Constantia Flexibles
  • Huhtamaki Group
  • Coveris Holdings
  • Fort Dearborn Company
  • Quantum Label Products
  • Cenveo Corporation
  • UPM Raflatac
  • Avery Dennison Corporation
  • Inland Packaging Corporation
  • ProMach Inc.
  • Treofan Group
  • Jindal Poly Films Limited
  • Klöckner Pentaplast Group

Scope of the Report

Items Values
Quantitative Units (2025) USD 2.8 billion
Technology Type Injection Molding, Blow Molding, Thermoforming
Material Type Polypropylene (PP), Polyethylene (PE), PET, Others (PVC, PS)
End-Use Industry Food & Beverages, Personal Care & Cosmetics, Automotive, Household Products, Others
Printing Technique Flexographic, Digital, Gravure, Screen Printing
Regions Covered North America, Europe, Asia Pacific, Latin America, Middle East & Africa
Countries Covered United States, Canada, United Kingdom, Germany, France, China, Japan, India, Brazil, Australia and 40+ countries
Key Companies Profiled Multi-Color Corporation, CCL Industries, Constantia Flexibles, Huhtamaki Group, Coveris Holdings, and Fort Dearborn Company
Additional Attributes Dollar sales by technology type and material category, regional demand trends, competitive landscape, technological advancements in digital printing systems, advanced material development, automation compatibility, and brand partnership integration

In-mold Labels Market by Segments

Technology Type:

  • Injection Molding
  • Blow Molding
  • Thermoforming

Material Type:

  • Polypropylene (PP)
  • Polyethylene (PE)
  • PET
  • Others (PVC, PS)

End-Use Industry:

  • Food & Beverages
  • Personal Care & Cosmetics
  • Automotive
  • Household Products
  • Others

Printing Technique:

  • Flexographic
  • Digital
  • Gravure
  • Screen Printing

Region:

North America

  • United States
  • Canada
  • Mexico

Europe

  • Germany
  • United Kingdom
  • France
  • Italy
  • Spain
  • Netherlands
  • Belgium
  • Poland
  • Rest of Europe

Asia Pacific

  • China
  • Japan
  • India
  • South Korea
  • Australia & New Zealand
  • ASEAN
  • Rest of Asia Pacific

Latin America

  • Brazil
  • Argentina
  • Chile
  • Rest of Latin America

Middle East & Africa

  • Kingdom of Saudi Arabia
  • Other GCC Countries
  • Turkey
  • South Africa
  • Rest of Middle East & Africa

Frequently Asked Questions

How big is the in-mold labels market in 2025?

The global in-mold labels market is estimated to be valued at USD 2.8 billion in 2025.

What will be the size of in-mold labels market in 2035?

The market size for the in-mold labels market is projected to reach USD 4.7 billion by 2035.

How much will be the in-mold labels market growth between 2025 and 2035?

The in-mold labels market is expected to grow at a 5.3% CAGR between 2025 and 2035.

What are the key product types in the in-mold labels market?

The key product types in in-mold labels market are injection molding , blow molding and thermoforming.

Which end-use industry segment to contribute significant share in the in-mold labels market in 2025?

In terms of end-use industry, food & beverages segment to command 47.3% share in the in-mold labels market in 2025.

Table of Content

  1. Executive Summary
    • Global Market Outlook
    • Demand to side Trends
    • Supply to side Trends
    • Technology Roadmap Analysis
    • Analysis and Recommendations
  2. Market Overview
    • Market Coverage / Taxonomy
    • Market Definition / Scope / Limitations
  3. Market Background
    • Market Dynamics
      • Drivers
      • Restraints
      • Opportunity
      • Trends
    • Scenario Forecast
      • Demand in Optimistic Scenario
      • Demand in Likely Scenario
      • Demand in Conservative Scenario
    • Opportunity Map Analysis
    • Product Life Cycle Analysis
    • Supply Chain Analysis
    • Investment Feasibility Matrix
    • Value Chain Analysis
    • PESTLE and Porter’s Analysis
    • Regulatory Landscape
    • Regional Parent Market Outlook
    • Production and Consumption Statistics
    • Import and Export Statistics
  4. Global Market Analysis 2020 to 2024 and Forecast, 2025 to 2035
    • Historical Market Size Value (USD Million) Analysis, 2020 to 2024
    • Current and Future Market Size Value (USD Million) Projections, 2025 to 2035
      • Y to o to Y Growth Trend Analysis
      • Absolute $ Opportunity Analysis
  5. Global Market Pricing Analysis 2020 to 2024 and Forecast 2025 to 2035
  6. Global Market Analysis 2020 to 2024 and Forecast 2025 to 2035, By Technology Type
    • Introduction / Key Findings
    • Historical Market Size Value (USD Million) Analysis By Technology Type , 2020 to 2024
    • Current and Future Market Size Value (USD Million) Analysis and Forecast By Technology Type , 2025 to 2035
      • Injection Molding
      • Blow Molding
      • Thermoforming
    • Y to o to Y Growth Trend Analysis By Technology Type , 2020 to 2024
    • Absolute $ Opportunity Analysis By Technology Type , 2025 to 2035
  7. Global Market Analysis 2020 to 2024 and Forecast 2025 to 2035, By End-Use Industry
    • Introduction / Key Findings
    • Historical Market Size Value (USD Million) Analysis By End-Use Industry, 2020 to 2024
    • Current and Future Market Size Value (USD Million) Analysis and Forecast By End-Use Industry, 2025 to 2035
      • Food & Beverages
      • Personal Care & Cosmetics
      • Automotive
      • Household Products
      • Others
    • Y to o to Y Growth Trend Analysis By End-Use Industry, 2020 to 2024
    • Absolute $ Opportunity Analysis By End-Use Industry, 2025 to 2035
  8. Global Market Analysis 2020 to 2024 and Forecast 2025 to 2035, By Region
    • Introduction
    • Historical Market Size Value (USD Million) Analysis By Region, 2020 to 2024
    • Current Market Size Value (USD Million) Analysis and Forecast By Region, 2025 to 2035
      • North America
      • Latin America
      • Western Europe
      • Eastern Europe
      • East Asia
      • South Asia and Pacific
      • Middle East & Africa
    • Market Attractiveness Analysis By Region
  9. North America Market Analysis 2020 to 2024 and Forecast 2025 to 2035, By Country
    • Historical Market Size Value (USD Million) Trend Analysis By Market Taxonomy, 2020 to 2024
    • Market Size Value (USD Million) Forecast By Market Taxonomy, 2025 to 2035
      • By Country
        • USA
        • Canada
        • Mexico
      • By Technology Type
      • By End-Use Industry
    • Market Attractiveness Analysis
      • By Country
      • By Technology Type
      • By End-Use Industry
    • Key Takeaways
  10. Latin America Market Analysis 2020 to 2024 and Forecast 2025 to 2035, By Country
    • Historical Market Size Value (USD Million) Trend Analysis By Market Taxonomy, 2020 to 2024
    • Market Size Value (USD Million) Forecast By Market Taxonomy, 2025 to 2035
      • By Country
        • Brazil
        • Chile
        • Rest of Latin America
      • By Technology Type
      • By End-Use Industry
    • Market Attractiveness Analysis
      • By Country
      • By Technology Type
      • By End-Use Industry
    • Key Takeaways
  11. Western Europe Market Analysis 2020 to 2024 and Forecast 2025 to 2035, By Country
    • Historical Market Size Value (USD Million) Trend Analysis By Market Taxonomy, 2020 to 2024
    • Market Size Value (USD Million) Forecast By Market Taxonomy, 2025 to 2035
      • By Country
        • Germany
        • UK
        • Italy
        • Spain
        • France
        • Nordic
        • BENELUX
        • Rest of Western Europe
      • By Technology Type
      • By End-Use Industry
    • Market Attractiveness Analysis
      • By Country
      • By Technology Type
      • By End-Use Industry
    • Key Takeaways
  12. Eastern Europe Market Analysis 2020 to 2024 and Forecast 2025 to 2035, By Country
    • Historical Market Size Value (USD Million) Trend Analysis By Market Taxonomy, 2020 to 2024
    • Market Size Value (USD Million) Forecast By Market Taxonomy, 2025 to 2035
      • By Country
        • Russia
        • Poland
        • Hungary
        • Balkan & Baltic
        • Rest of Eastern Europe
      • By Technology Type
      • By End-Use Industry
    • Market Attractiveness Analysis
      • By Country
      • By Technology Type
      • By End-Use Industry
    • Key Takeaways
  13. East Asia Market Analysis 2020 to 2024 and Forecast 2025 to 2035, By Country
    • Historical Market Size Value (USD Million) Trend Analysis By Market Taxonomy, 2020 to 2024
    • Market Size Value (USD Million) Forecast By Market Taxonomy, 2025 to 2035
      • By Country
        • China
        • Japan
        • South Korea
      • By Technology Type
      • By End-Use Industry
    • Market Attractiveness Analysis
      • By Country
      • By Technology Type
      • By End-Use Industry
    • Key Takeaways
  14. South Asia and Pacific Market Analysis 2020 to 2024 and Forecast 2025 to 2035, By Country
    • Historical Market Size Value (USD Million) Trend Analysis By Market Taxonomy, 2020 to 2024
    • Market Size Value (USD Million) Forecast By Market Taxonomy, 2025 to 2035
      • By Country
        • India
        • ASEAN
        • Australia & New Zealand
        • Rest of South Asia and Pacific
      • By Technology Type
      • By End-Use Industry
    • Market Attractiveness Analysis
      • By Country
      • By Technology Type
      • By End-Use Industry
    • Key Takeaways
  15. Middle East & Africa Market Analysis 2020 to 2024 and Forecast 2025 to 2035, By Country
    • Historical Market Size Value (USD Million) Trend Analysis By Market Taxonomy, 2020 to 2024
    • Market Size Value (USD Million) Forecast By Market Taxonomy, 2025 to 2035
      • By Country
        • Kingdom of Saudi Arabia
        • Other GCC Countries
        • Turkiye
        • South Africa
        • Other African Union
        • Rest of Middle East & Africa
      • By Technology Type
      • By End-Use Industry
    • Market Attractiveness Analysis
      • By Country
      • By Technology Type
      • By End-Use Industry
    • Key Takeaways
  16. Key Countries Market Analysis
    • USA
      • Pricing Analysis
      • Market Share Analysis, 2024
        • By Technology Type
        • By End-Use Industry
    • Canada
      • Pricing Analysis
      • Market Share Analysis, 2024
        • By Technology Type
        • By End-Use Industry
    • Mexico
      • Pricing Analysis
      • Market Share Analysis, 2024
        • By Technology Type
        • By End-Use Industry
    • Brazil
      • Pricing Analysis
      • Market Share Analysis, 2024
        • By Technology Type
        • By End-Use Industry
    • Chile
      • Pricing Analysis
      • Market Share Analysis, 2024
        • By Technology Type
        • By End-Use Industry
    • Germany
      • Pricing Analysis
      • Market Share Analysis, 2024
        • By Technology Type
        • By End-Use Industry
    • UK
      • Pricing Analysis
      • Market Share Analysis, 2024
        • By Technology Type
        • By End-Use Industry
    • Italy
      • Pricing Analysis
      • Market Share Analysis, 2024
        • By Technology Type
        • By End-Use Industry
    • Spain
      • Pricing Analysis
      • Market Share Analysis, 2024
        • By Technology Type
        • By End-Use Industry
    • France
      • Pricing Analysis
      • Market Share Analysis, 2024
        • By Technology Type
        • By End-Use Industry
    • India
      • Pricing Analysis
      • Market Share Analysis, 2024
        • By Technology Type
        • By End-Use Industry
    • ASEAN
      • Pricing Analysis
      • Market Share Analysis, 2024
        • By Technology Type
        • By End-Use Industry
    • Australia & New Zealand
      • Pricing Analysis
      • Market Share Analysis, 2024
        • By Technology Type
        • By End-Use Industry
    • China
      • Pricing Analysis
      • Market Share Analysis, 2024
        • By Technology Type
        • By End-Use Industry
    • Japan
      • Pricing Analysis
      • Market Share Analysis, 2024
        • By Technology Type
        • By End-Use Industry
    • South Korea
      • Pricing Analysis
      • Market Share Analysis, 2024
        • By Technology Type
        • By End-Use Industry
    • Russia
      • Pricing Analysis
      • Market Share Analysis, 2024
        • By Technology Type
        • By End-Use Industry
    • Poland
      • Pricing Analysis
      • Market Share Analysis, 2024
        • By Technology Type
        • By End-Use Industry
    • Hungary
      • Pricing Analysis
      • Market Share Analysis, 2024
        • By Technology Type
        • By End-Use Industry
    • Kingdom of Saudi Arabia
      • Pricing Analysis
      • Market Share Analysis, 2024
        • By Technology Type
        • By End-Use Industry
    • Turkiye
      • Pricing Analysis
      • Market Share Analysis, 2024
        • By Technology Type
        • By End-Use Industry
    • South Africa
      • Pricing Analysis
      • Market Share Analysis, 2024
        • By Technology Type
        • By End-Use Industry
  17. Market Structure Analysis
    • Competition Dashboard
    • Competition Benchmarking
    • Market Share Analysis of Top Players
      • By Regional
      • By Technology Type
      • By End-Use Industry
  18. Competition Analysis
    • Competition Deep Dive
      • Multi-Color Corporation
        • Overview
        • Product Portfolio
        • Profitability by Market Segments (Product/Age /Sales Channel/Region)
        • Sales Footprint
        • Strategy Overview
          • Marketing Strategy
          • Product Strategy
          • Channel Strategy
      • CCL Industries
      • Constantia Flexibles
      • Huhtamaki Group
      • Coveris Holdings
      • Fort Dearborn Company
      • Quantum Label Products
      • Cenveo Corporation
      • UPM Raflatac
      • Avery Dennison Corporation
      • Inland Packaging Corporation
      • ProMach Inc.
      • Treofan Group
      • Jindal Poly Films Limited
      • Klöckner Pentaplast Group
  19. Assumptions & Acronyms Used
  20. Research Methodology

List of Tables

  • Table 1: Global Market Value (USD Million) Forecast by Region, 2020 to 2035
  • Table 2: Global Market Value (USD Million) Forecast by Technology Type , 2020 to 2035
  • Table 3: Global Market Value (USD Million) Forecast by End-Use Industry, 2020 to 2035
  • Table 4: North America Market Value (USD Million) Forecast by Country, 2020 to 2035
  • Table 5: North America Market Value (USD Million) Forecast by Technology Type , 2020 to 2035
  • Table 6: North America Market Value (USD Million) Forecast by End-Use Industry, 2020 to 2035
  • Table 7: Latin America Market Value (USD Million) Forecast by Country, 2020 to 2035
  • Table 8: Latin America Market Value (USD Million) Forecast by Technology Type , 2020 to 2035
  • Table 9: Latin America Market Value (USD Million) Forecast by End-Use Industry, 2020 to 2035
  • Table 10: Western Europe Market Value (USD Million) Forecast by Country, 2020 to 2035
  • Table 11: Western Europe Market Value (USD Million) Forecast by Technology Type , 2020 to 2035
  • Table 12: Western Europe Market Value (USD Million) Forecast by End-Use Industry, 2020 to 2035
  • Table 13: Eastern Europe Market Value (USD Million) Forecast by Country, 2020 to 2035
  • Table 14: Eastern Europe Market Value (USD Million) Forecast by Technology Type , 2020 to 2035
  • Table 15: Eastern Europe Market Value (USD Million) Forecast by End-Use Industry, 2020 to 2035
  • Table 16: East Asia Market Value (USD Million) Forecast by Country, 2020 to 2035
  • Table 17: East Asia Market Value (USD Million) Forecast by Technology Type , 2020 to 2035
  • Table 18: East Asia Market Value (USD Million) Forecast by End-Use Industry, 2020 to 2035
  • Table 19: South Asia and Pacific Market Value (USD Million) Forecast by Country, 2020 to 2035
  • Table 20: South Asia and Pacific Market Value (USD Million) Forecast by Technology Type , 2020 to 2035
  • Table 21: South Asia and Pacific Market Value (USD Million) Forecast by End-Use Industry, 2020 to 2035
  • Table 22: Middle East & Africa Market Value (USD Million) Forecast by Country, 2020 to 2035
  • Table 23: Middle East & Africa Market Value (USD Million) Forecast by Technology Type , 2020 to 2035
  • Table 24: Middle East & Africa Market Value (USD Million) Forecast by End-Use Industry, 2020 to 2035

List of Figures

  • Figure 1: Global Market Pricing Analysis
  • Figure 2: Global Market Value (USD Million) Forecast 2020-2035
  • Figure 3: Global Market Value Share and BPS Analysis by Technology Type , 2025 and 2035
  • Figure 4: Global Market Y to o to Y Growth Comparison by Technology Type , 2025-2035
  • Figure 5: Global Market Attractiveness Analysis by Technology Type
  • Figure 6: Global Market Value Share and BPS Analysis by End-Use Industry, 2025 and 2035
  • Figure 7: Global Market Y to o to Y Growth Comparison by End-Use Industry, 2025-2035
  • Figure 8: Global Market Attractiveness Analysis by End-Use Industry
  • Figure 9: Global Market Value (USD Million) Share and BPS Analysis by Region, 2025 and 2035
  • Figure 10: Global Market Y to o to Y Growth Comparison by Region, 2025-2035
  • Figure 11: Global Market Attractiveness Analysis by Region
  • Figure 12: North America Market Incremental Dollar Opportunity, 2025-2035
  • Figure 13: Latin America Market Incremental Dollar Opportunity, 2025-2035
  • Figure 14: Western Europe Market Incremental Dollar Opportunity, 2025-2035
  • Figure 15: Eastern Europe Market Incremental Dollar Opportunity, 2025-2035
  • Figure 16: East Asia Market Incremental Dollar Opportunity, 2025-2035
  • Figure 17: South Asia and Pacific Market Incremental Dollar Opportunity, 2025-2035
  • Figure 18: Middle East & Africa Market Incremental Dollar Opportunity, 2025-2035
  • Figure 19: North America Market Value Share and BPS Analysis by Country, 2025 and 2035
  • Figure 20: North America Market Value Share and BPS Analysis by Technology Type , 2025 and 2035
  • Figure 21: North America Market Y to o to Y Growth Comparison by Technology Type , 2025-2035
  • Figure 22: North America Market Attractiveness Analysis by Technology Type
  • Figure 23: North America Market Value Share and BPS Analysis by End-Use Industry, 2025 and 2035
  • Figure 24: North America Market Y to o to Y Growth Comparison by End-Use Industry, 2025-2035
  • Figure 25: North America Market Attractiveness Analysis by End-Use Industry
  • Figure 26: Latin America Market Value Share and BPS Analysis by Country, 2025 and 2035
  • Figure 27: Latin America Market Value Share and BPS Analysis by Technology Type , 2025 and 2035
  • Figure 28: Latin America Market Y to o to Y Growth Comparison by Technology Type , 2025-2035
  • Figure 29: Latin America Market Attractiveness Analysis by Technology Type
  • Figure 30: Latin America Market Value Share and BPS Analysis by End-Use Industry, 2025 and 2035
  • Figure 31: Latin America Market Y to o to Y Growth Comparison by End-Use Industry, 2025-2035
  • Figure 32: Latin America Market Attractiveness Analysis by End-Use Industry
  • Figure 33: Western Europe Market Value Share and BPS Analysis by Country, 2025 and 2035
  • Figure 34: Western Europe Market Value Share and BPS Analysis by Technology Type , 2025 and 2035
  • Figure 35: Western Europe Market Y to o to Y Growth Comparison by Technology Type , 2025-2035
  • Figure 36: Western Europe Market Attractiveness Analysis by Technology Type
  • Figure 37: Western Europe Market Value Share and BPS Analysis by End-Use Industry, 2025 and 2035
  • Figure 38: Western Europe Market Y to o to Y Growth Comparison by End-Use Industry, 2025-2035
  • Figure 39: Western Europe Market Attractiveness Analysis by End-Use Industry
  • Figure 40: Eastern Europe Market Value Share and BPS Analysis by Country, 2025 and 2035
  • Figure 41: Eastern Europe Market Value Share and BPS Analysis by Technology Type , 2025 and 2035
  • Figure 42: Eastern Europe Market Y to o to Y Growth Comparison by Technology Type , 2025-2035
  • Figure 43: Eastern Europe Market Attractiveness Analysis by Technology Type
  • Figure 44: Eastern Europe Market Value Share and BPS Analysis by End-Use Industry, 2025 and 2035
  • Figure 45: Eastern Europe Market Y to o to Y Growth Comparison by End-Use Industry, 2025-2035
  • Figure 46: Eastern Europe Market Attractiveness Analysis by End-Use Industry
  • Figure 47: East Asia Market Value Share and BPS Analysis by Country, 2025 and 2035
  • Figure 48: East Asia Market Value Share and BPS Analysis by Technology Type , 2025 and 2035
  • Figure 49: East Asia Market Y to o to Y Growth Comparison by Technology Type , 2025-2035
  • Figure 50: East Asia Market Attractiveness Analysis by Technology Type
  • Figure 51: East Asia Market Value Share and BPS Analysis by End-Use Industry, 2025 and 2035
  • Figure 52: East Asia Market Y to o to Y Growth Comparison by End-Use Industry, 2025-2035
  • Figure 53: East Asia Market Attractiveness Analysis by End-Use Industry
  • Figure 54: South Asia and Pacific Market Value Share and BPS Analysis by Country, 2025 and 2035
  • Figure 55: South Asia and Pacific Market Value Share and BPS Analysis by Technology Type , 2025 and 2035
  • Figure 56: South Asia and Pacific Market Y to o to Y Growth Comparison by Technology Type , 2025-2035
  • Figure 57: South Asia and Pacific Market Attractiveness Analysis by Technology Type
  • Figure 58: South Asia and Pacific Market Value Share and BPS Analysis by End-Use Industry, 2025 and 2035
  • Figure 59: South Asia and Pacific Market Y to o to Y Growth Comparison by End-Use Industry, 2025-2035
  • Figure 60: South Asia and Pacific Market Attractiveness Analysis by End-Use Industry
  • Figure 61: Middle East & Africa Market Value Share and BPS Analysis by Country, 2025 and 2035
  • Figure 62: Middle East & Africa Market Value Share and BPS Analysis by Technology Type , 2025 and 2035
  • Figure 63: Middle East & Africa Market Y to o to Y Growth Comparison by Technology Type , 2025-2035
  • Figure 64: Middle East & Africa Market Attractiveness Analysis by Technology Type
  • Figure 65: Middle East & Africa Market Value Share and BPS Analysis by End-Use Industry, 2025 and 2035
  • Figure 66: Middle East & Africa Market Y to o to Y Growth Comparison by End-Use Industry, 2025-2035
  • Figure 67: Middle East & Africa Market Attractiveness Analysis by End-Use Industry
  • Figure 68: Global Market - Tier Structure Analysis
  • Figure 69: Global Market - Company Share Analysis
Dashboard
Dashboard
Dashboard
Dashboard
Dashboard
Dashboard

Full Research Suite comprises of:

Market outlook & trends analysis

Market outlook & trends analysis

Interviews & case studies

Interviews & case studies

Strategic recommendations

Strategic recommendations

Vendor profiles & capabilities analysis

Vendor profiles & capabilities analysis

5-year forecasts

5-year forecasts

8 regions and 60+ country-level data splits

8 regions and 60+ country-level data splits

Market segment data splits

Market segment data splits

12 months of continuous data updates

12 months of continuous data updates

DELIVERED AS:

PDF EXCEL ONLINE

Full Research Suite


$5000

$7500

$10000

Buy Report Now
Similar Industry Reports

Similar Industry Reports

In-Mold Labels Market Share Analysis

Competitive Landscape of In-Mold Labels Providers

USA In-mold Labels Market

USA In-mold Labels Market Insights – Demand, Innovations & Growth 2025-2035

ASEAN In-mold Labels Market

ASEAN In-mold Labels Market Report – Size, Growth & Outlook 2025-2035

Japan In-mold Labels Market

Japan In-mold Labels Market Trends – Growth, Size & Forecast 2025-2035

Germany In-mold Labels Market

Germany In-mold Labels Market Report – Size, Demand & Growth 2025-2035

Latin America In-mold Labels Market

Latin America In-mold Labels Market Size and Share Forecast Outlook 2025 to 2035

Labels Market
Labels Market

Labels Market Analysis - Size, Share, and Forecast Outlook 2025 to 2035

Labels, Tapes And Films Market

Labels, Tapes And Films Market Size and Share Forecast Outlook 2025 to 2035

Labels Market Share Analysis

Competitive Overview of Labels Companies

USA Labels Market
USA Labels Market

USA Labels Market Size and Share Forecast Outlook 2025 to 2035

USA Labels Market Share Analysis

Market Share Distribution Among USA Labels Providers

Foam Labels Market
Foam Labels Market

Foam Labels Market Trends and Growth 2035

Foil Labels Market Share Analysis

Market Share Breakdown of Foil Labels Manufacturers

Foil Labels Market
Foil Labels Market

Foil Labels Market Analysis by Metal Foils & Polymer-Based Foils Through 2035

Kraft Labels Market
Kraft Labels Market

Kraft Labels Market Size and Share Forecast Outlook 2025 to 2035

HAZMAT Labels Market

HAZMAT Labels Market Growth and Forecast 2025 to 2035

Printed Labels Market

Printed Labels Market Size and Share Forecast Outlook 2025 to 2035

Sheeted Labels Market

Sheeted Labels Market Size and Share Forecast Outlook 2025 to 2035

QR Code Labels Market

QR Code Labels Market Size and Share Forecast Outlook 2025 to 2035

Braille Labels Market

Braille Labels Market Size and Share Forecast Outlook 2025 to 2035

Future Market Insights

In-mold Labels Market

Chat With MaRIA

Chat With

MaRIA

Hi There, I am MaRIA, Your Market Research Intelligence Assistant. How may I help you?