
- Market Size (2026)
- USD 1.4 Bn
- Forecast (2036)
- USD 2.6 Bn
- CAGR (2026 to 2036)
- 6.1%
How big is the Insoluble Sulfur Market in 2026?
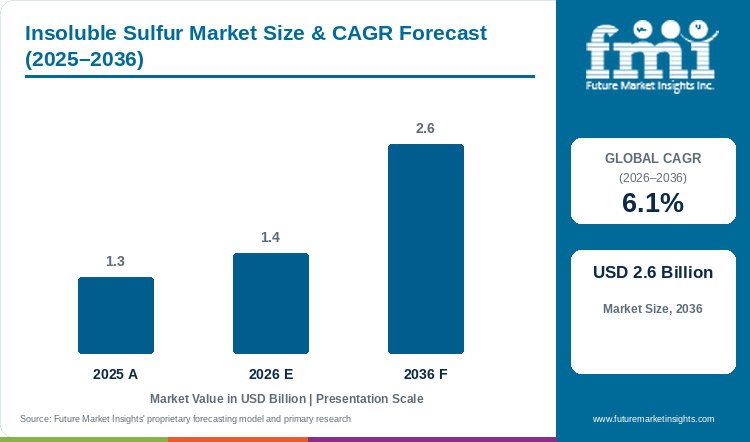
The Insoluble Sulfur Market is projected to reach USD 2.6 billion by 2036. The forecast CAGR is 6.1% from 2026 to 2036. The market is estimated at USD 1.4 billion in 2026. The market was valued at USD 1.3 billion in 2025. Supplier price notices give the clearest near-term read. On 10 September 2026 Flexsys announced an increase of up to 20% on all grades in every world region [5]. The increase applies to shipments from 15 September 2026, or as contracts allow [5]. An Asian increase from 18 June 2026 added US$0.60 per kilogram in China and the rest of Asia, and US$0.25 per kilogram in India [6]. Volumes are still rising. China Sunsine's insoluble sulfur sales volume grew 17% to 26,007 tonnes in the first half of 2026 [1].
Cost, not demand, has set the tone in 2026. Most elemental sulfur is a by-product of processing oil and gas, so its supply follows refinery runs, not rubber demand [4]. Contract sulfur at Tampa rose from USD 116 per long ton at the start of 2025 to USD 310 in early October, the highest fourth-quarter 2025 level since the second quarter of 2022 [4]. China Sunsine's group average selling price rose 9% in the first half of 2026 to RMB 16,586 per tonne, mainly on raw material costs [1]. Tire makers are passing costs on [16].
Key Market Trends & Insights
- Suppliers have repriced twice in 2026. Flexsys raised insoluble sulfur prices in Asia from 18 June 2026 [6]. It then announced a global increase of up to 20% for shipments from 15 September 2026 [5]. Contract buyers therefore face two price steps within one quarter.
- Sales volumes are rising against unchanged nameplate capacity. China Sunsine lists insoluble sulfur capacity at 60,000 tonnes a year from FY2022 through FY2026 [1]. Its sales volume rose 14% to 46,371 tonnes in FY2025 [2]. It rose a further 17% in the first half of 2026 [1].
- Tire makers are absorbing higher inputs while volumes stay soft. Michelin reported tire volumes down 0.8% for the first nine months of 2026 [16]. Goodyear's third-quarter tire units fell to 38.6 million [18]. On 4 November 2026 Continental's chief financial officer said higher raw-material prices would weigh more heavily in the fourth quarter [20].
Regional Highlights
- Asia Pacific: China Sunsine's international sales volume rose 17% in the first half of 2026 [1]. Orders came from Chinese tire makers with overseas plants and from global tire makers such as Bridgestone and Pirelli [1].
- Europe: Continental raised its 2026 outlook on 4 November 2026. It called the third quarter very good, led by strong earnings in Europe [20]. Global automotive production fell about 1.6% in the quarter [20].
- North America: Goodyear's Americas tire units were flat at 19.6 million in the third quarter of 2026. Nine-month units were 52.3 million, against 57.1 million a year earlier [18]. Michelin said North American truck replacement sales faced low freight demand and weak consumer sentiment [16].
Insoluble Sulfur Market Size and Forecast
Table 1: Insoluble Sulfur Market Size and Forecast
| Market size and forecast | Value |
|---|---|
| Market size in 2025 | USD 1.3 billion |
| Estimated market size in 2026 | USD 1.4 billion |
| Projected market size by 2036 | USD 2.6 billion |
| CAGR from 2026 to 2036 | 6.1% |
Source: Future Market Insights analysis of the insoluble sulfur market, 2026.
Analyst Perspective
“Insoluble sulfur is bought on performance in the mixing room, but it is priced off sulfur and Middle East logistics. Buyers who treat it as a fixed-cost additive will be surprised by 2026 price steps. Useful signals are the Tampa contract price, supplier price notices and tire plant operating rates. Tire makers that qualify a second grade from a second supplier, and keep storage tight, carry less risk than those relying on one source.”
- Nikhil Kaitwade, Principal Consultant, FMI
How is the Insoluble Sulfur Market segmented?
- By grade: High Dispersion, High Stability and Regular
- By application: Tire Manufacturing, Industrials, Footwear and Others
- By region: North America, Europe, Asia Pacific and the Middle East and Africa
Why does High Dispersion lead by Grade in the Insoluble Sulfur Market in 2026?
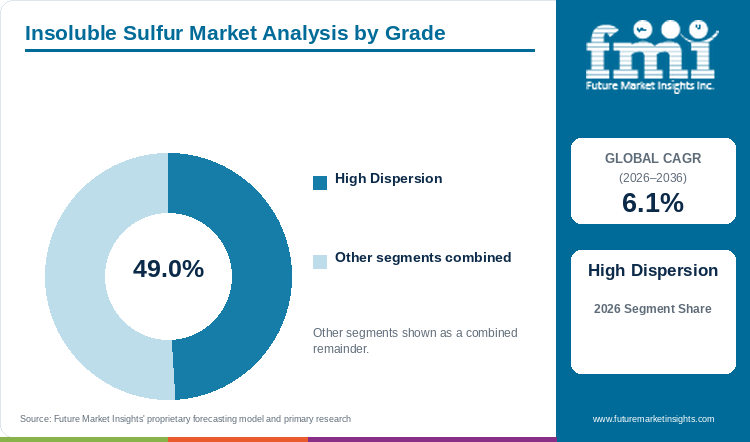
High Dispersion is estimated to account for 49.0% of the Insoluble Sulfur Market by grade in 2026. Insoluble sulfur is polymeric sulfur that stays out of solution in rubber. This delays scorch in the mixer and keeps sulfur from migrating to the surface [8]. Flexsys describes Crystex HD OT 20 as a special grade with improved flowability and dispersibility, and lists tires as its use [8]. Shikoku Chemicals sells Mucron OT-20HD, a high-dispersibility version of its Mucron OT-20 powder [12]. Lions Industries shows an HD-OT20 line next to its HS and IS 60 series [14]. Handling adds to the case. Flexsys says Crystex Cure Pro, offered with 10.5% oil, flows better, compacts less and doses more accurately in automatic systems [9]. Shikoku's two Mucron grades are both specified at 70.0% minimum carbon disulfide-insoluble content and 18 to 22% oil [12]. Their free acid is capped at 0.15% for OT-20 and 0.20% for OT-20HD [12]. Powders that meter consistently suit automated mixing lines, which fits the dispersion grades' position as the largest grade group.
Table 2: Grade, 2026 Share
| Leading Share | 2026 market share |
|---|---|
| High Dispersion | 49.0% |
| All Other Segments Combined Share | 51.0% |
Source: Future Market Insights analysis of the insoluble sulfur market, 2026.
Why does Tire Manufacturing lead by Application in the Insoluble Sulfur Market in 2026?
Tire Manufacturing is estimated to account for 42.0% of the Insoluble Sulfur Market by application in 2026. Flexsys says polymeric sulfur matters in tires and other plied-up rubber goods. It retards bin scorch, prevents sulfur migration and preserves surface tack [8]. Shikoku describes Mucron as essential to making radial tires [13]. China Sunsine says its insoluble sulfur improves bonding between rubber and rubber, rubber and steel, or rubber and chemical fibre [3]. That adhesion matters in tire cord construction [3]. Customer reach confirms the weight of tires. China Sunsine serves more than three-quarters of the global top 75 tire makers, including Bridgestone, Michelin, Goodyear and Pirelli [1]. Its first-half 2026 insoluble sulfur volume rose 17% on demand from those customers [1]. Volume at tire makers themselves is flat to lower. Michelin reported a 0.8% decline for nine months [16], so growth in this segment depends more on grade mix and supplier switching than on tire counts. Flexsys says Cure Pro has been shown to generate raw material cost savings by replacing sulfur master batch [9].
Table 3: Application, 2026 Share
| Leading Share | 2026 market share |
|---|---|
| Tire Manufacturing | 42.0% |
| All Other Segments Combined Share | 58.0% |
Source: Future Market Insights analysis of the insoluble sulfur market, 2026.
What are the key drivers, restraints and opportunities?
Driver
Radial and premium tire mix. Larger, higher-performance tires carry heavier compounds and tighter bloom limits. Continental said higher sales of ultra-high-performance tires of 18 inches and above helped its third quarter of 2026 [20]. Michelin said its MICHELIN-brand replacement volumes rose 4% by the end of September, led by 18-inch and larger sizes [16]. Flexsys positions Cure Pro on high thermal stability for bloom avoidance [9]. For filler supply, see the carbon black market.
Chinese tire exports and overseas plants. China Sunsine said international sales made up 52,324 tonnes of its 119,959 tonnes sold in the first half of 2026 [1]. Its insoluble sulfur volume rose 17% over the same period [1]. Its 2025 annual report records Chinese tire makers expanding overseas and China's rising share of global tire production [2]. The same report notes that trade protectionism creates barriers on tire exports [2]. Each new overseas plant becomes a qualification project for a supplier.
Restraint
Sulfur and energy price swings. USGS reports that Tampa contract sulfur moved from USD 116 to USD 310 per long ton during 2025 [4]. It also reports that the US average unit value of elemental sulfur rose to USD 180 per tonne from USD 46.42 in 2024 [4]. About 90% of US sulfur consumed took the form of sulfuric acid [4]. Rubber chemical makers therefore buy in a market shaped mainly by other users. Flexsys ties its September 2026 increase to Middle East costs [5]. Suppliers carry the risk when contracts lag.
Stability and handling limits. Flexsys states that its insoluble sulfur grades are metastable. They can revert to soluble sulfur if not stored under proper conditions, and alkaline accelerators speed the reversion [8][10]. Reversion defeats the purpose of buying the product. Buyers must therefore control warehouse temperature and accelerator pairing. Weak tire volumes add pressure. Goodyear's third-quarter 2026 tire units totalled 38.6 million, with EMEA volume down 6.7% [18]. Asia Pacific units were 7.9 million, against 8.4 million a year earlier [18].
Opportunity
Easier-dosing and thermally stable grades. Flexsys markets Cure Pro as an oiled grade. It lets tire plants raise output and reduce waste from bloom events [9]. Shikoku offers oil-treated powder with a defined impurity profile in 20 kg and 500 kg domestic packs and 25 kg and 800 kg export packs [12]. Suppliers that pair flow, stability and packaging for automated lines can hold price when raw material costs rise.
Non-tire rubber goods. China Sunsine lists tubes, belts, shoes, rollers, cables, seals and latex products among uses [3]. It describes the product as non-contaminating to molds [3]. Lions Industries points to light-coloured rubber goods, where common sulfur at high loading would bloom [14]. These uses are smaller than tires but less exposed to original-equipment swings.
Insoluble Sulfur Market by Country (2026 to 2036)
Table 4: Insoluble Sulfur Market Country Growth Forecast
| Country | CAGR, 2026 to 2036 |
|---|---|
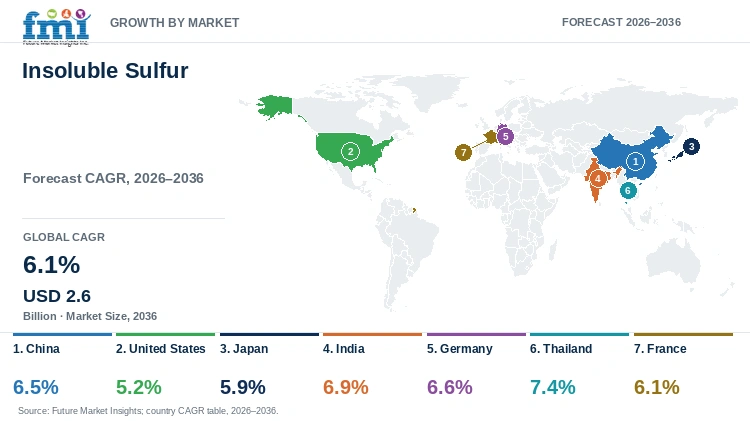
| China | 6.5% |
| United States | 5.2% |
| Japan | 5.9% |
| India | 6.9% |
| Germany | 6.6% |
| Thailand | 7.4% |
| France | 6.1% |
Source: Future Market Insights analysis of the insoluble sulfur market, 2026.
China
China Sunsine calls itself the biggest insoluble sulfur producer in China. On 12 August 2026 it reported first-half 2026 insoluble sulfur sales of RMB 268.5 million on 26,007 tonnes [1]. A year earlier, sales were RMB 143.3 million on 22,265 tonnes [1]. Its 60,000-tonne annual insoluble sulfur capacity has not changed since FY2022 [1].
The 2025 picture was harder. Sunsine's FY2025 insoluble sulfur volume rose 14% to 46,371 tonnes, for revenue of RMB 305.7 million [2]. Even so, the group's average selling price fell 10%. It described persistent oversupply and intense competition in Chinese rubber chemicals [2]. By the first half of 2026 the group's price had turned up 9% on raw material costs [1]. Flexsys added US$0.60 per kilogram to its China insoluble sulfur prices from 18 June 2026 [6].
Demand has an export tilt. Sunsine's 2025 annual report records record Chinese vehicle sales of 34.4 million units, up 9.4% [2]. Continental said Chinese automotive production fell 6% in the third quarter of 2026 [20]. Michelin described a contracting Chinese original-equipment market [16]. Local suppliers lean on overseas tire plants and global tire makers. Buyers abroad should therefore expect Chinese price moves to reach them quickly.
United States
Goodyear reported on 4 November 2026 that third-quarter tire units in the Americas were flat at 19.6 million [18]. Nine-month units were 52.3 million, against 57.1 million a year earlier [18]. Across the group, higher tariffs and other costs reduced third-quarter segment operating income by USD 48 million [18]. Michelin said North American original-equipment truck tire sales improved as Class 8 orders recovered [16]. Its replacement sales faced low freight demand and weak consumer sentiment [16].
Input cost is local as well as imported. USGS says US elemental sulfur averaged USD 180 per tonne in 2025, against USD 46.42 in 2024 [4]. It reports 86 producing operations in 26 states and net import reliance of 14% [4]. Sulfur itself enters the country free of duty under normal trade relations [4]. Tire makers are therefore exposed mainly through the price their rubber chemical suppliers pass on.
Flexsys is headquartered in Akron, Ohio. It lists US manufacturing sites at Sauget, Illinois, Monongahela, Pennsylvania and Cartersville, Georgia [11]. It names Americas International as its authorised distributor for Crystex HD OT 20 in North America [8]. The global price increase of up to 20% from 15 September 2026 therefore reaches US contract renewals directly [5].
Japan
Shikoku Chemicals sells insoluble sulfur under the Mucron name for rubber vulcanization. The OT-20 and OT-20HD grades are specified at 78 to 82% total sulfur. They have at least 70.0% carbon disulfide-insoluble content and 18 to 22% oil [12]. The company gives the CAS number as 9035-99-8 for insoluble sulfur alone [12]. Its company page links the product to radial tire production [13].
Packaging separates domestic and export supply. Domestic shipments use 20 kg kraft bags or 500 kg flexible containers. Exports use 25 kg bags or 800 kg containers [12]. USGS puts Japan's sulfur production at 2.7 million tonnes in 2024 [4].
Tire demand drives the order book. Bridgestone reported first-half 2026 results on 7 August 2026 [21]. It has scheduled its third-quarter 2026 results for 12 November 2026 [21]. Flexsys keeps an office in Tokyo [11]. Japanese buyers can therefore compare a domestic and an international offer when the Flexsys increase reaches them.
India
Flexsys told customers it would add US$0.25 per kilogram to insoluble sulfur in India from 18 June 2026 [6]. That compares with US$0.60 per kilogram in China and the rest of Asia [6]. India is also a large sulfur producer, with an estimated 3.7 million tonnes in 2025 [4].
CEAT reported on 14 October 2026 that its second-quarter FY27 consolidated revenue was Rs 4,762 crore. That was up 26.2% on a year earlier, driven by price hikes and volume growth [23]. Its gross margin fell to 34.6% from 40.9% a year earlier [23]. Its raw material basket cost rose by a high single-digit percentage on the previous quarter [23].
Indian tire makers are raising prices to offset input costs [23]. Michelin reported similar price hikes made in reaction to rising input costs [16]. Goodyear lists India among the countries where its Asia Pacific segment makes tires [19]. Buyers that need insoluble sulfur should expect supplier notices to follow Chinese and Southeast Asian moves. They should negotiate index-linked terms.
Germany
Continental reported on 4 November 2026 that its tire business posted very good third-quarter results. Strong earnings in Europe led the quarter, and the company raised its 2026 outlook [20]. Group sales from continuing operations were EUR 3.5 billion, with an adjusted EBIT margin of 14.9% [20]. European automotive production was broadly in line with the previous year. North America fell 5% and China 6% [20].
Raw materials are the stress point. Continental's chief financial officer said higher raw-material prices are increasingly affecting earnings [20]. The company said the effect would grow in the fourth quarter [20]. The Flexsys increase of up to 20%, for shipments from 15 September 2026, will feed into that fourth-quarter pressure for a compounder that buys insoluble sulfur [5].
Flexsys lists a manufacturing site in Nienburg/Weser, Germany, and an Antwerp site in Belgium [11]. Safic Alcan SAS is the authorised distributor for Crystex grades in Germany and across Europe [8][10]. German tire plants can therefore source locally. That limits transport risk but not price risk.
Thailand
Thailand's forecast rate of 7.4% is the highest of the seven profiled countries. Its tire plant base is international. Goodyear says its Asia Pacific segment manufactures tires at seven plants in China, India, Indonesia and Thailand [19]. Michelin's 2025 registration document refers to its Rayong plant in Thailand [22].
Thailand is also a source of natural rubber, and that supply carries risk. Michelin notes that heavy rains caused crop losses in Thailand in 2024 [22]. It also trains smallholders there in sustainable practices [22]. Tire makers that buy natural rubber from Thailand also depend on sulfur systems that cure it cleanly.
Suppliers reach Thailand from nearby bases. Flexsys operates a manufacturing and sales site at Gebeng, Kuantan, in Malaysia [11]. Its 18 June 2026 notice raised insoluble sulfur by US$0.60 per kilogram across the rest of Asia, which includes Thailand [6]. China Sunsine's rubber chemical sales to Asia outside China were RMB 1.1 billion in 2025 [2]. That was second only to its sales in China, at RMB 1.8 billion [2].
France
Michelin, headquartered in France, reported on 20 October 2026 that group revenue was EUR 19.2 billion for the first nine months of 2026 [16]. Tire volumes fell 0.8% on weaker original-equipment sales [16]. MICHELIN-brand replacement volumes rose 4% by the end of September [16].
Michelin said its price effect turned positive in the third quarter, because of price hikes made in reaction to rising input costs [16]. In July the company said lower raw material prices had helped first-half earnings [17]. Higher manufacturing and logistics costs from inflation and customs tariffs partly offset that help [17]. The turn from falling to rising raw materials within one half-year shows why insoluble sulfur contracts are being reopened.
Safic Alcan SAS is named by Flexsys as authorised distributor of Crystex HD OT 20 for France, Belgium, Germany and many other European markets [8]. Michelin confirmed full-year guidance on 20 October 2026 [16]. The French tire demand outlook is therefore steady, even as input costs move.
Who are the notable companies in the Insoluble Sulfur Market?
Notable companies in the Insoluble Sulfur Market include Flexsys, China Sunsine Chemical Holdings, Shikoku Chemicals Corporation and Lions Industries.
Supply splits by where the product is made and how it is sold. China Sunsine produces in China. It lists 60,000 tonnes of annual insoluble sulfur capacity [1] and sells to more than three-quarters of the global top 75 tire makers [1]. Lions Industries says its production units are mainly in Asia. It sells in Europe, Asia and the United States, and holds stock in a global warehouse network [15]. Flexsys sells Crystex through authorised distributors in Europe, Latin America and North America [8]. It lists manufacturing sites in North America, South America, Europe and Asia [11].
Grade breadth is the second differentiator. Flexsys lists seven Crystex products [7][10][24]. They range from Cure Pro and HD OT 20 to OT 33 AS, a silica blend, and 60 OT 10, a mixture of polymeric and rhombic sulfur [7][10][24]. China Sunsine lists IS-HS 8010, 7520, 7020, 6033, IS 60 and IS 90 [3]. Shikoku sells two Mucron grades with a published impurity profile [12]. Lions shows HS, IS 60 and HD-OT20 series [14]. Tire makers choose among these on dispersion, stability and oil content.
Price behaviour has become a competitive signal. Flexsys moved first in Asia in June and globally in September 2026 [5][6]. China Sunsine reported that its group price rose 9% in the first half and that it kept a flexible pricing strategy [1]. In 2025 the same supplier was cutting prices because of oversupply [2]. A buyer who reads these reports sees Chinese pricing move from falling to rising within a year.
Key Developments in the Insoluble Sulfur Market
- On 14 April 2026 China Sunsine published its 2025 annual report. It showed insoluble sulfur sales volume of 46,371 tonnes, up 14%, and revenue of RMB 305.7 million for the year [2].
- On 18 June 2026 Flexsys announced an Asian insoluble sulfur price increase. It is US$0.60 per kilogram in China and the rest of Asia, and US$0.25 per kilogram in India [6]. The increase takes effect on or after that date or as contracts allow [6].
- On 12 August 2026 China Sunsine reported that first-half 2026 insoluble sulfur volume rose 17% to 26,007 tonnes [1]. Sales reached RMB 268.5 million [1].
- On 10 September 2026 Flexsys announced a global insoluble sulfur price increase of up to 20%. It covers all grades and package types, for shipments on or after 15 September 2026 or as contracts allow [5].
Key Players in the Insoluble Sulfur Market
- Flexsys
- China Sunsine Chemical Holdings Ltd.
- Shikoku Chemicals Corporation
- Lions Industries s.r.o.
Insoluble Sulfur Market Report Scope
Table 5: Insoluble Sulfur Market Report Scope
| Coverage field | Report scope |
|---|---|
| Market definition | Insoluble (polymeric) sulfur used as a non-blooming vulcanizing agent in rubber, measured by value of sales to end-use applications |
| Grade | High Dispersion, High Stability, Regular |
| Application | Tire Manufacturing, Industrials, Footwear, Others |
| Regions and profiled countries | North America, Europe, Asia Pacific and the Middle East and Africa (profiled countries: China, United States, Japan, India, Germany, Thailand, France) |
| Companies covered | Flexsys, China Sunsine Chemical Holdings Ltd., Shikoku Chemicals Corporation, Lions Industries s.r.o. |
| Forecast period | 2026 to 2036, with 2025 as the historical base year |
| Quantitative Units | USD billion |
Source: Future Market Insights analysis of the insoluble sulfur market, 2026.
Insoluble Sulfur Market by Segments
Insoluble Sulfur Market segmented by Grade:
- High Dispersion
- High Stability
- Regular
Insoluble Sulfur Market segmented by Application:
- Tire Manufacturing
- Industrials
- Footwear
- Others
Insoluble Sulfur Market by Region
- North America
- Europe
- Asia Pacific
- Middle East and Africa
- China
- United States
- Japan
- India
- Germany
- Thailand
- France
Research Sources and Bibliography
- [1] China Sunsine Chemical Holdings Ltd. (2026, August 12). China Sunsine Reported 19% Increase in 1H2026 Revenue and 5% Increase in Net Profit, Setting Another Half-Yearly Sales Volume Record (news release). https://chinasunsine.com/wp-content/uploads/2026/08/20260812-CSCH-1H2026-press-release.pdf
- [2] China Sunsine Chemical Holdings Ltd. (2026, April 14). Annual Report 2025. https://chinasunsine.com/wp-content/uploads/2026/04/China-Sunsine-Annual-Report-2025.pdf
- [3] China Sunsine Chemical Holdings Ltd. (n.d.). Products: Insoluble Sulphur. https://chinasunsine.com/our-business/products/
- [4] U.S. Geological Survey. (2026, February). Sulfur, Mineral Commodity Summaries 2026. https://pubs.usgs.gov/periodicals/mcs2026/mcs2026-sulfur.pdf
- [5] Flexsys. (2026, September 10). Flexsys Announces Global Price Increase for Insoluble Sulfur. https://flexsys.com/2026/flexsys-announces-global-price-increase-for-insoluble-sulfur-9-15-26/
- [6] Flexsys. (2026, June 18). Flexsys Announces Price Increase for Insoluble Sulfur in Asia. https://flexsys.com/2026/flexsys-announces-price-increase-for-insoluble-sulfur-in-asia/
- [7] Flexsys. (n.d.). Vulcanizing Agents (Crystex). https://flexsys.com/vulcanizing-agents/
- [8] Flexsys. (n.d.). Crystex HD OT 20. https://flexsys.com/flexsys_products/crystex-hdot20/
- [9] Flexsys. (n.d.). Crystex Cure Pro. https://flexsys.com/flexsys_products/crystex-cure-pro/
- [10] Flexsys. (n.d.). Crystex OT 33 AS. https://flexsys.com/flexsys_products/crystex-ot33as/
- [11] Flexsys. (n.d.). Locations. https://flexsys.com/locations/
- [12] Shikoku Chemicals Corporation. (n.d.). Insoluble sulfur Mucron (quality specifications). https://kagaku.shikoku.co.jp/products/rubber/insoluble/
- [13] Shikoku Chemicals Corporation. (n.d.). Product information: tire and rubber materials. https://kagaku.shikoku.co.jp/en/
- [14] Lions Industries s.r.o. (n.d.). Insoluble sulphur. https://www.lions-industries.com/en/Products/Insoluble-Sulphur.html
- [15] Lions Industries s.r.o. (n.d.). Rubber Additives Division, company overview. https://www.lions-industries.com/
- [16] Michelin. (2026, October 20). Financial information at September 30, 2026. https://www.michelin.com/en/publications/group/financial-information-at-september-30-2026
- [17] Michelin. (2026, July 27). Financial information at June 30, 2026. https://www.michelin.com/en/publications/group/financial-information-at-june-30-2026
- [18] The Goodyear Tire & Rubber Company. (2026, November 4). Goodyear Announces Third Quarter 2026 Results. https://news.goodyear.com/2026-11-04-Goodyear-Announces-Third-Quarter-2026-Results
- [19] The Goodyear Tire & Rubber Company. (2026, February 10). Annual Report on Form 10-K for the year ended December 31, 2025. https://www.sec.gov/Archives/edgar/data/42582/000162828026006708/gt-20251231.htm
- [20] Continental AG. (2026, November 4). Continental Raises Outlook After Good Third Quarter (press release). https://cdn.continental.com/fileadmin/__imported/sites/corporate/_international/english/hubpages/30_20investors/40_20events/results/9m_2026/20261104-pr-continental-q3-2026-en.pdf
- [21] Bridgestone Corporation. (n.d.). Investor Relations, IR calendar and news. https://www.bridgestone.com/ir/
- [22] Compagnie Generale des Etablissements Michelin. (2026). 2025 Universal Registration Document. https://agngnconpm.cloudimg.io/v7/https://dgaddcosprod.blob.core.windows.net/cxf-corporate/attachments/f40ixh7py2bnps4raz3p2z4q-universal-registration-document-for-2025.pdf
- [23] CEAT Limited. (2026, October 14). Q2 FY27 Investor Presentation. https://www.ceat.com/content/dam/ceat/pdf/CEATInvestorPresentationQ2FY27signed.pdf
- [24] Flexsys. (n.d.). Crystex 60 OT 10. https://flexsys.com/flexsys_products/crystex-60ot10/
Table of Content
Table of Content
- Key Takeaways
- Market Size and CAGR
- Top Growth Driver
- Fastest Growing Segment
- Leading Region
- Key Companies
- Emerging Opportunities
- Executive Summary
- Global Market Outlook
- Demand-side Trends
- Supply-side Trends
- Technology Roadmap Analysis
- Analysis and Recommendations
- Analyst Perspective (What is happening? Why now? What should investors know?)
- Key Questions Answered
- How large is the market?
- What is the CAGR?
- What are key trends?
- Which region dominates?
- Who are the leaders?
Read More...
- Market Overview
- Market Coverage / Taxonomy
- Market Definition / Scope / Limitations
- Research Methodology
- Chapter Orientation
- Analytical Lens and Working Hypotheses
- Market Structure, Signals, and Trend Drivers
- Benchmarking and Cross-market Comparability
- Market Sizing, Forecasting, and Opportunity Mapping
- Research Design and Evidence Framework
- Desk Research Programme (Secondary Evidence)
- Expert Input and Fieldwork (Primary Evidence)
- Tooling, Models, and Reference Databases
- Data Engineering and Model Build
- Quality Assurance and Audit Trail
- Market Background
- Market Dynamics (Drivers, Restraints, Opportunity, Trends)
- Scenario Forecast (Optimistic, Likely, Conservative)
- Impact Analysis
- AI Impact
- Sustainability Impact
- Regulatory Impact
- Technology Impact
- Consumer / Buyer Analysis
- Purchase Drivers
- Adoption Barriers
- Buyer Journey
- Opportunity Map Analysis
- Product Life Cycle Analysis
- Supply Chain Analysis
- Investment Feasibility Matrix
- Value Chain Analysis
- PESTLE and Porter's Analysis
- Regulatory Landscape
- Regional Parent Market Outlook
- Production and Consumption Statistics
- Import and Export Statistics
- Global Market Analysis and Forecast, 2021 to 2036
- Historical Market Size Value (USD Billion) Analysis, 2021 to 2025
- Current and Future Market Size Value (USD Billion) Projections, 2026 to 2036
- Y-o-Y Growth Trend Analysis
- Absolute $ Opportunity Analysis
- Global Market Pricing Analysis, 2021 to 2036
- Global Market Analysis and Forecast, By Grade, 2021 to 2036
- Introduction / Key Findings
- Historical Market Size Value (USD Billion) Analysis By Grade, 2021 to 2025
- Current and Future Market Size Value (USD Billion) Analysis and Forecast By Grade, 2026 to 2036
- High Dispersion
- High Stability
- Regular
- Y-o-Y Growth Trend Analysis By Grade, 2021 to 2025
- Absolute $ Opportunity Analysis By Grade, 2026 to 2036
- Global Market Analysis and Forecast, By Application, 2021 to 2036
- Introduction / Key Findings
- Historical Market Size Value (USD Billion) Analysis By Application, 2021 to 2025
- Current and Future Market Size Value (USD Billion) Analysis and Forecast By Application, 2026 to 2036
- Tire Manufacturing
- Industrials
- Footwear
- Others
- Y-o-Y Growth Trend Analysis By Application, 2021 to 2025
- Absolute $ Opportunity Analysis By Application, 2026 to 2036
- Global Market Analysis and Forecast, By Region, 2021 to 2036
- Introduction
- Historical Market Size Value (USD Billion) Analysis By Region, 2021 to 2025
- Current Market Size Value (USD Billion) Analysis and Forecast By Region, 2026 to 2036
- North America
- Europe
- Asia Pacific
- Middle East and Africa
- Market Attractiveness Analysis By Region
- North America Market Analysis and Forecast, By Country, 2021 to 2036
- Historical Market Size Value (USD Billion) Trend Analysis By Market Taxonomy, 2021 to 2025
- Market Size Value (USD Billion) Forecast By Market Taxonomy, 2026 to 2036
- By Country
- By Grade
- By Application
- Market Attractiveness Analysis
- By Country
- By Grade
- By Application
- Key Takeaways
- Europe Market Analysis and Forecast, By Country
- Historical Market Size Value (USD Billion) Trend Analysis By Market Taxonomy, 2021 to 2025
- Market Size Value (USD Billion) Forecast By Market Taxonomy, 2026 to 2036
- By Country
- By Grade
- By Application
- Market Attractiveness Analysis
- By Country
- By Grade
- By Application
- Key Takeaways
- Asia Pacific Market Analysis and Forecast, By Country
- Historical Market Size Value (USD Billion) Trend Analysis By Market Taxonomy, 2021 to 2025
- Market Size Value (USD Billion) Forecast By Market Taxonomy, 2026 to 2036
- By Country
- By Grade
- By Application
- Market Attractiveness Analysis
- By Country
- By Grade
- By Application
- Key Takeaways
- Middle East and Africa Market Analysis and Forecast, By Country
- Historical Market Size Value (USD Billion) Trend Analysis By Market Taxonomy, 2021 to 2025
- Market Size Value (USD Billion) Forecast By Market Taxonomy, 2026 to 2036
- By Country
- China
- United States
- Japan
- India
- Germany
- Thailand
- France
- By Grade
- By Application
- By Country
- Market Attractiveness Analysis
- By Country
- By Grade
- By Application
- Key Takeaways
- Key Countries Market Analysis
- United States
- Pricing Analysis
- Market Share Analysis, 2025
- By Grade
- By Application
- Germany
- Pricing Analysis
- Market Share Analysis, 2025
- By Grade
- By Application
- France
- Pricing Analysis
- Market Share Analysis, 2025
- By Grade
- By Application
- India
- Pricing Analysis
- Market Share Analysis, 2025
- By Grade
- By Application
- China
- Pricing Analysis
- Market Share Analysis, 2025
- By Grade
- By Application
- Japan
- Pricing Analysis
- Market Share Analysis, 2025
- By Grade
- By Application
- Thailand
- Pricing Analysis
- Market Share Analysis, 2025
- By Grade
- By Application
- United States
- Market Structure Analysis
- Competition Dashboard
- Competition Benchmarking
- Market Share Analysis of Top Players
- By Regional
- By Grade
- By Application
- Emerging Startups
- Innovation Benchmarking
- Competition Analysis
- Competition Deep Dive
- Flexsys
- Overview
- Product Portfolio
- Profitability by Market Segments
- Sales Footprint
- Strategy Overview
- Marketing Strategy
- Product Strategy
- Channel Strategy
- China Sunsine Chemical Holdings Ltd.
- Shikoku Chemicals Corporation
- Lions Industries s.r.o.
- Flexsys
- Case Studies
- Success Stories
- Recent Developments
- Competition Deep Dive
- Assumptions & Acronyms Used
List of Tables
- Table 1: Global Market Value (USD Billion) Forecast by Region, 2021 to 2036
- Table 2: Global Market Value (USD Billion) Forecast by Grade, 2021 to 2036
- Table 3: Global Market Value (USD Billion) Forecast by Application, 2021 to 2036
- Table 4: North America Market Value (USD Billion) Forecast by Country, 2021 to 2036
- Table 5: North America Market Value (USD Billion) Forecast by Grade, 2021 to 2036
- Table 6: North America Market Value (USD Billion) Forecast by Application, 2021 to 2036
- Table 7: Europe Market Value (USD Billion) Forecast by Country, 2021 to 2036
- Table 8: Europe Market Value (USD Billion) Forecast by Grade, 2021 to 2036
- Table 9: Europe Market Value (USD Billion) Forecast by Application, 2021 to 2036
- Table 10: Asia Pacific Market Value (USD Billion) Forecast by Country, 2021 to 2036
- Table 11: Asia Pacific Market Value (USD Billion) Forecast by Grade, 2021 to 2036
- Table 12: Asia Pacific Market Value (USD Billion) Forecast by Application, 2021 to 2036
- Table 13: Middle East and Africa Market Value (USD Billion) Forecast by Country, 2021 to 2036
- Table 14: Middle East and Africa Market Value (USD Billion) Forecast by Grade, 2021 to 2036
- Table 15: Middle East and Africa Market Value (USD Billion) Forecast by Application, 2021 to 2036
List of Figures
- Figure 1: Global Market Pricing Analysis
- Figure 2: Global Market Value (USD Billion) Forecast 2021-2036
- Figure 3: Global Market Value Share and BPS Analysis by Grade, 2026 and 2036
- Figure 4: Global Market Y-o-Y Growth Comparison by Grade, 2026-2036
- Figure 5: Global Market Attractiveness Analysis by Grade
- Figure 6: Global Market Value Share and BPS Analysis by Application, 2026 and 2036
- Figure 7: Global Market Y-o-Y Growth Comparison by Application, 2026-2036
- Figure 8: Global Market Attractiveness Analysis by Application
- Figure 9: Global Market Value (USD Billion) Share and BPS Analysis by Region, 2026 and 2036
- Figure 10: Global Market Y-o-Y Growth Comparison by Region, 2026-2036
- Figure 11: Global Market Attractiveness Analysis by Region
- Figure 12: North America Market Incremental Dollar Opportunity, 2026-2036
- Figure 13: Europe Market Incremental Dollar Opportunity, 2026-2036
- Figure 14: Asia Pacific Market Incremental Dollar Opportunity, 2026-2036
- Figure 15: Middle East and Africa Market Incremental Dollar Opportunity, 2026-2036
- Figure 16: North America Market Value Share and BPS Analysis by Country, 2026 and 2036
- Figure 17: North America Market Value Share and BPS Analysis by Grade, 2026 and 2036
- Figure 18: North America Market Y-o-Y Growth Comparison by Grade, 2026-2036
- Figure 19: North America Market Attractiveness Analysis by Grade
- Figure 20: North America Market Value Share and BPS Analysis by Application, 2026 and 2036
- Figure 21: North America Market Y-o-Y Growth Comparison by Application, 2026-2036
- Figure 22: North America Market Attractiveness Analysis by Application
- Figure 23: Europe Market Value Share and BPS Analysis by Country, 2026 and 2036
- Figure 24: Europe Market Value Share and BPS Analysis by Grade, 2026 and 2036
- Figure 25: Europe Market Y-o-Y Growth Comparison by Grade, 2026-2036
- Figure 26: Europe Market Attractiveness Analysis by Grade
- Figure 27: Europe Market Value Share and BPS Analysis by Application, 2026 and 2036
- Figure 28: Europe Market Y-o-Y Growth Comparison by Application, 2026-2036
- Figure 29: Europe Market Attractiveness Analysis by Application
- Figure 30: Asia Pacific Market Value Share and BPS Analysis by Country, 2026 and 2036
- Figure 31: Asia Pacific Market Value Share and BPS Analysis by Grade, 2026 and 2036
- Figure 32: Asia Pacific Market Y-o-Y Growth Comparison by Grade, 2026-2036
- Figure 33: Asia Pacific Market Attractiveness Analysis by Grade
- Figure 34: Asia Pacific Market Value Share and BPS Analysis by Application, 2026 and 2036
- Figure 35: Asia Pacific Market Y-o-Y Growth Comparison by Application, 2026-2036
- Figure 36: Asia Pacific Market Attractiveness Analysis by Application
- Figure 37: Middle East and Africa Market Value Share and BPS Analysis by Country, 2026 and 2036
- Figure 38: Middle East and Africa Market Value Share and BPS Analysis by Grade, 2026 and 2036
- Figure 39: Middle East and Africa Market Y-o-Y Growth Comparison by Grade, 2026-2036
- Figure 40: Middle East and Africa Market Attractiveness Analysis by Grade
- Figure 41: Middle East and Africa Market Value Share and BPS Analysis by Application, 2026 and 2036
- Figure 42: Middle East and Africa Market Y-o-Y Growth Comparison by Application, 2026-2036
- Figure 43: Middle East and Africa Market Attractiveness Analysis by Application
- Figure 44: Global Market - Tier Structure Analysis
- Figure 45: Global Market - Company Share Analysis
Frequently Asked Questions
How big is the insoluble sulfur market in 2026?
The Insoluble Sulfur Market is estimated at USD 1.4 billion in 2026, up from USD 1.3 billion in 2025. It is projected to reach USD 2.6 billion by 2036, a 6.1% CAGR from 2026 to 2036.
Which grade and application lead the insoluble sulfur market?
High Dispersion leads by grade with 49.0% of the market in 2026. Tire Manufacturing leads by application with 42.0%. Flexsys describes Crystex HD OT 20 as a grade with improved flowability and dispersibility for tires [8]. China Sunsine says it serves more than three-quarters of the global top 75 tire makers [1].
Which other segments matter?
High Stability holds 29.0% and Regular 22.0% by grade. Industrials hold 25.0%, Footwear 18.0% and Others 15.0% by application. China Sunsine lists tubes, belts, shoes, rollers, cables, seals and latex products among uses [3].
Which profiled country is forecast to grow fastest?
Thailand has the highest forecast CAGR of the seven profiled countries at 7.4% from 2026 to 2036, ahead of India at 6.9% and Germany at 6.6%. Goodyear lists Thailand among its Asia Pacific tire plant locations [19], and Michelin refers to its Rayong plant there [22].
What is changing in supply and pricing in 2026?
Flexsys announced an increase of up to 20% on all insoluble sulfur grades from 15 September 2026 [5]. It followed an Asian increase from 18 June 2026 of US$0.60 per kilogram in China and US$0.25 per kilogram in India [6]. China Sunsine linked its higher group prices to raw material costs after the conflict in Iran and disruption to Strait of Hormuz shipping [1].
What should a buyer check when choosing an insoluble sulfur grade?
Check insoluble content, oil level and impurity limits first. Shikoku specifies Mucron at 78 to 82% total sulfur, at least 70.0% carbon disulfide-insoluble content and 18 to 22% oil [12]. Flexsys offers a 10.5% oiled Cure Pro [9]. Then confirm storage conditions. Flexsys notes that its grades can revert to soluble sulfur if stored badly, and that alkaline accelerators speed reversion [8].
Preview the report firsthand - request a free sample
Get SampleGet the brochure for pricing and purchase details.
Get PDF
