Inventory Tag Market Overview for 2024 to 2034

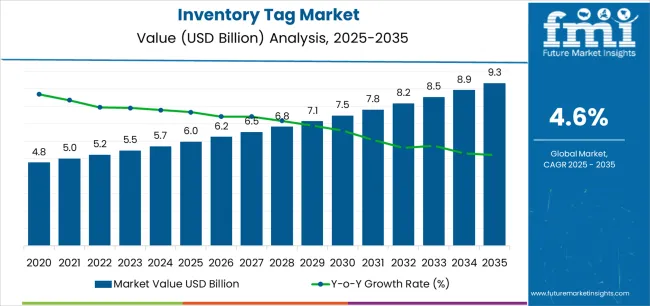
The inventory tag market is expected to grow at a CAGR of 4.8% from 2024 to 2034. The market value is projected to increase from USD 5.7 billion in 2024 to USD 9.1 billion by 2034.

Attributes Details
Inventory Tag Market Size, 2024 USD 5.7 billion
Projected Market Size, 2034 USD 9.1 billion
Value-based CAGR (2024 to 2034) 4.8%

Key Opportunities in the Inventory Tag Market

  • Rising demand for real-time inventory tracking is expected to create lucrative opportunities during the forecast period.
  • Increasing complexity of supply chains has become more important than ever for businesses to have real-time visibility into their inventory levels. This is where inventory tags come into play.
  • Using inventory tags with real-time tracking capabilities, businesses can monitor their inventory levels in real-time, enabling them to make faster and more informed decisions.
  • The need for efficient inventory management systems is stimulating the demand for medical devices and consumables in the inventory tag market.
  • Inventory tags are expected to help automate the inventory management process, ensuring that healthcare providers always have the necessary supplies on hand.
  • Increasing popularity of online shopping and eCommerce companies are putting pressure to deliver products quickly and efficiently.
  • Inventory tags are expected to drive growth in eCommerce companies to manage their inventory more effectively, enabling them to fulfill orders in a faster and more accurate manner.
  • Increasing adoption of RFID tags for the storage of a lot more information than barcodes can be read from a distance, making them ideal for use in large warehouses and distribution centers.

Challenges in the Inventory Tag Market

  • The issue of tag durability is expected to hamper the market growth over the coming years.
  • Many tags are exposed to harsh environments, such as extreme temperatures or chemicals, which can cause them to deteriorate or fall off, leading to a loss of data and inventory tracking accuracy, which can be a significant problem for businesses.
  • While RFID tags and QR codes provide significant benefits in terms of inventory tracking and data collection, they are only effective if they can be read reliably.
  • While the cost of inventory tags has decreased significantly in recent years, they still represent a significant investment for many businesses, particularly those with large inventories.
  • Cost fluctuation makes it difficult for smaller businesses to justify the expense of implementing an inventory tagging system.
  • Concerns related to data security are expected to hinder market growth during the anticipated period.
  • With the increasing use of RFID and other wireless technologies, there is a risk that inventory data could be intercepted or hacked, potentially leading to a loss of sensitive information or even theft of inventory.

Category-wise Insights

In terms of Technology, the RFID Segment Leads the Market Growth

Attributes Details
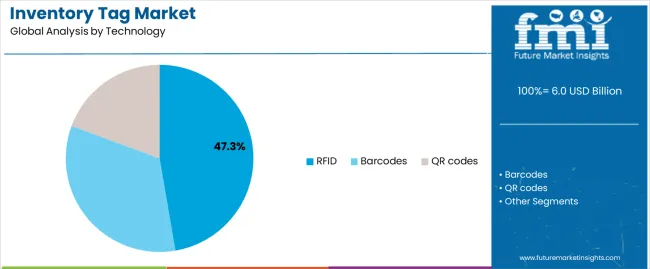
Top Technology RFID
CAGR (2024 to 2034) 4.6%
  • RFID technology is growing in popularity due to the increasing investments made by various industries.
  • The retail and healthcare industries are adopting RFID technology to improve their inventory management processes and reduce costs.
  • Increasing demand for inventory management solutions in the eCommerce sector is also driving the growth of the RFID technology segment in the inventory tag market.
  • E-commerce companies are looking for more efficient and automated inventory management solutions to improve their operations and meet the growing demands of their customers.
  • RFID tags can be read remotely and do not require line-of-sight, making them more convenient and user-friendly for businesses.

In terms of Materials, the Plastic Segment is dominating the Market

Attributes Details
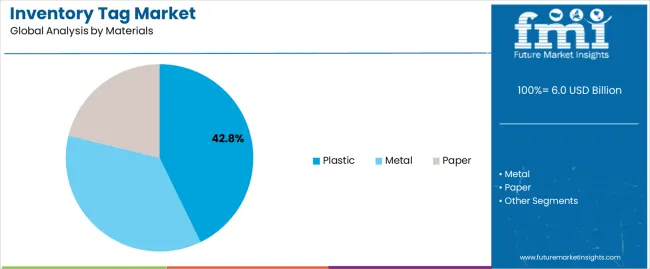
Top Material Plastic
CAGR (2024 to 2034) 4.4%
  • The plastic segment is expected to continue its dominance in the inventory tag market due to the growing demand for inventory management systems across various industries.
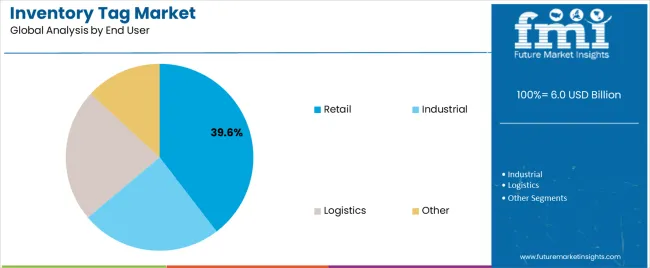
  • The retail sector has been a major driver of growth in the inventory tag market due to the increasing need to track products from the warehouse to the store shelves.
  • Rising adoption of eCommerce and Omni channel retailing has increased the complexity of inventory management, which leads to an increased demand for more advanced inventory tags.
  • Plastic bags, with their customizability and affordability, are well-positioned to meet this demand.

Country-wise insights

Countries CAGR through 2034
United States 5.0%
United Kingdom 5.5%
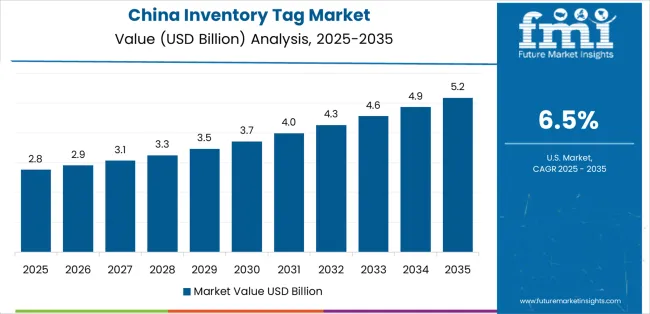
China 4.2%
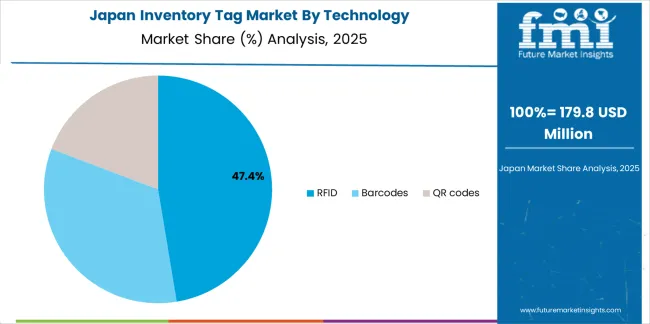
Japan 3.9%
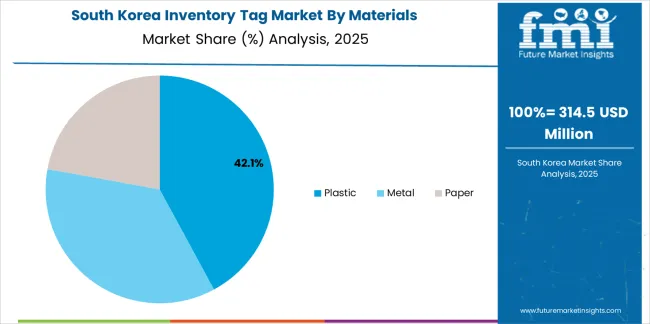
South Korea 3.2%

Rising eCommerce Industry in the United States

  • In the United States, the increasing demand for inventory tags can be attributed to the growing e-commerce industry.
  • The rise of online shopping has led to an increase in demand for efficient inventory management systems. Inventory tags are an integral part of such systems, as they help in tracking and organizing products in warehouses and distribution centers.

Shift Toward Omni Channel Retailing in the United Kingdom

  • In the United Kingdom, the increasing demand for inventory tags can be linked to the country's exit from the European Union.
  • Brexit has led to changes in import and export regulations, which has made it imperative for companies to have better control over their inventory.
  • The United Kingdom’s retail industry is witnessing a shift towards Omni channel retailing, which has led to an increase in demand for inventory tags that can support both online and offline sales channels.

Rising Promotion of RFID Technology in China

  • The Chinese government's promotion of RFID technology promotes sales of inventory tags in China.
  • The government has been actively promoting the use of RFID tags in a variety of industries, including retail, logistics, and manufacturing, as part of its "Internet Plus" initiative.
  • The initiative aims to promote the integration of the Internet with traditional industries to drive innovation and growth.
  • To support the adoption of RFID technology, the government has provided subsidies to companies that invest in RFID infrastructure, such as readers and tags. It has also set up demonstration projects to showcase the benefits of RFID technology in various industries.

Increasing Government Initiatives Toward Automation in Japan

  • With the rise in eCommerce and retail businesses, there has been a surge in demand for automated inventory management solutions that can help businesses track their inventory in real time.
  • The government’s push towards digitalization and automation has been promoting the use of IoT technologies in various sectors, including retail and logistics.
  • Government initiatives leads to an increase in the adoption of inventory tags and other IoT-based solutions in Japan.
  • The need for better supply chain management in Japan is also promoting market growth.
  • With the globalization of supply chains, businesses are increasingly looking for ways to optimize their inventory management processes to reduce costs and improve efficiency.

Growing Industrial Sector in South Korea

  • The demand for inventory tags in South Korea is increasing due to the country's growing industrial sector.
  • Increasing emphasis on automation in South Korea is also driving growth in the market.
  • As more businesses in South Korea adopt automated processes, inventory tags are becoming more critical in ensuring that these processes run smoothly. By using inventory tags, businesses can streamline their inventory management systems and reduce the risk of errors and delays in their operations.

Competitive Landscape

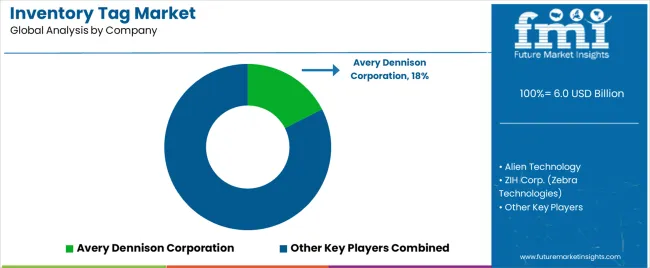
The market is highly competitive with a large number of players offering a wide range of solutions. Some of the key players in the market include well-established players and new entrants.

Key players offer a range of solutions for various industries including retail, healthcare, logistics, and manufacturing. The solutions provided by these players include RFID tags and labels, as well as software solutions for inventory management and asset tracking. The competition in the inventory tag market is driven by factors such as product innovation, pricing, and customer service.

Recent Developments in the Inventory Tag Market

  • In 2022, Avery Dennison Corporation recently introduced the AD Minidose U9 RAIN RFID inlay inventory tag, designed specifically for pharmaceutical applications. The company’s Smartrac division is a key player in the industry, providing automated medication tracking and diversion detection solutions to hospital pharmacies across the United States.
  • In 2022, HID Global acquired Vizinex RFID, a provider of high-performance RFID tags for various industries, including oil & gas, healthcare/medical, manufacturing, and data centers. The acquisition has expanded HID Global’s reach and influence in these industry verticals, and added critical technologies to its portfolio of industry-leading RFID tags.

Key Market Players

  • Avery Dennison Corporation
  • Alien Technology
  • ZIH Corp. (Zebra Technologies)
  • NXP Semiconductors
  • Impinj Inc.
  • SMARTRAC N.V.
  • Checkpoint Systems, Inc.
  • Motorola Solutions, Inc.
  • HID Global Corporation
  • Confidex Ltd.
  • Omni-ID Ltd.
  • Tageos SAS
  • Invengo Technology Pte. Ltd.
  • Identiv Inc.
  • SML Group

Key Coverage in the Inventory Tag Market Report

  • Warehouse Inventory Tags Market Landscape
  • RFID Inventory Tags Industry Assessment
  • Stock Tags Market Overview
  • Barcode Inventory Tags Pricing Outlook
  • Inventory Tracking Tags Deployment Analysis

Key Market Segments

By Technology:

  • RFID
  • Barcodes
  • QR codes

By Materials:

  • Plastic
  • Metal
  • Paper

By End User:

  • Retail
  • Industrial
  • Logistics
  • Other

By Region:

  • North America
  • Latin America
  • East Asia
  • South Asia
  • Europe
  • Oceania
  • MEA

Table of Content

  • 1. Executive Summary
  • 2. Market Overview
  • 3. Market Background
  • 4. Global Market Analysis 2019 to 2023 and Forecast, 2024 to 2034
  • 5. Global Market Analysis 2019 to 2023 and Forecast 2024 to 2034, By Technology
    • 5.1. RFID
    • 5.2. Barcodes
    • 5.3. QR codes
  • 6. Global Market Analysis 2019 to 2023 and Forecast 2024 to 2034, By Materials
    • 6.1. Plastic
    • 6.2. Metal
    • 6.3. Paper
  • 7. Global Market Analysis 2019 to 2023 and Forecast 2024 to 2034, By End-User
    • 7.1. Retail
    • 7.2. Industrial
    • 7.3. Logistics
    • 7.4. Other
  • 8. Global Market Analysis 2019 to 2023 and Forecast 2024 to 2034, By Region
    • 8.1. North America
    • 8.2. Latin America
    • 8.3. Western Europe
    • 8.4. Eastern Europe
    • 8.5. South Asia and Pacific
    • 8.6. East Asia
    • 8.7. Middle East and Africa
  • 9. North America Market Analysis 2019 to 2023 and Forecast 2024 to 2034, By Country
  • 10. Latin America Market Analysis 2019 to 2023 and Forecast 2024 to 2034, By Country
  • 11. Western Europe Market Analysis 2019 to 2023 and Forecast 2024 to 2034, By Country
  • 12. Eastern Europe Market Analysis 2019 to 2023 and Forecast 2024 to 2034, By Country
  • 13. South Asia and Pacific Market Analysis 2019 to 2023 and Forecast 2024 to 2034, By Country
  • 14. East Asia Market Analysis 2019 to 2023 and Forecast 2024 to 2034, By Country
  • 15. Middle East and Africa Market Analysis 2019 to 2023 and Forecast 2024 to 2034, By Country
  • 16. Key Countries Market Analysis
  • 17. Market Structure Analysis
  • 18. Competition Analysis
    • 18.1. Avery Dennison Corporation (USA)
    • 18.2. Tyco International Plc. (Ireland)
    • 18.3. Smartrac N.V. (The Netherlands)
    • 18.4. 3M Company (USA)
    • 18.5. Checkpoint Systems Inc. (USA)
    • 18.6. Brady Corporation (USA)
    • 18.7. Hewlett-Packard Company (USA)
    • 18.8. Alien Technology Inc. (USA)
    • 18.9. Zebra Technologies Corporation (USA)
  • 19. Assumptions & Acronyms Used
  • 20. Research Methodology

List of Tables

Table 1: Global Market Value (US$ Million) Forecast by Region, 2019 to 2034

Table 2: Global Market Volume (Units) Forecast by Region, 2019 to 2034

Table 3: Global Market Value (US$ Million) Forecast by Technology, 2019 to 2034

Table 4: Global Market Volume (Units) Forecast by Technology, 2019 to 2034

Table 5: Global Market Value (US$ Million) Forecast by Materials, 2019 to 2034

Table 6: Global Market Volume (Units) Forecast by Materials, 2019 to 2034

Table 7: Global Market Value (US$ Million) Forecast by End-User, 2019 to 2034

Table 8: Global Market Volume (Units) Forecast by End-User, 2019 to 2034

Table 9: North America Market Value (US$ Million) Forecast by Country, 2019 to 2034

Table 10: North America Market Volume (Units) Forecast by Country, 2019 to 2034

Table 11: North America Market Value (US$ Million) Forecast by Technology, 2019 to 2034

Table 12: North America Market Volume (Units) Forecast by Technology, 2019 to 2034

Table 13: North America Market Value (US$ Million) Forecast by Materials, 2019 to 2034

Table 14: North America Market Volume (Units) Forecast by Materials, 2019 to 2034

Table 15: North America Market Value (US$ Million) Forecast by End-User, 2019 to 2034

Table 16: North America Market Volume (Units) Forecast by End-User, 2019 to 2034

Table 17: Latin America Market Value (US$ Million) Forecast by Country, 2019 to 2034

Table 18: Latin America Market Volume (Units) Forecast by Country, 2019 to 2034

Table 19: Latin America Market Value (US$ Million) Forecast by Technology, 2019 to 2034

Table 20: Latin America Market Volume (Units) Forecast by Technology, 2019 to 2034

Table 21: Latin America Market Value (US$ Million) Forecast by Materials, 2019 to 2034

Table 22: Latin America Market Volume (Units) Forecast by Materials, 2019 to 2034

Table 23: Latin America Market Value (US$ Million) Forecast by End-User, 2019 to 2034

Table 24: Latin America Market Volume (Units) Forecast by End-User, 2019 to 2034

Table 25: Western Europe Market Value (US$ Million) Forecast by Country, 2019 to 2034

Table 26: Western Europe Market Volume (Units) Forecast by Country, 2019 to 2034

Table 27: Western Europe Market Value (US$ Million) Forecast by Technology, 2019 to 2034

Table 28: Western Europe Market Volume (Units) Forecast by Technology, 2019 to 2034

Table 29: Western Europe Market Value (US$ Million) Forecast by Materials, 2019 to 2034

Table 30: Western Europe Market Volume (Units) Forecast by Materials, 2019 to 2034

Table 31: Western Europe Market Value (US$ Million) Forecast by End-User, 2019 to 2034

Table 32: Western Europe Market Volume (Units) Forecast by End-User, 2019 to 2034

Table 33: Eastern Europe Market Value (US$ Million) Forecast by Country, 2019 to 2034

Table 34: Eastern Europe Market Volume (Units) Forecast by Country, 2019 to 2034

Table 35: Eastern Europe Market Value (US$ Million) Forecast by Technology, 2019 to 2034

Table 36: Eastern Europe Market Volume (Units) Forecast by Technology, 2019 to 2034

Table 37: Eastern Europe Market Value (US$ Million) Forecast by Materials, 2019 to 2034

Table 38: Eastern Europe Market Volume (Units) Forecast by Materials, 2019 to 2034

Table 39: Eastern Europe Market Value (US$ Million) Forecast by End-User, 2019 to 2034

Table 40: Eastern Europe Market Volume (Units) Forecast by End-User, 2019 to 2034

Table 41: South Asia and Pacific Market Value (US$ Million) Forecast by Country, 2019 to 2034

Table 42: South Asia and Pacific Market Volume (Units) Forecast by Country, 2019 to 2034

Table 43: South Asia and Pacific Market Value (US$ Million) Forecast by Technology, 2019 to 2034

Table 44: South Asia and Pacific Market Volume (Units) Forecast by Technology, 2019 to 2034

Table 45: South Asia and Pacific Market Value (US$ Million) Forecast by Materials, 2019 to 2034

Table 46: South Asia and Pacific Market Volume (Units) Forecast by Materials, 2019 to 2034

Table 47: South Asia and Pacific Market Value (US$ Million) Forecast by End-User, 2019 to 2034

Table 48: South Asia and Pacific Market Volume (Units) Forecast by End-User, 2019 to 2034

Table 49: East Asia Market Value (US$ Million) Forecast by Country, 2019 to 2034

Table 50: East Asia Market Volume (Units) Forecast by Country, 2019 to 2034

Table 51: East Asia Market Value (US$ Million) Forecast by Technology, 2019 to 2034

Table 52: East Asia Market Volume (Units) Forecast by Technology, 2019 to 2034

Table 53: East Asia Market Value (US$ Million) Forecast by Materials, 2019 to 2034

Table 54: East Asia Market Volume (Units) Forecast by Materials, 2019 to 2034

Table 55: East Asia Market Value (US$ Million) Forecast by End-User, 2019 to 2034

Table 56: East Asia Market Volume (Units) Forecast by End-User, 2019 to 2034

Table 57: Middle East and Africa Market Value (US$ Million) Forecast by Country, 2019 to 2034

Table 58: Middle East and Africa Market Volume (Units) Forecast by Country, 2019 to 2034

Table 59: Middle East and Africa Market Value (US$ Million) Forecast by Technology, 2019 to 2034

Table 60: Middle East and Africa Market Volume (Units) Forecast by Technology, 2019 to 2034

Table 61: Middle East and Africa Market Value (US$ Million) Forecast by Materials, 2019 to 2034

Table 62: Middle East and Africa Market Volume (Units) Forecast by Materials, 2019 to 2034

Table 63: Middle East and Africa Market Value (US$ Million) Forecast by End-User, 2019 to 2034

Table 64: Middle East and Africa Market Volume (Units) Forecast by End-User, 2019 to 2034

List of Figures

Figure 1: Global Market Value (US$ Million) by Technology, 2024 to 2034

Figure 2: Global Market Value (US$ Million) by Materials, 2024 to 2034

Figure 3: Global Market Value (US$ Million) by End-User, 2024 to 2034

Figure 4: Global Market Value (US$ Million) by Region, 2024 to 2034

Figure 5: Global Market Value (US$ Million) Analysis by Region, 2019 to 2034

Figure 6: Global Market Volume (Units) Analysis by Region, 2019 to 2034

Figure 7: Global Market Value Share (%) and BPS Analysis by Region, 2024 to 2034

Figure 8: Global Market Y-o-Y Growth (%) Projections by Region, 2024 to 2034

Figure 9: Global Market Value (US$ Million) Analysis by Technology, 2019 to 2034

Figure 10: Global Market Volume (Units) Analysis by Technology, 2019 to 2034

Figure 11: Global Market Value Share (%) and BPS Analysis by Technology, 2024 to 2034

Figure 12: Global Market Y-o-Y Growth (%) Projections by Technology, 2024 to 2034

Figure 13: Global Market Value (US$ Million) Analysis by Materials, 2019 to 2034

Figure 14: Global Market Volume (Units) Analysis by Materials, 2019 to 2034

Figure 15: Global Market Value Share (%) and BPS Analysis by Materials, 2024 to 2034

Figure 16: Global Market Y-o-Y Growth (%) Projections by Materials, 2024 to 2034

Figure 17: Global Market Value (US$ Million) Analysis by End-User, 2019 to 2034

Figure 18: Global Market Volume (Units) Analysis by End-User, 2019 to 2034

Figure 19: Global Market Value Share (%) and BPS Analysis by End-User, 2024 to 2034

Figure 20: Global Market Y-o-Y Growth (%) Projections by End-User, 2024 to 2034

Figure 21: Global Market Attractiveness by Technology, 2024 to 2034

Figure 22: Global Market Attractiveness by Materials, 2024 to 2034

Figure 23: Global Market Attractiveness by End-User, 2024 to 2034

Figure 24: Global Market Attractiveness by Region, 2024 to 2034

Figure 25: North America Market Value (US$ Million) by Technology, 2024 to 2034

Figure 26: North America Market Value (US$ Million) by Materials, 2024 to 2034

Figure 27: North America Market Value (US$ Million) by End-User, 2024 to 2034

Figure 28: North America Market Value (US$ Million) by Country, 2024 to 2034

Figure 29: North America Market Value (US$ Million) Analysis by Country, 2019 to 2034

Figure 30: North America Market Volume (Units) Analysis by Country, 2019 to 2034

Figure 31: North America Market Value Share (%) and BPS Analysis by Country, 2024 to 2034

Figure 32: North America Market Y-o-Y Growth (%) Projections by Country, 2024 to 2034

Figure 33: North America Market Value (US$ Million) Analysis by Technology, 2019 to 2034

Figure 34: North America Market Volume (Units) Analysis by Technology, 2019 to 2034

Figure 35: North America Market Value Share (%) and BPS Analysis by Technology, 2024 to 2034

Figure 36: North America Market Y-o-Y Growth (%) Projections by Technology, 2024 to 2034

Figure 37: North America Market Value (US$ Million) Analysis by Materials, 2019 to 2034

Figure 38: North America Market Volume (Units) Analysis by Materials, 2019 to 2034

Figure 39: North America Market Value Share (%) and BPS Analysis by Materials, 2024 to 2034

Figure 40: North America Market Y-o-Y Growth (%) Projections by Materials, 2024 to 2034

Figure 41: North America Market Value (US$ Million) Analysis by End-User, 2019 to 2034

Figure 42: North America Market Volume (Units) Analysis by End-User, 2019 to 2034

Figure 43: North America Market Value Share (%) and BPS Analysis by End-User, 2024 to 2034

Figure 44: North America Market Y-o-Y Growth (%) Projections by End-User, 2024 to 2034

Figure 45: North America Market Attractiveness by Technology, 2024 to 2034

Figure 46: North America Market Attractiveness by Materials, 2024 to 2034

Figure 47: North America Market Attractiveness by End-User, 2024 to 2034

Figure 48: North America Market Attractiveness by Country, 2024 to 2034

Figure 49: Latin America Market Value (US$ Million) by Technology, 2024 to 2034

Figure 50: Latin America Market Value (US$ Million) by Materials, 2024 to 2034

Figure 51: Latin America Market Value (US$ Million) by End-User, 2024 to 2034

Figure 52: Latin America Market Value (US$ Million) by Country, 2024 to 2034

Figure 53: Latin America Market Value (US$ Million) Analysis by Country, 2019 to 2034

Figure 54: Latin America Market Volume (Units) Analysis by Country, 2019 to 2034

Figure 55: Latin America Market Value Share (%) and BPS Analysis by Country, 2024 to 2034

Figure 56: Latin America Market Y-o-Y Growth (%) Projections by Country, 2024 to 2034

Figure 57: Latin America Market Value (US$ Million) Analysis by Technology, 2019 to 2034

Figure 58: Latin America Market Volume (Units) Analysis by Technology, 2019 to 2034

Figure 59: Latin America Market Value Share (%) and BPS Analysis by Technology, 2024 to 2034

Figure 60: Latin America Market Y-o-Y Growth (%) Projections by Technology, 2024 to 2034

Figure 61: Latin America Market Value (US$ Million) Analysis by Materials, 2019 to 2034

Figure 62: Latin America Market Volume (Units) Analysis by Materials, 2019 to 2034

Figure 63: Latin America Market Value Share (%) and BPS Analysis by Materials, 2024 to 2034

Figure 64: Latin America Market Y-o-Y Growth (%) Projections by Materials, 2024 to 2034

Figure 65: Latin America Market Value (US$ Million) Analysis by End-User, 2019 to 2034

Figure 66: Latin America Market Volume (Units) Analysis by End-User, 2019 to 2034

Figure 67: Latin America Market Value Share (%) and BPS Analysis by End-User, 2024 to 2034

Figure 68: Latin America Market Y-o-Y Growth (%) Projections by End-User, 2024 to 2034

Figure 69: Latin America Market Attractiveness by Technology, 2024 to 2034

Figure 70: Latin America Market Attractiveness by Materials, 2024 to 2034

Figure 71: Latin America Market Attractiveness by End-User, 2024 to 2034

Figure 72: Latin America Market Attractiveness by Country, 2024 to 2034

Figure 73: Western Europe Market Value (US$ Million) by Technology, 2024 to 2034

Figure 74: Western Europe Market Value (US$ Million) by Materials, 2024 to 2034

Figure 75: Western Europe Market Value (US$ Million) by End-User, 2024 to 2034

Figure 76: Western Europe Market Value (US$ Million) by Country, 2024 to 2034

Figure 77: Western Europe Market Value (US$ Million) Analysis by Country, 2019 to 2034

Figure 78: Western Europe Market Volume (Units) Analysis by Country, 2019 to 2034

Figure 79: Western Europe Market Value Share (%) and BPS Analysis by Country, 2024 to 2034

Figure 80: Western Europe Market Y-o-Y Growth (%) Projections by Country, 2024 to 2034

Figure 81: Western Europe Market Value (US$ Million) Analysis by Technology, 2019 to 2034

Figure 82: Western Europe Market Volume (Units) Analysis by Technology, 2019 to 2034

Figure 83: Western Europe Market Value Share (%) and BPS Analysis by Technology, 2024 to 2034

Figure 84: Western Europe Market Y-o-Y Growth (%) Projections by Technology, 2024 to 2034

Figure 85: Western Europe Market Value (US$ Million) Analysis by Materials, 2019 to 2034

Figure 86: Western Europe Market Volume (Units) Analysis by Materials, 2019 to 2034

Figure 87: Western Europe Market Value Share (%) and BPS Analysis by Materials, 2024 to 2034

Figure 88: Western Europe Market Y-o-Y Growth (%) Projections by Materials, 2024 to 2034

Figure 89: Western Europe Market Value (US$ Million) Analysis by End-User, 2019 to 2034

Figure 90: Western Europe Market Volume (Units) Analysis by End-User, 2019 to 2034

Figure 91: Western Europe Market Value Share (%) and BPS Analysis by End-User, 2024 to 2034

Figure 92: Western Europe Market Y-o-Y Growth (%) Projections by End-User, 2024 to 2034

Figure 93: Western Europe Market Attractiveness by Technology, 2024 to 2034

Figure 94: Western Europe Market Attractiveness by Materials, 2024 to 2034

Figure 95: Western Europe Market Attractiveness by End-User, 2024 to 2034

Figure 96: Western Europe Market Attractiveness by Country, 2024 to 2034

Figure 97: Eastern Europe Market Value (US$ Million) by Technology, 2024 to 2034

Figure 98: Eastern Europe Market Value (US$ Million) by Materials, 2024 to 2034

Figure 99: Eastern Europe Market Value (US$ Million) by End-User, 2024 to 2034

Figure 100: Eastern Europe Market Value (US$ Million) by Country, 2024 to 2034

Figure 101: Eastern Europe Market Value (US$ Million) Analysis by Country, 2019 to 2034

Figure 102: Eastern Europe Market Volume (Units) Analysis by Country, 2019 to 2034

Figure 103: Eastern Europe Market Value Share (%) and BPS Analysis by Country, 2024 to 2034

Figure 104: Eastern Europe Market Y-o-Y Growth (%) Projections by Country, 2024 to 2034

Figure 105: Eastern Europe Market Value (US$ Million) Analysis by Technology, 2019 to 2034

Figure 106: Eastern Europe Market Volume (Units) Analysis by Technology, 2019 to 2034

Figure 107: Eastern Europe Market Value Share (%) and BPS Analysis by Technology, 2024 to 2034

Figure 108: Eastern Europe Market Y-o-Y Growth (%) Projections by Technology, 2024 to 2034

Figure 109: Eastern Europe Market Value (US$ Million) Analysis by Materials, 2019 to 2034

Figure 110: Eastern Europe Market Volume (Units) Analysis by Materials, 2019 to 2034

Figure 111: Eastern Europe Market Value Share (%) and BPS Analysis by Materials, 2024 to 2034

Figure 112: Eastern Europe Market Y-o-Y Growth (%) Projections by Materials, 2024 to 2034

Figure 113: Eastern Europe Market Value (US$ Million) Analysis by End-User, 2019 to 2034

Figure 114: Eastern Europe Market Volume (Units) Analysis by End-User, 2019 to 2034

Figure 115: Eastern Europe Market Value Share (%) and BPS Analysis by End-User, 2024 to 2034

Figure 116: Eastern Europe Market Y-o-Y Growth (%) Projections by End-User, 2024 to 2034

Figure 117: Eastern Europe Market Attractiveness by Technology, 2024 to 2034

Figure 118: Eastern Europe Market Attractiveness by Materials, 2024 to 2034

Figure 119: Eastern Europe Market Attractiveness by End-User, 2024 to 2034

Figure 120: Eastern Europe Market Attractiveness by Country, 2024 to 2034

Figure 121: South Asia and Pacific Market Value (US$ Million) by Technology, 2024 to 2034

Figure 122: South Asia and Pacific Market Value (US$ Million) by Materials, 2024 to 2034

Figure 123: South Asia and Pacific Market Value (US$ Million) by End-User, 2024 to 2034

Figure 124: South Asia and Pacific Market Value (US$ Million) by Country, 2024 to 2034

Figure 125: South Asia and Pacific Market Value (US$ Million) Analysis by Country, 2019 to 2034

Figure 126: South Asia and Pacific Market Volume (Units) Analysis by Country, 2019 to 2034

Figure 127: South Asia and Pacific Market Value Share (%) and BPS Analysis by Country, 2024 to 2034

Figure 128: South Asia and Pacific Market Y-o-Y Growth (%) Projections by Country, 2024 to 2034

Figure 129: South Asia and Pacific Market Value (US$ Million) Analysis by Technology, 2019 to 2034

Figure 130: South Asia and Pacific Market Volume (Units) Analysis by Technology, 2019 to 2034

Figure 131: South Asia and Pacific Market Value Share (%) and BPS Analysis by Technology, 2024 to 2034

Figure 132: South Asia and Pacific Market Y-o-Y Growth (%) Projections by Technology, 2024 to 2034

Figure 133: South Asia and Pacific Market Value (US$ Million) Analysis by Materials, 2019 to 2034

Figure 134: South Asia and Pacific Market Volume (Units) Analysis by Materials, 2019 to 2034

Figure 135: South Asia and Pacific Market Value Share (%) and BPS Analysis by Materials, 2024 to 2034

Figure 136: South Asia and Pacific Market Y-o-Y Growth (%) Projections by Materials, 2024 to 2034

Figure 137: South Asia and Pacific Market Value (US$ Million) Analysis by End-User, 2019 to 2034

Figure 138: South Asia and Pacific Market Volume (Units) Analysis by End-User, 2019 to 2034

Figure 139: South Asia and Pacific Market Value Share (%) and BPS Analysis by End-User, 2024 to 2034

Figure 140: South Asia and Pacific Market Y-o-Y Growth (%) Projections by End-User, 2024 to 2034

Figure 141: South Asia and Pacific Market Attractiveness by Technology, 2024 to 2034

Figure 142: South Asia and Pacific Market Attractiveness by Materials, 2024 to 2034

Figure 143: South Asia and Pacific Market Attractiveness by End-User, 2024 to 2034

Figure 144: South Asia and Pacific Market Attractiveness by Country, 2024 to 2034

Figure 145: East Asia Market Value (US$ Million) by Technology, 2024 to 2034

Figure 146: East Asia Market Value (US$ Million) by Materials, 2024 to 2034

Figure 147: East Asia Market Value (US$ Million) by End-User, 2024 to 2034

Figure 148: East Asia Market Value (US$ Million) by Country, 2024 to 2034

Figure 149: East Asia Market Value (US$ Million) Analysis by Country, 2019 to 2034

Figure 150: East Asia Market Volume (Units) Analysis by Country, 2019 to 2034

Figure 151: East Asia Market Value Share (%) and BPS Analysis by Country, 2024 to 2034

Figure 152: East Asia Market Y-o-Y Growth (%) Projections by Country, 2024 to 2034

Figure 153: East Asia Market Value (US$ Million) Analysis by Technology, 2019 to 2034

Figure 154: East Asia Market Volume (Units) Analysis by Technology, 2019 to 2034

Figure 155: East Asia Market Value Share (%) and BPS Analysis by Technology, 2024 to 2034

Figure 156: East Asia Market Y-o-Y Growth (%) Projections by Technology, 2024 to 2034

Figure 157: East Asia Market Value (US$ Million) Analysis by Materials, 2019 to 2034

Figure 158: East Asia Market Volume (Units) Analysis by Materials, 2019 to 2034

Figure 159: East Asia Market Value Share (%) and BPS Analysis by Materials, 2024 to 2034

Figure 160: East Asia Market Y-o-Y Growth (%) Projections by Materials, 2024 to 2034

Figure 161: East Asia Market Value (US$ Million) Analysis by End-User, 2019 to 2034

Figure 162: East Asia Market Volume (Units) Analysis by End-User, 2019 to 2034

Figure 163: East Asia Market Value Share (%) and BPS Analysis by End-User, 2024 to 2034

Figure 164: East Asia Market Y-o-Y Growth (%) Projections by End-User, 2024 to 2034

Figure 165: East Asia Market Attractiveness by Technology, 2024 to 2034

Figure 166: East Asia Market Attractiveness by Materials, 2024 to 2034

Figure 167: East Asia Market Attractiveness by End-User, 2024 to 2034

Figure 168: East Asia Market Attractiveness by Country, 2024 to 2034

Figure 169: Middle East and Africa Market Value (US$ Million) by Technology, 2024 to 2034

Figure 170: Middle East and Africa Market Value (US$ Million) by Materials, 2024 to 2034

Figure 171: Middle East and Africa Market Value (US$ Million) by End-User, 2024 to 2034

Figure 172: Middle East and Africa Market Value (US$ Million) by Country, 2024 to 2034

Figure 173: Middle East and Africa Market Value (US$ Million) Analysis by Country, 2019 to 2034

Figure 174: Middle East and Africa Market Volume (Units) Analysis by Country, 2019 to 2034

Figure 175: Middle East and Africa Market Value Share (%) and BPS Analysis by Country, 2024 to 2034

Figure 176: Middle East and Africa Market Y-o-Y Growth (%) Projections by Country, 2024 to 2034

Figure 177: Middle East and Africa Market Value (US$ Million) Analysis by Technology, 2019 to 2034

Figure 178: Middle East and Africa Market Volume (Units) Analysis by Technology, 2019 to 2034

Figure 179: Middle East and Africa Market Value Share (%) and BPS Analysis by Technology, 2024 to 2034

Figure 180: Middle East and Africa Market Y-o-Y Growth (%) Projections by Technology, 2024 to 2034

Figure 181: Middle East and Africa Market Value (US$ Million) Analysis by Materials, 2019 to 2034

Figure 182: Middle East and Africa Market Volume (Units) Analysis by Materials, 2019 to 2034

Figure 183: Middle East and Africa Market Value Share (%) and BPS Analysis by Materials, 2024 to 2034

Figure 184: Middle East and Africa Market Y-o-Y Growth (%) Projections by Materials, 2024 to 2034

Figure 185: Middle East and Africa Market Value (US$ Million) Analysis by End-User, 2019 to 2034

Figure 186: Middle East and Africa Market Volume (Units) Analysis by End-User, 2019 to 2034

Figure 187: Middle East and Africa Market Value Share (%) and BPS Analysis by End-User, 2024 to 2034

Figure 188: Middle East and Africa Market Y-o-Y Growth (%) Projections by End-User, 2024 to 2034

Figure 189: Middle East and Africa Market Attractiveness by Technology, 2024 to 2034

Figure 190: Middle East and Africa Market Attractiveness by Materials, 2024 to 2034

Figure 191: Middle East and Africa Market Attractiveness by End-User, 2024 to 2034

Figure 192: Middle East and Africa Market Attractiveness by Country, 2024 to 2034

Frequently Asked Questions

How Big is the Inventory Tag Market in 2024?

The inventory tag market is expected to be valued at USD 5.7 billion in 2024.

What is China’s Market Outlook?

The market in China is expected to progress at a CAGR of 4.2% over the forecast period.

Which Technology Segment Contributes More to the Inventory Tag Market?

The RFID segment is expected to register a CAGR of 4.6% from 2024 to 2034.

What is the United States Market Outlook?

The United States market is projected to rise at a 5.0% CAGR from 2024 to 2034.

What is the Projected Market Value by 2034?

The market is set to reach a valuation of around USD 9.1 billion by 2034.

What was the Historical CAGR for the Market?

The demand for inventory tags increased at a 6.5% CAGR from 2019 to 2023.

Explore Digital Transformation Insights

Future Market Insights

Inventory Tag Market