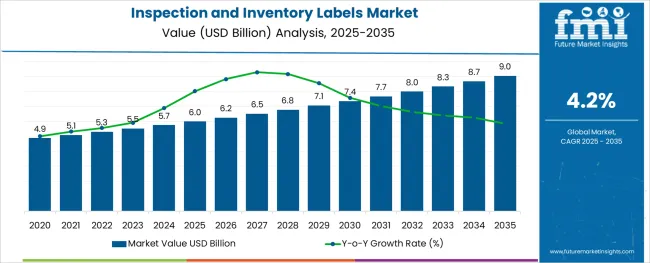
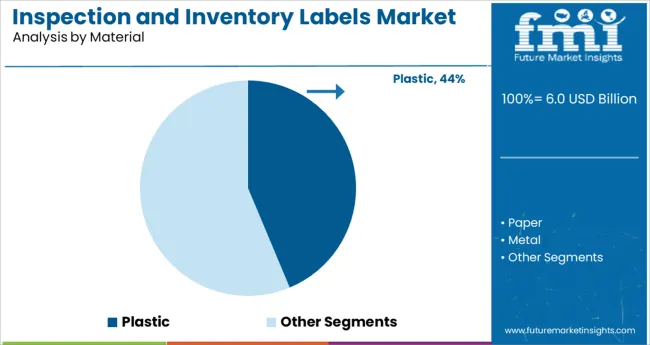
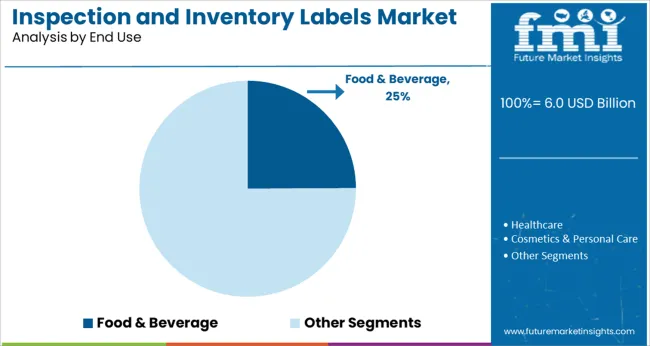
The inspection and inventory labels market is likely to record a moderate CAGR of 4.2% during the forecast period. The market is currently valued at USD 5.29 Billion and is likely to reach USD 7.81 Billion by 2032. The Inspection and inventory labels market is anticipated to show promising growth prospects during the forecast period.
Attributes | Details |
---|---|
Inspection and Inventory Labels Market CAGR (2022 to 2032) | 4.2% |
Market Value (2022) | USD 5.29 Billion |
Market Value (2032) | USD 7.81 Billion |
Inspection and inventory labels are used to optimize the supply chain and strengthen the segmentation of goods and products, helping the shipment organize these goods in an organized manner.
This helps in identifying the right package and scanning it through the tracking devices. Another merit that drives the demand for inspection and inventory labels more is its no sticky residues and organized stacking.
The sales of inspection and inventory labels have increased drastically as it is largely in demand as a labelling solution for warehousing, inventorying and shipment of multiple goods and products.
Demand for inspection and inventory labels increases with the increasing e-commerce businesses around the globe, pushing the platform to optimize its distribution chains. This ultimately increases the sales of inspection and inventory labels.
Inspection and inventory labels help in eliminating errors that often occur during manual inventory tracking. Inspection and inventory labels improve the productivity and efficiency of employees as they can easily locate products and shelves to prepare shipments.
These factors are expected to drive the growth of the global inspection and inventory labels market during the forecast period. The common types of Inspection and inventory labels are rack labels, retro-reflective labels. Inspection and inventory labels are used to streamline the workflow by making products easier to identify. It helps in identifying desired products for proper inventory management.
Also, inspection and inventory labels are colour-coded for proper identification of products. These factors are expected to drive the sales of inspection and inventory labels globally during the next decade. Besides, inspection and inventory labels are designed to withstand harsh oil, solvents and other chemicals during shipping and logistics.
Overall, the market is expected to witness high growth prospects during the next decade as demand for inspection and inventory labels keeps on increasing.
The Asian region is expected to dominate the inspection and inventory labels market during the forecast period. It is attributed to the growth in the logistics and warehousing sector, especially in India and China.
Here, there is a lack of automation in the inspection and inventory management in logistics and warehousing. This factor is expected to create immense opportunities for the growth of the inspection and inventory labels market during the forecast period, increasing the demand for inspection and inventory labels.
The USA is expected to be one of the leading markets for the inspection and inventory labels market. This is due to the high adoption of automation in the region. Similar trends are followed by European countries such as the UK, Germany and Italy, among others.
The inspection and inventory labels market is expected to witness high growth prospects during the next decade. This pushes the overall demand for inspection and inventory labels.
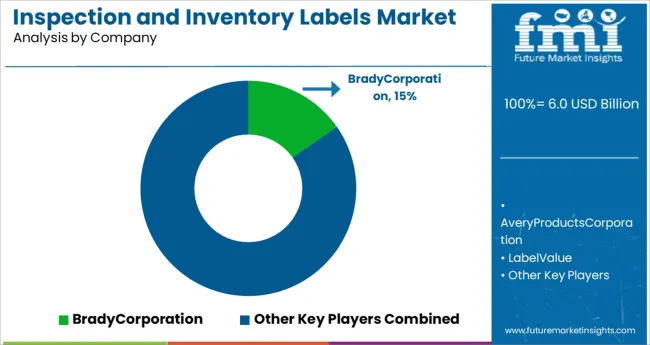
The key players in the Inspection and inventory labels market are focusing on enhancing the compact design that fits with all the products and goods and non-sticky qualities. This is driving the sales of Inspection and inventory labels.
Key players in the inspection and inventory labels market include Labelmaster, FSI Label, TOSHIBA Global Commerce Solutions Inc, Coast Label Company, Label Specialities Inc and The Label Printers LP.
Recent Market Development:
Report Attribute | Details |
---|---|
Growth Rate | CAGR of 4.2% from 2022 to 2032 |
Base year for estimation | 2021 |
Historical data | 2015 to 2020 |
Forecast period | 2022 to 2032 |
Quantitative units | Revenue in USD Million and CAGR from 2022 to 2032 |
Report coverage | Revenue forecast, volume forecast, company ranking, competitive landscape, growth factors, and trends, Pricing Analysis, |
Segments covered | Width, Product Type, End Use, Region |
Regional scope | North America; Western Europe; Eastern Europe; Middle East; Africa; ASEAN; South Asia; Rest of Asia; Australia and New Zealand |
Country scope | USA, Canada, Mexico, Germany, UK, France, Italy, Spain, Russia, Belgium, Poland, Czech Republic, China, India, Japan, Australia, Brazil, Argentina, Colombia, Saudi Arabia, UAE, Iran, South Africa |
Key companies profiled | Labelmaster; FSI Label; TOSHIBA Global Commerce Solutions Inc; Coast Label Company; Label Specialities Inc; The Label Printers LP |
Customization scope | Free report customization (equivalent to up to 8 analysts' working days) with purchase. Addition or alteration to country, regional & segment scope. |
Pricing and purchase options | Avail customized purchase options to meet your exact research needs. |
Table 01: Global Inspection and Inventory Labels Market Value (US$ Mn) Forecast by Region, 2015-2032
Table 02: Global Inspection and Inventory Labels Market Volume (Sq. Mt.) Forecast by Region, 2015-2032
Table 03: Global Inspection and Inventory Labels Market Value (US$ Mn) Forecast by Material, 2015-2032
Table 04: Global Inspection and Inventory Labels Market Volume (Sq. Mt.) Forecast by Material, 2015-2032
Table 05: Global Inspection and Inventory Labels Market Value (US$ Mn) Forecast by Product Type, 2015-2032
Table 06: Global Inspection and Inventory Labels Market Volume (Sq. Mt.) Forecast by Product Type, 2015-2032
Table 07: Global Inspection and Inventory Labels Market Value (US$ Mn) Forecast by End Use, 2015-2032
Table 08: Global Inspection and Inventory Labels Market Volume (Sq. Mt.) Forecast by End Use, 2015-2032
Table 09: North America Inspection and Inventory Labels Market Value (US$ Mn) Forecast by Country, 2015-2032
Table 10: North America Inspection and Inventory Labels Market Volume (Sq. Mt.) Forecast by Country, 2015-2032
Table 11: North America Inspection and Inventory Labels Market Value (US$ Mn) Forecast by Material, 2015-2032
Table 12: North America Inspection and Inventory Labels Market Volume (Sq. Mt.) Forecast by Material, 2015-2032
Table 13: North America Inspection and Inventory Labels Market Value (US$ Mn) Forecast by Product Type, 2015-2032
Table 14: North America Inspection and Inventory Labels Market Volume (Sq. Mt.) Forecast by Product Type, 2015-2032
Table 15: North America Inspection and Inventory Labels Market Value (US$ Mn) Forecast by End Use, 2015-2032
Table 16: North America Inspection and Inventory Labels Market Volume (Sq. Mt.) Forecast by End Use, 2015-2032
Table 17: Latin America Inspection and Inventory Labels Market Value (US$ Mn) Forecast by Country, 2015-2032
Table 18: Latin America Inspection and Inventory Labels Market Volume (Sq. Mt.) Forecast by Country, 2015-2032
Table 19: Latin America Inspection and Inventory Labels Market Value (US$ Mn) Forecast by Material, 2015-2032
Table 20: Latin America Inspection and Inventory Labels Market Volume (Sq. Mt.) Forecast by Material, 2015-2032
Table 21: Latin America Inspection and Inventory Labels Market Value (US$ Mn) Forecast by Product Type, 2015-2032
Table 22: Latin America Inspection and Inventory Labels Market Volume (Sq. Mt.) Forecast by Product Type, 2015-2032
Table 23: Latin America Inspection and Inventory Labels Market Value (US$ Mn) Forecast by End Use, 2015-2032
Table 24: Latin America Inspection and Inventory Labels Market Volume (Sq. Mt.) Forecast by End Use, 2015-2032
Table 25: Europe Inspection and Inventory Labels Market Value (US$ Mn) Forecast by Country, 2015-2032
Table 26: Europe Inspection and Inventory Labels Market Volume (Sq. Mt.) Forecast by Country, 2015-2032
Table 27: Europe Inspection and Inventory Labels Market Value (US$ Mn) Forecast by Material, 2015-2032
Table 28: Europe Inspection and Inventory Labels Market Volume (Sq. Mt.) Forecast by Material, 2015-2032
Table 29: Europe Inspection and Inventory Labels Market Value (US$ Mn) Forecast by Product Type, 2015-2032
Table 30: Europe Inspection and Inventory Labels Market Volume (Sq. Mt.) Forecast by Product Type, 2015-2032
Table 31: Europe Inspection and Inventory Labels Market Value (US$ Mn) Forecast by End Use, 2015-2032
Table 32: Europe Inspection and Inventory Labels Market Volume (Sq. Mt.) Forecast by End Use, 2015-2032
Table 33: East Asia Inspection and Inventory Labels Market Value (US$ Mn) Forecast by Country, 2015-2032
Table 34: East Asia Inspection and Inventory Labels Market Volume (Sq. Mt.) Forecast by Country, 2015-2032
Table 35: East Asia Inspection and Inventory Labels Market Value (US$ Mn) Forecast by Material, 2015-2032
Table 36: East Asia Inspection and Inventory Labels Market Volume (Sq. Mt.) Forecast by Material, 2015-2032
Table 37: East Asia Inspection and Inventory Labels Market Value (US$ Mn) Forecast by Product Type, 2015-2032
Table 38: East Asia Inspection and Inventory Labels Market Volume (Sq. Mt.) Forecast by Product Type, 2015-2032
Table 39: East Asia Inspection and Inventory Labels Market Value (US$ Mn) Forecast by End Use, 2015-2032
Table 40: East Asia Inspection and Inventory Labels Market Volume (Sq. Mt.) Forecast by End Use, 2015-2032
Table 41: South Asia Inspection and Inventory Labels Market Value (US$ Mn) Forecast by Country, 2015-2032
Table 42: South Asia Inspection and Inventory Labels Market Volume (Sq. Mt.) Forecast by Country, 2015-2032
Table 43: South Asia Inspection and Inventory Labels Market Value (US$ Mn) Forecast by Material, 2015-2032
Table 44: South Asia Inspection and Inventory Labels Market Volume (Sq. Mt.) Forecast by Material, 2015-2032
Table 45: South Asia Inspection and Inventory Labels Market Value (US$ Mn) Forecast by Product Type, 2015-2032
Table 46: South Asia Inspection and Inventory Labels Market Volume (Sq. Mt.) Forecast by Product Type, 2015-2032
Table 47: South Asia Inspection and Inventory Labels Market Value (US$ Mn) Forecast by End Use, 2015-2032
Table 48: South Asia Inspection and Inventory Labels Market Volume (Sq. Mt.) Forecast by End Use, 2015-2032
Table 49: Oceania Inspection and Inventory Labels Market Value (US$ Mn) Forecast by Country, 2015-2032
Table 50: Oceania Inspection and Inventory Labels Market Volume (Sq. Mt.) Forecast by Country, 2015-2032
Table 51: Oceania Inspection and Inventory Labels Market Value (US$ Mn) Forecast by Material, 2015-2032
Table 52: Oceania Inspection and Inventory Labels Market Volume (Sq. Mt.) Forecast by Material, 2015-2032
Table 53: Oceania Inspection and Inventory Labels Market Value (US$ Mn) Forecast by Product Type, 2015-2032
Table 54: Oceania Inspection and Inventory Labels Market Volume (Sq. Mt.) Forecast by Product Type, 2015-2032
Table 55: Oceania Inspection and Inventory Labels Market Value (US$ Mn) Forecast by End Use, 2015-2032
Table 56: Oceania Inspection and Inventory Labels Market Volume (Sq. Mt.) Forecast by End Use, 2015-2032
Table 57: MEA Inspection and Inventory Labels Market Value (US$ Mn) Forecast by Country, 2015-2032
Table 58: MEA Inspection and Inventory Labels Market Volume (Sq. Mt.) Forecast by Country, 2015-2032
Table 59: MEA Inspection and Inventory Labels Market Value (US$ Mn) Forecast by Material, 2015-2032
Table 60: MEA Inspection and Inventory Labels Market Volume (Sq. Mt.) Forecast by Material, 2015-2032
Table 61: MEA Inspection and Inventory Labels Market Value (US$ Mn) Forecast by Product Type, 2015-2032
Table 62: MEA Inspection and Inventory Labels Market Volume (Sq. Mt.) Forecast by Product Type, 2015-2032
Table 63: MEA Inspection and Inventory Labels Market Value (US$ Mn) Forecast by End Use, 2015-2032
Table 64: MEA Inspection and Inventory Labels Market Volume (Sq. Mt.) Forecast by End Use, 2015-2032
Table 65: U.S. Inspection and Inventory Labels Market Value (US$ Mn) Forecast by Material, Product Type, and End Use (2022(E) & 2032(F))
Table 66: Canada Inspection and Inventory Labels Market Value (US$ Mn) Forecast by Material, Product Type, and End Use (2022(E) & 2032(F))
Table 67: Brazil Inspection and Inventory Labels Market Value (US$ Mn) Forecast by Material, Product Type, and End Use (2022(E) & 2032(F))
Table 68: Mexico Inspection and Inventory Labels Market Value (US$ Mn) Forecast by Material, Product Type, and End Use (2022(E) & 2032(F))
Table 69: Germany Inspection and Inventory Labels Market Value (US$ Mn) Forecast by Material, Product Type, and End Use (2022(E) & 2032(F))
Table 70: Italy Inspection and Inventory Labels Market Value (US$ Mn) Forecast by Material, Product Type, and End Use (2022(E) & 2032(F))
Table 71: France Inspection and Inventory Labels Market Value (US$ Mn) Forecast by Material, Product Type, and End Use (2022(E) & 2032(F))
Table 72: Spain Inspection and Inventory Labels Market Value (US$ Mn) Forecast by Material, Product Type, and End Use (2022(E) & 2032(F))
Table 73: U.K. Inspection and Inventory Labels Market Value (US$ Mn) Forecast by Material, Product Type, and End Use (2022(E) & 2032(F))
Table 74: Russia Inspection and Inventory Labels Market Value (US$ Mn) Forecast by Material, Product Type, and End Use (2022(E) & 2032(F))
Table 75: China Inspection and Inventory Labels Market Value (US$ Mn) Forecast by Material, Product Type, and End Use (2022(E) & 2032(F))
Table 76: Japan Inspection and Inventory Labels Market Value (US$ Mn) Forecast by Material, Product Type, and End Use (2022(E) & 2032(F))
Table 77: India Inspection and Inventory Labels Market Value (US$ Mn) Forecast by Material, Product Type, and End Use (2022(E) & 2032(F))
Table 78: GCC Countries Inspection and Inventory Labels Market Value (US$ Mn) Forecast by Material, Product Type, and End Use (2022(E) & 2032(F))
Table 79: Australia Inspection and Inventory Labels Market Value (US$ Mn) Forecast by Material, Product Type, and End Use (2022(E) & 2032(F))
Figure 01: Global Inspection and Inventory Labels Market Value (US$ Mn) by Material, 2022-2032
Figure 02: Global Inspection and Inventory Labels Market Value (US$ Mn) by Product Type, 2022-2032
Figure 03: Global Inspection and Inventory Labels Market Value (US$ Mn) by End Use, 2022-2032
Figure 04: Global Inspection and Inventory Labels Market Value (US$ Mn) by Region, 2022-2032
Figure 05: Global Inspection and Inventory Labels Market Value (US$ Mn) Analysis by Region, 2015-2021
Figure 06: Global Inspection and Inventory Labels Market Volume (Sq. Mt.) Analysis by Region, 2015-2032
Figure 07: Global Inspection and Inventory Labels Market Value Share (%) and BPS Analysis by Region, 2022 & 2032
Figure 08: Global Inspection and Inventory Labels Market Y-o-Y Growth (%) Projections by Region, 2022-2032
Figure 09: Global Inspection and Inventory Labels Market Value (US$ Mn) Analysis by Material, 2015-2021
Figure 10: Global Inspection and Inventory Labels Market Volume (Sq. Mt.) Analysis by Material, 2015-2032
Figure 11: Global Inspection and Inventory Labels Market Value Share (%) and BPS Analysis by Material, 2022 & 2032
Figure 12: Global Inspection and Inventory Labels Market Y-o-Y Growth (%) Projections by Material, 2022-2032
Figure 13: Global Inspection and Inventory Labels Market Value (US$ Mn) Analysis by Product Type, 2015-2021
Figure 14: Global Inspection and Inventory Labels Market Volume (Sq. Mt.) Analysis by Product Type, 2015-2032
Figure 15: Global Inspection and Inventory Labels Market Value Share (%) and BPS Analysis by Product Type, 2022 & 2032
Figure 16: Global Inspection and Inventory Labels Market Y-o-Y Growth (%) Projections by Product Type, 2022-2032
Figure 17: Global Inspection and Inventory Labels Market Value (US$ Mn) Analysis by End Use, 2015-2021
Figure 18: Global Inspection and Inventory Labels Market Volume (Sq. Mt.) Analysis by End Use, 2015-2032
Figure 19: Global Inspection and Inventory Labels Market Value Share (%) and BPS Analysis by End Use, 2022 & 2032
Figure 20: Global Inspection and Inventory Labels Market Y-o-Y Growth (%) Projections by End Use, 2022-2032
Figure 21: Global Inspection and Inventory Labels Market Attractiveness by Material, 2022-2032
Figure 22: Global Inspection and Inventory Labels Market Attractiveness by Product Type, 2022-2032
Figure 23: Global Inspection and Inventory Labels Market Attractiveness by End Use, 2022-2032
Figure 24: Global Inspection and Inventory Labels Market Attractiveness by End Use, 2022-2032
Figure 25: Global Inspection and Inventory Labels Market Attractiveness by Region, 2022-2032
Figure 26: North America Inspection and Inventory Labels Market Value (US$ Mn) by Material, 2022-2032
Figure 27: North America Inspection and Inventory Labels Market Value (US$ Mn) by Product Type, 2022-2032
Figure 28: North America Inspection and Inventory Labels Market Value (US$ Mn) by End Use, 2022-2032
Figure 29: North America Inspection and Inventory Labels Market Value (US$ Mn) by Country, 2022-2032
Figure 30: North America Inspection and Inventory Labels Market Value (US$ Mn) Analysis by Country, 2015-2021
Figure 31: North America Inspection and Inventory Labels Market Volume (Sq. Mt.) Analysis by Country, 2015-2032
Figure 32: North America Inspection and Inventory Labels Market Value Share (%) and BPS Analysis by Country, 2022 & 2032
Figure 33: North America Inspection and Inventory Labels Market Y-o-Y Growth (%) Projections by Country, 2022-2032
Figure 34: North America Inspection and Inventory Labels Market Value (US$ Mn) Analysis by Material, 2015-2021
Figure 35: North America Inspection and Inventory Labels Market Volume (Sq. Mt.) Analysis by Material, 2015-2032
Figure 36: North America Inspection and Inventory Labels Market Value Share (%) and BPS Analysis by Material, 2022 & 2032
Figure 37: North America Inspection and Inventory Labels Market Y-o-Y Growth (%) Projections by Material, 2022-2032
Figure 38: North America Inspection and Inventory Labels Market Value (US$ Mn) Analysis by Product Type, 2015-2021
Figure 39: North America Inspection and Inventory Labels Market Volume (Sq. Mt.) Analysis by Product Type, 2015-2032
Figure 40: North America Inspection and Inventory Labels Market Value Share (%) and BPS Analysis by Product Type, 2022 & 2032
Figure 41: North America Inspection and Inventory Labels Market Y-o-Y Growth (%) Projections by Product Type, 2022-2032
Figure 42: North America Inspection and Inventory Labels Market Value (US$ Mn) Analysis by End Use, 2015-2021
Figure 43: North America Inspection and Inventory Labels Market Volume (Sq. Mt.) Analysis by End Use, 2015-2032
Figure 44: North America Inspection and Inventory Labels Market Value Share (%) and BPS Analysis by End Use, 2022 & 2032
Figure 45: North America Inspection and Inventory Labels Market Y-o-Y Growth (%) Projections by End Use, 2022-2032
Figure 46: North America Inspection and Inventory Labels Market Attractiveness by Material, 2022-2032
Figure 47: North America Inspection and Inventory Labels Market Attractiveness by Product Type, 2022-2032
Figure 48: North America Inspection and Inventory Labels Market Attractiveness by End Use, 2022-2032
Figure 49: North America Inspection and Inventory Labels Market Attractiveness by Country, 2022-2032
Figure 50: Latin America Inspection and Inventory Labels Market Value (US$ Mn) by Material, 2022 & 2032
Figure 51: Latin America Inspection and Inventory Labels Market Value (US$ Mn) by Product Type, 2022-2032
Figure 52: Latin America Inspection and Inventory Labels Market Value (US$ Mn) by End Use, 2022-2032
Figure 53: Latin America Inspection and Inventory Labels Market Value (US$ Mn) by Country, 2022-2032
Figure 54: Latin America Inspection and Inventory Labels Market Value (US$ Mn) Analysis by Country, 2015-2021
Figure 55: Latin America Inspection and Inventory Labels Market Volume (Sq. Mt.) Analysis by Country, 2015-2032
Figure 56: Latin America Inspection and Inventory Labels Market Value Share (%) and BPS Analysis by Country, 2022 & 2032
Figure 57: Latin America Inspection and Inventory Labels Market Y-o-Y Growth (%) Projections by Country, 2022-2032
Figure 58: Latin America Inspection and Inventory Labels Market Value (US$ Mn) Analysis by Material, 2015-2021
Figure 59: Latin America Inspection and Inventory Labels Market Volume (Sq. Mt.) Analysis by Material, 2015-2032
Figure 60: Latin America Inspection and Inventory Labels Market Value Share (%) and BPS Analysis by Material, 2022 & 2032
Figure 61: Latin America Inspection and Inventory Labels Market Y-o-Y Growth (%) Projections by Material, 2022-2032
Figure 62: Latin America Inspection and Inventory Labels Market Value (US$ Mn) Analysis by Product Type, 2015-2021
Figure 63: Latin America Inspection and Inventory Labels Market Volume (Sq. Mt.) Analysis by Product Type, 2015-2032
Figure 64: Latin America Inspection and Inventory Labels Market Value Share (%) and BPS Analysis by Product Type, 2022 & 2032
Figure 65: Latin America Inspection and Inventory Labels Market Y-o-Y Growth (%) Projections by Product Type, 2022-2032
Figure 66: Latin America Inspection and Inventory Labels Market Value (US$ Mn) Analysis by End Use, 2015-2021
Figure 67: Latin America Inspection and Inventory Labels Market Volume (Sq. Mt.) Analysis by End Use, 2015-2032
Figure 68: Latin America Inspection and Inventory Labels Market Value Share (%) and BPS Analysis by End Use, 2022 & 2032
Figure 69: Latin America Inspection and Inventory Labels Market Y-o-Y Growth (%) Projections by End Use, 2022-2032
Figure 70: Latin America Inspection and Inventory Labels Market Attractiveness by Material, 2022-2032
Figure 71: Latin America Inspection and Inventory Labels Market Attractiveness by Product Type, 2022-2032
Figure 72: Latin America Inspection and Inventory Labels Market Attractiveness by End Use, 2022-2032
Figure 73: Latin America Inspection and Inventory Labels Market Attractiveness by Country, 2022-2032
Figure 74: Europe Inspection and Inventory Labels Market Value (US$ Mn) by Material, 2022-2032
Figure 75: Europe Inspection and Inventory Labels Market Value (US$ Mn) by Product Type, 2022-2032
Figure 76: Europe Inspection and Inventory Labels Market Value (US$ Mn) by End Use, 2022-2032
Figure 77: Europe Inspection and Inventory Labels Market Value (US$ Mn) by Country, 2022-2032
Figure 78: Europe Inspection and Inventory Labels Market Value (US$ Mn) Analysis by Country, 2015-2021
Figure 79: Europe Inspection and Inventory Labels Market Volume (Sq. Mt.) Analysis by Country, 2015-2032
Figure 80: Europe Inspection and Inventory Labels Market Value Share (%) and BPS Analysis by Country, 2022 & 2032
Figure 81: Europe Inspection and Inventory Labels Market Y-o-Y Growth (%) Projections by Country, 2022-2032
Figure 82: Europe Inspection and Inventory Labels Market Value (US$ Mn) Analysis by Material, 2015-2021
Figure 83: Europe Inspection and Inventory Labels Market Volume (Sq. Mt.) Analysis by Material, 2015-2032
Figure 84: Europe Inspection and Inventory Labels Market Value Share (%) and BPS Analysis by Material, 2022 & 2032
Figure 85: Europe Inspection and Inventory Labels Market Y-o-Y Growth (%) Projections by Material, 2022-2032
Figure 86: Europe Inspection and Inventory Labels Market Value (US$ Mn) Analysis by Product Type, 2015-2021
Figure 87: Europe Inspection and Inventory Labels Market Volume (Sq. Mt.) Analysis by Product Type, 2015-2032
Figure 88: Europe Inspection and Inventory Labels Market Value Share (%) and BPS Analysis by Product Type, 2022 & 2032
Figure 89: Europe Inspection and Inventory Labels Market Y-o-Y Growth (%) Projections by Product Type, 2022-2032
Figure 90: Europe Inspection and Inventory Labels Market Value (US$ Mn) Analysis by End Use, 2015-2021
Figure 91: Europe Inspection and Inventory Labels Market Volume (Sq. Mt.) Analysis by End Use, 2015-2032
Figure 92: Europe Inspection and Inventory Labels Market Value Share (%) and BPS Analysis by End Use, 2022 & 2032
Figure 93: Europe Inspection and Inventory Labels Market Y-o-Y Growth (%) Projections by End Use, 2022-2032
Figure 94: Europe Inspection and Inventory Labels Market Attractiveness by Material, 2022-2032
Figure 95: Europe Inspection and Inventory Labels Market Attractiveness by Product Type, 2022-2032
Figure 96: Europe Inspection and Inventory Labels Market Attractiveness by End Use, 2022-2032
Figure 97: Europe Inspection and Inventory Labels Market Attractiveness by Country, 2022-2032
Figure 98: East Asia Inspection and Inventory Labels Market Value (US$ Mn) by Material, 2022-2032
Figure 99: East Asia Inspection and Inventory Labels Market Value (US$ Mn) by Product Type, 2022-2032
Figure 100: East Asia Inspection and Inventory Labels Market Value (US$ Mn) by End Use, 2022-2032
Figure 101: East Asia Inspection and Inventory Labels Market Value (US$ Mn) by Country, 2022-2032
Figure 102: East Asia Inspection and Inventory Labels Market Value (US$ Mn) Analysis by Country, 2015-2021
Figure 103: East Asia Inspection and Inventory Labels Market Volume (Sq. Mt.) Analysis by Country, 2015-2032
Figure 104: East Asia Inspection and Inventory Labels Market Value Share (%) and BPS Analysis by Country, 2022 & 2032
Figure 105: East Asia Inspection and Inventory Labels Market Y-o-Y Growth (%) Projections by Country, 2022-2032
Figure 106: East Asia Inspection and Inventory Labels Market Value (US$ Mn) Analysis by Material, 2015-2021
Figure 107: East Asia Inspection and Inventory Labels Market Volume (Sq. Mt.) Analysis by Material, 2015-2032
Figure 108: East Asia Inspection and Inventory Labels Market Value Share (%) and BPS Analysis by Material, 2022 & 2032
Figure 109: East Asia Inspection and Inventory Labels Market Y-o-Y Growth (%) Projections by Material, 2022-2032
Figure 110: East Asia Inspection and Inventory Labels Market Value (US$ Mn) Analysis by Product Type, 2015-2021
Figure 111: East Asia Inspection and Inventory Labels Market Volume (Sq. Mt.) Analysis by Product Type, 2015-2032
Figure 112: East Asia Inspection and Inventory Labels Market Value Share (%) and BPS Analysis by Product Type, 2022 & 2032
Figure 113: East Asia Inspection and Inventory Labels Market Y-o-Y Growth (%) Projections by Product Type, 2022-2032
Figure 114: East Asia Inspection and Inventory Labels Market Value (US$ Mn) Analysis by End Use, 2015-2021
Figure 115: East Asia Inspection and Inventory Labels Market Volume (Sq. Mt.) Analysis by End Use, 2015-2032
Figure 116: East Asia Inspection and Inventory Labels Market Value Share (%) and BPS Analysis by End Use, 2022 & 2032
Figure 117: East Asia Inspection and Inventory Labels Market Y-o-Y Growth (%) Projections by End Use, 2022-2032
Figure 118: East Asia Inspection and Inventory Labels Market Attractiveness by Material, 2022-2032
Figure 119: East Asia Inspection and Inventory Labels Market Attractiveness by Product Type, 2022-2032
Figure 120: East Asia Inspection and Inventory Labels Market Attractiveness by End Use, 2022-2032
Figure 121: East Asia Inspection and Inventory Labels Market Attractiveness by Country, 2022-2032
Figure 122: South Asia Inspection and Inventory Labels Market Value (US$ Mn) by Material, 2022-2032
Figure 123: South Asia Inspection and Inventory Labels Market Value (US$ Mn) by Product Type, 2022-2032
Figure 124: South Asia Inspection and Inventory Labels Market Value (US$ Mn) by End Use, 2022-2032
Figure 125: South Asia Inspection and Inventory Labels Market Value (US$ Mn) by Country, 2022-2032
Figure 126: South Asia Inspection and Inventory Labels Market Value (US$ Mn) Analysis by Country, 2015-2021
Figure 127: South Asia Inspection and Inventory Labels Market Volume (Sq. Mt.) Analysis by Country, 2015-2032
Figure 128: South Asia Inspection and Inventory Labels Market Value Share (%) and BPS Analysis by Country, 2022 & 2032
Figure 129: South Asia Inspection and Inventory Labels Market Y-o-Y Growth (%) Projections by Country, 2022-2032
Figure 130: South Asia Inspection and Inventory Labels Market Value (US$ Mn) Analysis by Material, 2015-2021
Figure 131: South Asia Inspection and Inventory Labels Market Volume (Sq. Mt.) Analysis by Material, 2015-2032
Figure 132: South Asia Inspection and Inventory Labels Market Value Share (%) and BPS Analysis by Material, 2022 & 2032
Figure 133: South Asia Inspection and Inventory Labels Market Y-o-Y Growth (%) Projections by Material, 2022-2032
Figure 134: South Asia Inspection and Inventory Labels Market Value (US$ Mn) Analysis by Product Type, 2015-2021
Figure 135: South Asia Inspection and Inventory Labels Market Volume (Sq. Mt.) Analysis by Product Type, 2015-2032
Figure 136: South Asia Inspection and Inventory Labels Market Value Share (%) and BPS Analysis by Product Type, 2022 & 2032
Figure 137: South Asia Inspection and Inventory Labels Market Y-o-Y Growth (%) Projections by Product Type, 2022-2032
Figure 138: South Asia Inspection and Inventory Labels Market Value (US$ Mn) Analysis by End Use, 2015-2021
Figure 139: South Asia Inspection and Inventory Labels Market Volume (Sq. Mt.) Analysis by End Use, 2015-2032
Figure 140: South Asia Inspection and Inventory Labels Market Value Share (%) and BPS Analysis by End Use, 2022 & 2032
Figure 141: South Asia Inspection and Inventory Labels Market Y-o-Y Growth (%) Projections by End Use, 2022-2032
Figure 142: South Asia Inspection and Inventory Labels Market Attractiveness by Material, 2022-2032
Figure 143: South Asia Inspection and Inventory Labels Market Attractiveness by Product Type, 2022-2032
Figure 144: South Asia Inspection and Inventory Labels Market Attractiveness by End Use, 2022-2032
Figure 145: South Asia Inspection and Inventory Labels Market Attractiveness by Country, 2022-2032
Figure 146: Oceania Inspection and Inventory Labels Market Value (US$ Mn) by Material, 2022-2032
Figure 147: Oceania Inspection and Inventory Labels Market Value (US$ Mn) by Product Type, 2022-2032
Figure 148: Oceania Inspection and Inventory Labels Market Value (US$ Mn) by End Use, 2022-2032
Figure 149: Oceania Inspection and Inventory Labels Market Value (US$ Mn) by Country, 2022-2032
Figure 150: Oceania Inspection and Inventory Labels Market Value (US$ Mn) Analysis by Country, 2015-2021
Figure 151: Oceania Inspection and Inventory Labels Market Volume (Sq. Mt.) Analysis by Country, 2015-2032
Figure 152: Oceania Inspection and Inventory Labels Market Value Share (%) and BPS Analysis by Country, 2022 & 2032
Figure 153: Oceania Inspection and Inventory Labels Market Y-o-Y Growth (%) Projections by Country, 2022-2032
Figure 154: Oceania Inspection and Inventory Labels Market Value (US$ Mn) Analysis by Material, 2015-2021
Figure 155: Oceania Inspection and Inventory Labels Market Volume (Sq. Mt.) Analysis by Material, 2015-2032
Figure 156: Oceania Inspection and Inventory Labels Market Value Share (%) and BPS Analysis by Material, 2022 & 2032
Figure 157: Oceania Inspection and Inventory Labels Market Y-o-Y Growth (%) Projections by Material, 2022-2032
Figure 158: Oceania Inspection and Inventory Labels Market Value (US$ Mn) Analysis by Product Type, 2015-2021
Figure 159: Oceania Inspection and Inventory Labels Market Volume (Sq. Mt.) Analysis by Product Type, 2015-2032
Figure 160: Oceania Inspection and Inventory Labels Market Value Share (%) and BPS Analysis by Product Type, 2022 & 2032
Figure 161: Oceania Inspection and Inventory Labels Market Y-o-Y Growth (%) Projections by Product Type, 2022-2032
Figure 162: Oceania Inspection and Inventory Labels Market Value (US$ Mn) Analysis by End Use, 2015-2021
Figure 163: Oceania Inspection and Inventory Labels Market Volume (Sq. Mt.) Analysis by End Use, 2015-2032
Figure 164: Oceania Inspection and Inventory Labels Market Value Share (%) and BPS Analysis by End Use, 2022 & 2032
Figure 165: Oceania Inspection and Inventory Labels Market Y-o-Y Growth (%) Projections by End Use, 2022-2032
Figure 166: Oceania Inspection and Inventory Labels Market Attractiveness by Material, 2022-2032
Figure 167: Oceania Inspection and Inventory Labels Market Attractiveness by Product Type, 2022-2032
Figure 168: Oceania Inspection and Inventory Labels Market Attractiveness by End Use, 2022-2032
Figure 169 Oceania Inspection and Inventory Labels Market Attractiveness by Country, 2022-2032
Figure 170: MEA Inspection and Inventory Labels Market Value (US$ Mn) by Material, 2022-2032
Figure 171: MEA Inspection and Inventory Labels Market Value (US$ Mn) by Product Type, 2022-2032
Figure 172: MEA Inspection and Inventory Labels Market Value (US$ Mn) by End Use, 2022-2032
Figure 173: MEA Inspection and Inventory Labels Market Value (US$ Mn) by Country, 2022-2032
Figure 174: MEA Inspection and Inventory Labels Market Value (US$ Mn) Analysis by Country, 2015-2021
Figure 175: MEA Inspection and Inventory Labels Market Volume (Sq. Mt.) Analysis by Country, 2015-2032
Figure 176: MEA Inspection and Inventory Labels Market Value Share (%) and BPS Analysis by Country, 2022 & 2032
Figure 177: MEA Inspection and Inventory Labels Market Y-o-Y Growth (%) Projections by Country, 2022-2032
Figure 178: MEA Inspection and Inventory Labels Market Value (US$ Mn) Analysis by Material, 2015-2021
Figure 179: MEA Inspection and Inventory Labels Market Volume (Sq. Mt.) Analysis by Material, 2015-2032
Figure 180: MEA Inspection and Inventory Labels Market Value Share (%) and BPS Analysis by Material, 2022 & 2032
Figure 181: MEA Inspection and Inventory Labels Market Y-o-Y Growth (%) Projections by Material, 2022-2032
Figure 182: MEA Inspection and Inventory Labels Market Value (US$ Mn) Analysis by Product Type, 2015-2021
Figure 183: MEA Inspection and Inventory Labels Market Volume (Sq. Mt.) Analysis by Product Type, 2015-2032
Figure 184: MEA Inspection and Inventory Labels Market Value Share (%) and BPS Analysis by Product Type, 2022 & 2032
Figure 185: MEA Inspection and Inventory Labels Market Y-o-Y Growth (%) Projections by Product Type, 2022-2032
Figure 186: MEA Inspection and Inventory Labels Market Value (US$ Mn) Analysis by End Use, 2015-2021
Figure 187: MEA Inspection and Inventory Labels Market Volume (Sq. Mt.) Analysis by End Use, 2015-2032
Figure 188: MEA Inspection and Inventory Labels Market Value Share (%) and BPS Analysis by End Use, 2022 & 2032
Figure 189: MEA Inspection and Inventory Labels Market Y-o-Y Growth (%) Projections by End Use, 2022-2032
Figure 190: MEA Inspection and Inventory Labels Market Attractiveness by Material, 2022-2032
Figure 191: MEA Inspection and Inventory Labels Market Attractiveness by Product Type, 2022-2032
Figure 192: MEA Inspection and Inventory Labels Market Attractiveness by End Use, 2022-2032
Figure 193 MEA Inspection and Inventory Labels Market Attractiveness by Country, 2022-2032
Asia is the biggest segment in the inspection and inventory labels market and is expected to hold a big portion of the market in the forecast period. The leading factor is the increased manufacturing facilities, Warehouses, stacking units and excessively increasing e commerce platforms. This leads to the high demand for Inspection and inventory labels in developed countries like India and China.
Key competitors holding substantial inspection and inventory labels market share include Labelmaster, FSI Label, TOSHIBA Global Commerce Solutions Inc, Coast Label Company, Label Specialities Inc., and The Label Printers LP.
Demand for Inspection and inventory labels is likely to rise with the demand from the increased eCommerce, medical and advertisement industry, increasing the sales of inspection and inventory labels.
Explore Similar Insights
Thank you!
You will receive an email from our Business Development Manager. Please be sure to check your SPAM/JUNK folder too.