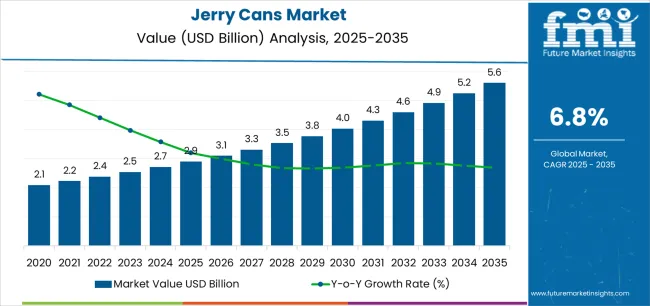
The global jerry cans market is projected to reach an estimated value of USD 2.5 billion by 2025. This market is expected to grow steadily, with a compound annual growth rate (CAGR) of 4.6% from 2025 to 2035. By 2035, the market size is predicted to hit USD 3.9 billion.
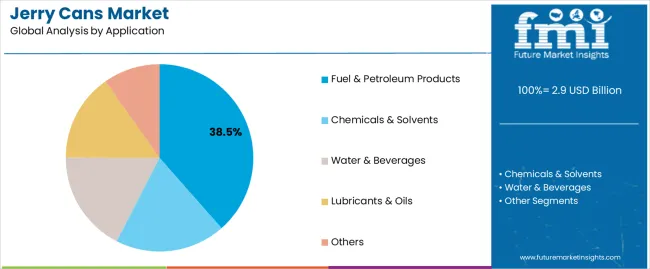
Growth in the jerry cans market is primarily driven by increasing demand for durable and reliable packaging solutions across various industries. These industries include automotive, chemicals, food and beverages, and agriculture. Jerry cans are widely used for the safe transport and storage of liquids such as fuels, oils, and chemicals.
Materials used in jerry cans include high-density polyethylene (HDPE), metal, and steel. HDPE jerry cans are preferred for their lightweight and corrosion resistance. Metal and steel jerry cans are favored for durability and security, especially in industrial applications. The choice of material depends on the intended use and regulatory requirements.
Stringent regulations on the transport of hazardous materials have pushed the demand for compliant and standardized jerry cans. Safety features like leak-proof caps, child-resistant closures, and anti-static properties are increasingly incorporated to meet global safety standards. The rise in fuel consumption globally has supported steady demand for fuel-grade jerry cans. In addition, the food and beverage sector is adopting jerry cans for packaging edible oils and liquid ingredients due to their robustness and ease of handling.
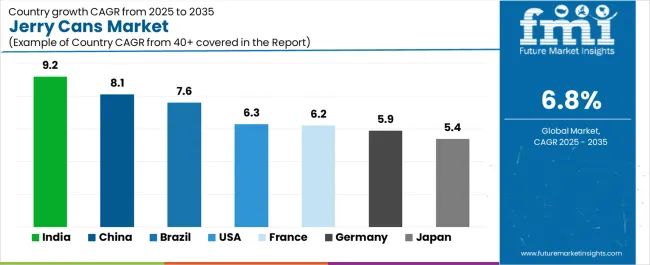
Regional markets show varied growth patterns. Asia-Pacific is expected to dominate the jerry cans market due to expanding automotive and chemical industries. Countries such as China and India are witnessing increasing industrialization and urbanization, driving market demand. North America and Europe also contribute significantly, driven by stringent safety norms and environmental concerns.
Recent innovations focus on sustainable and reusable jerry cans made from recycled materials. Companies are investing in eco-friendly production methods to reduce plastic waste and carbon footprints. Biodegradable coatings and lightweight composite materials are being developed to enhance product performance. According to market trends, digital printing and labeling on jerry cans are gaining traction. These technologies improve brand visibility and ensure compliance with labeling regulations.
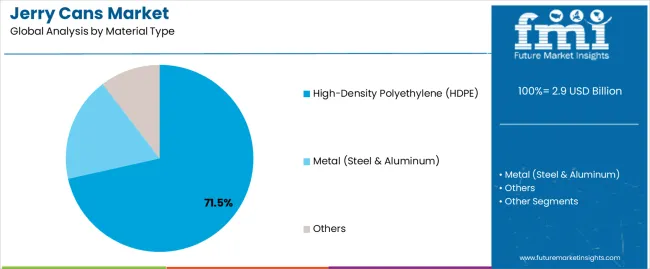
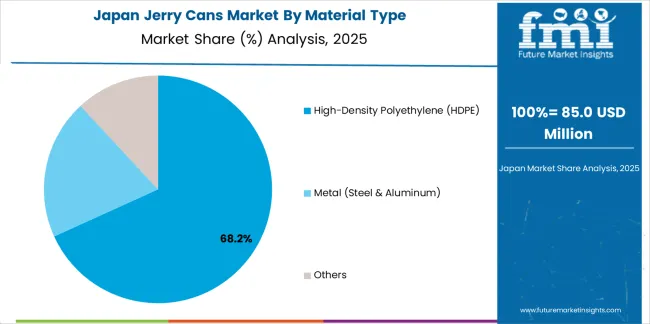
Plastic jerry cans are set to dominate around 70% of the market by 2025. Their winning formula lies in being lightweight yet tough, resistant to corrosion, and more affordable than metal counterparts. Made mostly from high-density polyethylene (HDPE), these cans withstand a variety of chemicals, making them perfect for safely storing water, fuels, and industrial liquids.
Their flexible manufacturing allows for diverse sizes and shapes, catering to both household and industrial users. Plastic jerry cans are staples in agriculture for pesticides and fertilizers, popular for water storage at home, and widely used in automotive fuel handling. With rising environmental concerns, companies are innovating recyclable and biodegradable plastics to boost sustainability.
Enhanced UV resistance and impact strength help plastic jerry cans endure harsh outdoor conditions longer. Their ease of handling and lower shipping costs make them a favorite choice worldwide. Together, these advantages ensure plastic jerry cans will continue powering growth and remain market leaders for years to come.
Metal jerry cans hold 30% market share in 2025. Built tough from steel or aluminum, they offer superior protection against leaks and contamination, making them indispensable in fuel storage, military operations, and heavy industrial use. Their rigid design supports secure stacking and long-haul shipping without damage.
Advanced coatings prevent rust and chemical wear, extending their lifespan. While heavier and pricier than plastic, metal jerry cans are trusted where safety and durability cannot be compromised. Industries like defense, automotive, and manufacturing rely on them heavily.
Ergonomic improvements and better metal treatments continue to boost usability and user comfort. As global industrial activity expands, these robust containers will remain essential, combining toughness with reliability. Metal jerry cans truly stand as champions where strength meets safety in demanding environments.
The Asia-Pacific region, practically already in possession of the future jerry cans market, is being pushed forward on account of the rapid pace of industrialization, an increasing demand for fuel storage solutions, and several government policies seeking to enforce safety measures for chemical packaging. Countries such as China, India, and Japan are being fueled with high demand in the logistics, automotive, and chemical industries for highly efficient jerry cans that require high impact resistance and recyclability.
The market is thrilled by investments in cheap bio-based plastics, the development of multi-layer barrier jerry cans, and container production automation. Further, regulations providing safety measures for the environment and reusable packaging solutions are dissuading manufacturers from developing next-generation jerry cans.
The regional presence of chemical and lubricant manufacturers enhances local production capabilities. Developments in lightweight polymer jerry cans, UV-coated surfaces, and RFID-enabled tracking are opportunities to be tapped in the Asia-Pacific market.
North America remains one of the prime regions where one can find major demand for jerry cans, especially considering the need which arises from automotive applications, chemicals, and fuel storage. It also has the US and Canada towards the technological advancement in tamper-evident, corrosion-resistant, and high-strength jerry can designs. Furthermore, there is an increase in investments for automation and AI-based defect detection, thus improving efficiency and waste reduction within jerry can production.
Currently, there is a significant demand for anti-spill, recyclable, and UN-certified jerry cans in compliance to most EPA, DOT, and hazardous materials transportation laws which is becoming more stringent. Innovations include smart dispensing mechanisms, self-sealing nozzles, and AI-powered quality control systems to improve functionality and compliance.
Furthermore, increased demand for the safe storage of fuels, portable handling of chemicals, and military-grade jerry cans can lead to product innovation. Developments in IoT-enabled tracking technology, leak-proof cap technology, and durable composite materials will also transform the North-American jerry cans market.
Consumer restrictions of biodegradable packaging; industrial restrictions on oil migrator materials; restrict consumers to purchase products in clashing conditions for a deliberately instructed time-frame. The jerry can industry is becoming quite dominant over Europe due to its stringent environmental laws and a higher populace inclination towards the sustainable packaging solution in reusable container format.
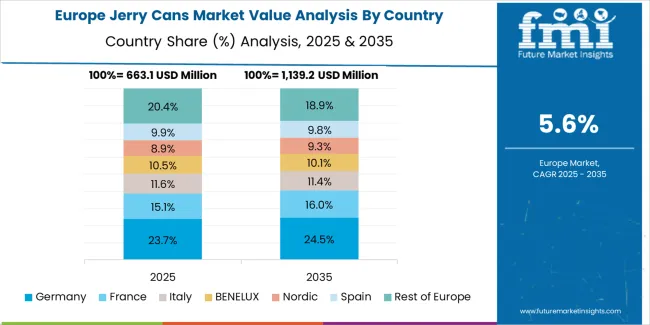
The leading economies in this regard would include Germany, France, and the UK, which are setting modern standards in low-carbon jerry can manufacturing, high-strength recycled materials, and smart liquid packaging solutions. The backdrop of policies mandating hazardous material safety compliance, extended producer responsibility (EPR) on dangerous packaging, and circular economy packaging solutions will weigh in on the future of this industry.
There's a lot of collaboration among jerry can manufacturers, chemical companies, and regulators when it comes to next-generation sustainable container systems. All of this will see innovations around biodegradable plastics, multi-layer fuel-resistant coatings, and collapse structures for jerry can, among others. Further, European research institutes are investing in projects around AI-based defect detection systems, high-barrier polymer coatings, and green logistics solutions to fast-track sector growth.
Challenges
Opportunities
Market Shift | 2020 to 2024 Trends |
---|---|
Regulatory Landscape | Initial focus on improving recyclability of plastic jerry cans. |
Material and Formulation Innovations | Development of lightweight, durable jerry cans. |
Industry Adoption | Widely used in fuel, chemicals, and agriculture. |
Market Competition | Dominated by traditional liquid storage manufacturers. |
Market Growth Drivers | Growth driven by demand for durable and leak-proof packaging. |
Sustainability and Environmental Impact | Early-stage transition to recyclable jerry cans. |
Integration of AI and Process Optimization | Limited AI use in defect detection and logistics tracking. |
Advancements in Packaging Technology | Basic improvements in spill resistance and durability. |
Market Shift | 2025 to 2035 Projections |
---|---|
Regulatory Landscape | Stricter global policies promoting biodegradable, UN-certified, and smart containers. |
Material and Formulation Innovations | Expansion of bio-based, RFID-integrated, and corrosion-resistant storage materials. |
Industry Adoption | Increased adoption in EV battery storage, AI-driven logistics, and premium fuel transport. |
Market Competition | Rise of automation-focused startups and sustainability-driven jerry can producers. |
Market Growth Drivers | Expansion fueled by automation, AI integration, and next-gen sustainable storage solutions. |
Sustainability and Environmental Impact | Large-scale shift to fully compostable, fiber-enhanced, and low-carbon packaging solutions. |
Integration of AI and Process Optimization | AI-driven predictive analytics, real-time logistics monitoring, and automated sustainability tracking. |
Advancements in Packaging Technology | Development of IoT-enabled, RFID-tracked, and AI-powered liquid storage solutions. |
The huge demand for reliable and stackable leak-proof containers for chemical storage, fuel transportation, food and beverage packaging, and emergency waters has still perpetuated the USA market growth for jerry cans. The market demand for HDPE, metal, and composite jerrys is inspiring manufacturers to consider lightweight yet higher impact-resistant containers that are also UN-approved.
The growing governmental regulations on hazardous materials handling and fuel transportation are forcing companies to adopt more eco-friendly, reusable, and corrosion-proof jerry cans. The product improvement concerning the features and convenience for users has been enhanced through RFID-enabled tracking, cap tampering solutions, and ergonomic designs.
Smart packaging solutions are being researched and tested, which includes features such as digital authentication, modular stacking, and spill-proof nozzles further enhancing the safety and efficiency of container handling operations. Furthermore, jerry cans have grown in popularity in recent years for industrial lubricants and portable fuel storage focused on military applications spurring the innovation of high-performance yet environmentally responsible container solutions.
Country | CAGR (2025 to 2035) |
---|---|
United States | 5.8% |
The market for jerry cans in the UK is expanding as industries increasingly devote themselves to sustainable development, safety compliance, and effective storage. The growing demand for food-grade, fuel-safe, and recyclable jerry cans has led to increased application in various industries, including agriculture, automotive, and military logistics.
Other important government policies that influence companies to integrate degradable, reusable, and strong jerry cans include those directed toward circular economies, plastic waste reduction, and the establishment of safe fuel storage conditions. Innovations in anti-glug nozzles, flexible pouring spouts, and space-saving stackable designs have made these solutions attractive not only to businesses but also to households.
Companies will also promote efficiency and safety through the use of digital branding, tamper-evident sealing, and dual-compartment jerry cans. Demand for advanced material-based containers in the UK market is also fueled by the trend of consumers nowadays towards purchasing better quality jerry cans which are UN certified for chemical, fuel, and water storage applications.
Country | CAGR (2025 to 2035) |
---|---|
United Kingdom | 5.2% |
The market for jerry cans in Japan is expected to grow steadily in the near future due to the increasing demand for high-precision, durable, and chemical-resistant storage solutions in industries like automotive, manufacturing, and emergency preparedness. Advanced jerry cans are being developed with superior impact resistance, UV protection, and multi-layered construction so that they comply with the country's stringent safety and environmental regulations.
In addition, the businesses are transitioning towards BPA-free, fully recyclable, high-barrier jerry cans, with stricter regulations on storage of fuels, handling of chemicals, and sustainable packaging. Moreover, advancements in flexible dispensing mechanisms, compact collapsible jerry cans, high-pressure resistance containers are contributing to high demand in applications where efficient liquid storage and transport is essential.
Further, the introduction of automation-enhanced production systems, leak-proof sealing technologies, and efficient RFID-enabled tracking features is designed to streamline operations and eliminate wasteful spending processes. Besides these waves of changes, the prospect for off-grid water storage, outdoor recreation, and emergency fuel backup systems is pushing demand because those applications will require high-quality and eco-friendly jerry cans.
Country | CAGR (2025 to 2035) |
---|---|
Japan | 4.9% |
The market for jerry cans in South Korea is booming at the moment, mainly owing to the necessity of long-lasting, heat-resistant, and eco-friendly storage systems for fuel and liquid in military, industrial, and household applications. The growing requirement for impact-resistant, leak-proof, and UN-approved jerry cans has induced manufacturers to come up with solutions that are chemically compatible, UV-shielded, and anti-spill. Further strengthening this expansion is government policy towards the safe handling of fuels, storage of hazardous wastes, and the use of highly recyclable materials.
In addition, companies are using such smart tracking technologies as NFC-enabled authentication, digital barcoding for batch verifications, and AI-powered defect detection to improve product quality and supply chain efficiency. Furthermore, the jerry can continues to gain ground, benefiting from rising trends in performance and demand for compactness, mobility, and better space utilization for camping, marine transport, and industrial fuel storage purposes.
Current developments in sustainable bio-based plastics, collapsible jerry can alternatives, and dual-layered, impact-resistant designs are pushing the industry toward further innovation in compliance with regulations in the production of bespoke jerry cans that are responsive to the dynamic demands of modern industry.
Country | CAGR (2025 to 2035) |
---|---|
South Korea | 5.5% |
The market of jerry cans has been seeing rapid advancements in lightweight, high-strength, and sustainable packaging solutions. Innovations in eco stackable jerry cans, eco-friendly plastic variants, and digitally traceable containers matter greatly for shaping trends in the industry. Furthermore, these strong investment movements to smart dispensing nozzles, UV-resistant coatings, and recyclable bulk liquid storage drive the sustainability of the market.
Apart from these, companies are increasingly focusing on customized jerry can solutions, where features such as AI-driven quality control systems, ergonomic designs, and compliance handling of hazardous materials are incorporated. Strategic partnerships among jerry can manufacturers and logistics providers will increase opportunity availability in various segments.
Market Share Analysis by Company
Company Name | Estimated Market Share (%) |
---|---|
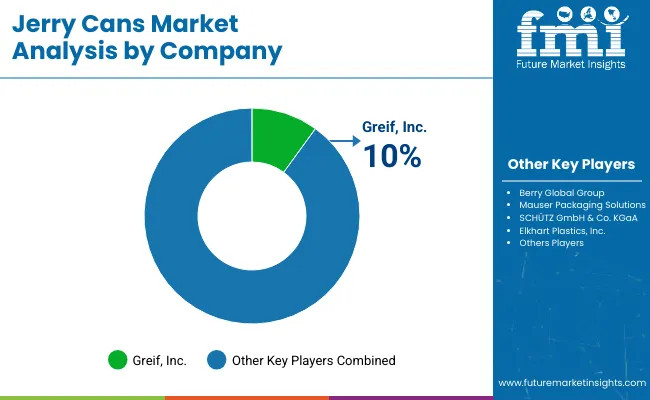
Greif, Inc. | 10-14% |
Berry Global Group | 8-12% |
Mauser Packaging Solutions | 6-10% |
SCHÜTZ GmbH & Co. KGaA | 4-8% |
Elkhart Plastics, Inc. | 3-7% |
Other Companies (combined) | 45-55% |
Company Name | Key Offerings/Activities |
---|---|
Greif, Inc. | Develops high-performance, sustainable jerry can solutions for industrial, chemical, and fuel storage applications. |
Berry Global Group | Specializes in durable, cost-effective plastic jerry cans optimized for heavy-duty liquid storage. |
Mauser Packaging Solutions | Produces stackable and moisture-resistant jerry cans for safe handling and transportation. |
SCHÜTZ GmbH & Co. KGaA | Expands its jerry can portfolio with recyclable, anti-static materials for hazardous chemical storage. |
Elkhart Plastics, Inc. | Focuses on customized, high-strength jerry cans for transport and logistics packaging. |
Key Company Insights
Several specialty jerry can manufacturers contribute to the expanding market. These include:
Report Attributes | Details |
---|---|
Current Total Market Size (2025) | USD 2.5 billion |
Projected Market Size (2035) | USD 3.9 billion |
CAGR (2025 to 2035) | 4.6% |
Base Year for Estimation | 2024 |
Historical Period | 2020 to 2024 |
Projections Period | 2025 to 2035 |
Quantitative Units | USD billion for value and million units for volume |
Materials Analyzed (Segment 1) | Plastic, Metal |
Capacities Analyzed (Segment 2) | Below 10 Liters, 10 Lt to 25 Liters, Above 25 Liters |
End Uses Analyzed (Segment 3) | Food & Beverage, Vegetable Oil, Juices & Milk, Agrochemicals, Fertilizers, Pesticides, Industrial Chemicals, Hazardous, Non-hazardous, Petroleum & Lubricants |
Regions Covered | North America; Latin America; Western Europe; Eastern Europe; South Asia and Pacific; East Asia; Middle East & Africa |
Countries Covered | United States, Canada, Mexico, Brazil, Argentina, Germany, France, United Kingdom, Italy, Spain, Netherlands, China, India, Japan, South Korea, ANZ, GCC Countries, South Africa |
Key Players influencing the Jerry Cans Market | Greif, Inc., Berry Global Group, Mauser Packaging Solutions, SCHÜTZ GmbH & Co. KGaA, Elkhart Plastics, Inc., Roto Plastics, Denios AG, Werit Kunststoffwerke, Cleveland Containers Ltd, Plain Pallets Pty Ltd. |
Additional Attributes | Demand growth in food and beverage and industrial chemicals sectors, Material preference trends for plastic and metal cans, Expansion in hazardous and non-hazardous packaging, Regional regulatory impacts on chemical and petroleum packaging, Innovation in reusable and sustainable jerry cans |
Customization and Pricing | Customization and Pricing Available on Request |
Table 01: Global Jerry Cans Market Value (US$ Billion) Forecast by Region, 2016 to 2033
Table 02: Global Jerry Cans Market Volume (Units) Forecast by Region, 2016 to 2033
Table 03: Global Jerry Cans Market Value (US$ Billion) Forecast by Material Type, 2016 to 2033
Table 04: Global Jerry Cans Market Volume (Units) Forecast by Material Type, 2016 to 2033
Table 05: Global Jerry Cans Market Value (US$ Billion) Forecast by Capacity, 2016 to 2033
Table 06: Global Jerry Cans Market Volume (Units) Forecast by Capacity, 2016 to 2033
Table 07: Global Jerry Cans Market Value (US$ Billion) Forecast by End-Use, 2016 to 2033
Table 08: Global Jerry Cans Market Volume (Units) Forecast by End-Use, 2016 to 2033
Table 09: Global Jerry Cans Market Value (US$ Billion) Forecast by Region, 2016 to 2033
Table 10: Global Jerry Cans Market Volume (Units) Forecast by Region, 2016 to 2033
Table 11: Global Jerry Cans Market Value (US$ Billion) Forecast by End Use, 2016 to 2033
Table 12: Global Jerry Cans Market Volume (Units) Forecast by End Use, 2016 to 2033
Table 13: North America Jerry Cans Market Value (US$ Billion) Forecast by Country, 2016 to 2033
Table 14: North America Jerry Cans Market Volume (Units) Forecast by Country, 2016 to 2033
Table 15: North America Jerry Cans Market Value (US$ Billion) Forecast by Material Type, 2016 to 2033
Table 16: North America Jerry Cans Market Volume (Units) Forecast by Material Type, 2016 to 2033
Table 17: North America Jerry Cans Market Value (US$ Billion) Forecast by Capacity, 2016 to 2033
Table 18: North America Jerry Cans Market Volume (Units) Forecast by Capacity, 2016 to 2033
Table 19: North America Jerry Cans Market Value (US$ Billion) Forecast by End-Use, 2016 to 2033
Table 20: North America Jerry Cans Market Volume (Units) Forecast by End-Use, 2016 to 2033
Table 21: North America Jerry Cans Market Value (US$ Billion) Forecast by Region, 2016 to 2033
Table 22: North America Jerry Cans Market Volume (Units) Forecast by Region, 2016 to 2033
Table 23: North America Jerry Cans Market Value (US$ Billion) Forecast by End Use, 2016 to 2033
Table 24: North America Jerry Cans Market Volume (Units) Forecast by End Use, 2016 to 2033
Table 25: Latin America Jerry Cans Market Value (US$ Billion) Forecast by Country, 2016 to 2033
Table 26: Latin America Jerry Cans Market Volume (Units) Forecast by Country, 2016 to 2033
Table 27: Latin America Jerry Cans Market Value (US$ Billion) Forecast by Material Type, 2016 to 2033
Table 28: Latin America Jerry Cans Market Volume (Units) Forecast by Material Type, 2016 to 2033
Table 29: Latin America Jerry Cans Market Value (US$ Billion) Forecast by Capacity, 2016 to 2033
Table 30: Latin America Jerry Cans Market Volume (Units) Forecast by Capacity, 2016 to 2033
Table 31: Latin America Jerry Cans Market Value (US$ Billion) Forecast by End-Use, 2016 to 2033
Table 32: Latin America Jerry Cans Market Volume (Units) Forecast by End-Use, 2016 to 2033
Table 33: Latin America Jerry Cans Market Value (US$ Billion) Forecast by Region, 2016 to 2033
Table 34: Latin America Jerry Cans Market Volume (Units) Forecast by Region, 2016 to 2033
Table 35: Latin America Jerry Cans Market Value (US$ Billion) Forecast by End Use, 2016 to 2033
Table 36: Latin America Jerry Cans Market Volume (Units) Forecast by End Use, 2016 to 2033
Table 37: Europe Jerry Cans Market Value (US$ Billion) Forecast by Country, 2016 to 2033
Table 38: Europe Jerry Cans Market Volume (Units) Forecast by Country, 2016 to 2033
Table 39: Europe Jerry Cans Market Value (US$ Billion) Forecast by Material Type, 2016 to 2033
Table 40: Europe Jerry Cans Market Volume (Units) Forecast by Material Type, 2016 to 2033
Table 41: Europe Jerry Cans Market Value (US$ Billion) Forecast by Capacity, 2016 to 2033
Table 42: Europe Jerry Cans Market Volume (Units) Forecast by Capacity, 2016 to 2033
Table 43: Europe Jerry Cans Market Value (US$ Billion) Forecast by End-Use, 2016 to 2033
Table 44: Europe Jerry Cans Market Volume (Units) Forecast by End-Use, 2016 to 2033
Table 45: Europe Jerry Cans Market Value (US$ Billion) Forecast by Region, 2016 to 2033
Table 46: Europe Jerry Cans Market Volume (Units) Forecast by Region, 2016 to 2033
Table 47: Europe Jerry Cans Market Value (US$ Billion) Forecast by End Use, 2016 to 2033
Table 48: Europe Jerry Cans Market Volume (Units) Forecast by End Use, 2016 to 2033
Table 49: MEA Jerry Cans Market Value (US$ Billion) Forecast by Country, 2016 to 2033
Table 50: MEA Jerry Cans Market Volume (Units) Forecast by Country, 2016 to 2033
Table 51: MEA Jerry Cans Market Value (US$ Billion) Forecast by Material Type, 2016 to 2033
Table 52: MEA Jerry Cans Market Volume (Units) Forecast by Material Type, 2016 to 2033
Table 53: MEA Jerry Cans Market Value (US$ Billion) Forecast by Capacity, 2016 to 2033
Table 54: MEA Jerry Cans Market Volume (Units) Forecast by Capacity, 2016 to 2033
Table 55: MEA Jerry Cans Market Value (US$ Billion) Forecast by End-Use, 2016 to 2033
Table 56: MEA Jerry Cans Market Volume (Units) Forecast by End-Use, 2016 to 2033
Table 57: MEA Jerry Cans Market Value (US$ Billion) Forecast by Region, 2016 to 2033
Table 58: MEA Jerry Cans Market Volume (Units) Forecast by Region, 2016 to 2033
Table 59: MEA Jerry Cans Market Value (US$ Billion) Forecast by End Use, 2016 to 2033
Table 60: MEA Jerry Cans Market Volume (Units) Forecast by End Use, 2016 to 2033
Table 61: East Asia Jerry Cans Market Value (US$ Billion) Forecast by Country, 2016 to 2033
Table 62: East Asia Jerry Cans Market Volume (Units) Forecast by Country, 2016 to 2033
Table 63: East Asia Jerry Cans Market Value (US$ Billion) Forecast by Material Type, 2016 to 2033
Table 64: East Asia Jerry Cans Market Volume (Units) Forecast by Material Type, 2016 to 2033
Table 65: East Asia Jerry Cans Market Value (US$ Billion) Forecast by Capacity, 2016 to 2033
Table 66: East Asia Jerry Cans Market Volume (Units) Forecast by Capacity, 2016 to 2033
Table 67: East Asia Jerry Cans Market Value (US$ Billion) Forecast by End-Use, 2016 to 2033
Table 68: East Asia Jerry Cans Market Volume (Units) Forecast by End-Use, 2016 to 2033
Table 69: East Asia Jerry Cans Market Value (US$ Billion) Forecast by Region, 2016 to 2033
Table 70: East Asia Jerry Cans Market Volume (Units) Forecast by Region, 2016 to 2033
Table 71: East Asia Jerry Cans Market Value (US$ Billion) Forecast by End Use, 2016 to 2033
Table 72: East Asia Jerry Cans Market Volume (Units) Forecast by End Use, 2016 to 2033
Table 73: South Asia & Pacific Jerry Cans Market Value (US$ Billion) Forecast by Country, 2016 to 2033
Table 74: South Asia & Pacific Jerry Cans Market Volume (Units) Forecast by Country, 2016 to 2033
Table 75: South Asia & Pacific Jerry Cans Market Value (US$ Billion) Forecast by Material Type, 2016 to 2033
Table 76: South Asia & Pacific Jerry Cans Market Volume (Units) Forecast by Material Type, 2016 to 2033
Table 77: South Asia & Pacific Jerry Cans Market Value (US$ Billion) Forecast by Capacity, 2016 to 2033
Table 78: South Asia & Pacific Jerry Cans Market Volume (Units) Forecast by Capacity, 2016 to 2033
Table 79: South Asia & Pacific Jerry Cans Market Value (US$ Billion) Forecast by End-Use, 2016 to 2033
Table 80: South Asia & Pacific Jerry Cans Market Volume (Units) Forecast by End-Use, 2016 to 2033
Table 81: South Asia & Pacific Jerry Cans Market Value (US$ Billion) Forecast by Region, 2016 to 2033
Table 82: South Asia & Pacific Jerry Cans Market Volume (Units) Forecast by Region, 2016 to 2033
Table 83: South Asia & Pacific Jerry Cans Market Value (US$ Billion) Forecast by End Use, 2016 to 2033
Table 84: South Asia & Pacific Jerry Cans Market Volume (Units) Forecast by End Use, 2016 to 2033
Table 85: Oceania Jerry Cans Market Value (US$ Billion) Forecast by Country, 2016 to 2033
Table 86: Oceania Jerry Cans Market Volume (Units) Forecast by Country, 2016 to 2033
Table 87: Oceania Jerry Cans Market Value (US$ Billion) Forecast by Material Type, 2016 to 2033
Table 88: Oceania Jerry Cans Market Volume (Units) Forecast by Material Type, 2016 to 2033
Table 89: Oceania Jerry Cans Market Value (US$ Billion) Forecast by Capacity, 2016 to 2033
Table 90: Oceania Jerry Cans Market Volume (Units) Forecast by Capacity, 2016 to 2033
Table 91: Oceania Jerry Cans Market Value (US$ Billion) Forecast by End-Use, 2016 to 2033
Table 92: Oceania Jerry Cans Market Volume (Units) Forecast by End-Use, 2016 to 2033
Table 93: Oceania Jerry Cans Market Value (US$ Billion) Forecast by Region, 2016 to 2033
Table 94: Oceania Jerry Cans Market Volume (Units) Forecast by Region, 2016 to 2033
Table 95: Oceania Jerry Cans Market Value (US$ Billion) Forecast by End Use, 2016 to 2033
Table 96: Oceania Jerry Cans Market Volume (Units) Forecast by End Use, 2016 to 2033
Table 97: USA Jerry Cans Market Value (US$ Billion) Forecast by Material Type, Capacity, End-Use, Region, and End Use (2023(E) & 2033(F))
Table 98: Canada Jerry Cans Market Value (US$ Billion) Forecast by Material Type, Capacity, End-Use, Region, and End Use (2023(E) & 2033(F))
Table 100: Brazil Jerry Cans Market Value (US$ Billion) Forecast by Material Type, Capacity, End-Use, Region, and End Use (2023(E) & 2033(F))
Table 101: Mexico Jerry Cans Market Value (US$ Billion) Forecast by Material Type, Capacity, End-Use, Region, and End Use (2023(E) & 2033(F))
Table 102: Germany Jerry Cans Market Value (US$ Billion) Forecast by Material Type, Capacity, End-Use, Region, and End Use (2023(E) & 2033(F))
Table 103: Italy Jerry Cans Market Value (US$ Billion) Forecast by Material Type, Capacity, End-Use, Region, and End Use (2023(E) & 2033(F))
Table 104: France Jerry Cans Market Value (US$ Billion) Forecast by Material Type, Capacity, End-Use, Region, and End Use (2023(E) & 2033(F))
Table 105: Spain Jerry Cans Market Value (US$ Billion) Forecast by Material Type, Capacity, End-Use, Region, and End Use (2023(E) & 2033(F))
Table 106: United Kingdom Jerry Cans Market Value (US$ Billion) Forecast by Material Type, Capacity, End-Use, Region, and End Use (2023(E) & 2033(F))
Table 107: China Jerry Cans Market Value (US$ Billion) Forecast by Material Type, Capacity, End-Use, Region, and End Use (2023(E) & 2033(F))
Table 108: Japan Jerry Cans Market Value (US$ Billion) Forecast by Material Type, Capacity, End-Use, Region, and End Use (2023(E) & 2033(F))
Table 109: India Jerry Cans Market Value (US$ Billion) Forecast by Material Type, Capacity, End-Use, Region, and End Use (2023(E) & 2033(F))
Table 110: Australia & New Zealand Jerry Cans Market Value (US$ Billion) Forecast by Material Type, Capacity, End-Use, Region, and End Use (2023(E) & 2033(F))
Table 111: GCC Countries Jerry Cans Market Value (US$ Billion) Forecast by Material Type, Capacity, End-Use, Region, and End Use (2023(E) & 2033(F))
Table 112: South Africa Jerry Cans Market Value (US$ Billion) Forecast by Material Type, Capacity, End-Use, Region, and End Use (2023(E) & 2033(F))
Figure 01: Global Jerry Cans Market Value (US$ Billion) by Material Type, 2023 to 2033
Figure 02: Global Jerry Cans Market Value (US$ Billion) by Capacity, 2023 to 2033
Figure 03: Global Jerry Cans Market Value (US$ Billion) by End-Use, 2023 to 2033
Figure 04: Global Jerry Cans Market Value (US$ Billion) by Region, 2023 to 2033
Figure 06: Global Jerry Cans Market Value (US$ Billion) Analysis by Region, 2016 to 2022
Figure 07: Global Jerry Cans Market Volume (Units) Analysis by Region, 2016 to 2033
Figure 08: Global Jerry Cans Market Value Share (%) and BPS Analysis by Region, 2023 to 2033
Figure 09: Global Jerry Cans Market Y-o-Y Growth (%) Projections by Region, 2023 to 2033
Figure 10: Global Jerry Cans Market Value (US$ Billion) Analysis by Material Type, 2016 to 2022
Figure 11: Global Jerry Cans Market Volume (Units) Analysis by Material Type, 2016 to 2033
Figure 12: Global Jerry Cans Market Value Share (%) and BPS Analysis by Material Type, 2023 to 2033
Figure 13: Global Jerry Cans Market Y-o-Y Growth (%) Projections by Material Type, 2023 to 2033
Figure 14: Global Jerry Cans Market Value (US$ Billion) Analysis by Capacity, 2016 to 2022
Figure 15: Global Jerry Cans Market Volume (Units) Analysis by Capacity, 2016 to 2033
Figure 16: Global Jerry Cans Market Value Share (%) and BPS Analysis by Capacity, 2023 to 2033
Figure 17: Global Jerry Cans Market Y-o-Y Growth (%) Projections by Capacity, 2023 to 2033
Figure 18: Global Jerry Cans Market Value (US$ Billion) Analysis by End-Use, 2016 to 2022
Figure 19: Global Jerry Cans Market Volume (Units) Analysis by End-Use, 2016 to 2033
Figure 20: Global Jerry Cans Market Value Share (%) and BPS Analysis by End-Use, 2023 to 2033
Figure 21: Global Jerry Cans Market Y-o-Y Growth (%) Projections by End-Use, 2023 to 2033
Figure 22: Global Jerry Cans Market Value (US$ Billion) Analysis by Region, 2016 to 2022
Figure 23: Global Jerry Cans Market Volume (Units) Analysis by Region, 2016 to 2033
Figure 24: Global Jerry Cans Market Value Share (%) and BPS Analysis by Region, 2023 to 2033
Figure 25: Global Jerry Cans Market Y-o-Y Growth (%) Projections by Region, 2023 to 2033
Figure 26: Global Jerry Cans Market Attractiveness by Material Type, 2023 to 2033
Figure 27: Global Jerry Cans Market Attractiveness by Capacity, 2023 to 2033
Figure 28: Global Jerry Cans Market Attractiveness by End-Use, 2023 to 2033
Figure 29: Global Jerry Cans Market Attractiveness by Region, 2023 to 2033
Figure 30: North America Jerry Cans Market Value (US$ Billion) by Material Type, 2023 to 2033
Figure 31: North America Jerry Cans Market Value (US$ Billion) by Capacity, 2023 to 2033
Figure 32: North America Jerry Cans Market Value (US$ Billion) by End-Use, 2023 to 2033
Figure 33: North America Jerry Cans Market Value (US$ Billion) by Region, 2023 to 2033
Figure 34: North America Jerry Cans Market Value (US$ Billion) by Country, 2023 to 2033
Figure 35: North America Jerry Cans Market Value (US$ Billion) Analysis by Country, 2016 to 2022
Figure 36: North America Jerry Cans Market Volume (Units) Analysis by Country, 2016 to 2033
Figure 37: North America Jerry Cans Market Value Share (%) and BPS Analysis by Country, 2023 to 2033
Figure 38: North America Jerry Cans Market Y-o-Y Growth (%) Projections by Country, 2023 to 2033
Figure 39: North America Jerry Cans Market Value (US$ Billion) Analysis by Material Type, 2016 to 2022
Figure 40: North America Jerry Cans Market Volume (Units) Analysis by Material Type, 2016 to 2033
Figure 41: North America Jerry Cans Market Value Share (%) and BPS Analysis by Material Type, 2023 to 2033
Figure 42: North America Jerry Cans Market Y-o-Y Growth (%) Projections by Material Type, 2023 to 2033
Figure 43: North America Jerry Cans Market Value (US$ Billion) Analysis by Capacity, 2016 to 2022
Figure 44: North America Jerry Cans Market Volume (Units) Analysis by Capacity, 2016 to 2033
Figure 45: North America Jerry Cans Market Value Share (%) and BPS Analysis by Capacity, 2023 to 2033
Figure 46: North America Jerry Cans Market Y-o-Y Growth (%) Projections by Capacity, 2023 to 2033
Figure 47: North America Jerry Cans Market Value (US$ Billion) Analysis by End-Use, 2016 to 2022
Figure 48: North America Jerry Cans Market Volume (Units) Analysis by End-Use, 2016 to 2033
Figure 49: North America Jerry Cans Market Value Share (%) and BPS Analysis by End-Use, 2023 to 2033
Figure 50: North America Jerry Cans Market Y-o-Y Growth (%) Projections by End-Use, 2023 to 2033
Figure 51: North America Jerry Cans Market Value (US$ Billion) Analysis by Region, 2016 to 2022
Figure 52: North America Jerry Cans Market Volume (Units) Analysis by Region, 2016 to 2033
Figure 53: North America Jerry Cans Market Value Share (%) and BPS Analysis by Region, 2023 to 2033
Figure 54: North America Jerry Cans Market Y-o-Y Growth (%) Projections by Region, 2023 to 2033
Figure 55: North America Jerry Cans Market Attractiveness by Material Type, 2023 to 2033
Figure 56: North America Jerry Cans Market Attractiveness by Capacity, 2023 to 2033
Figure 57: North America Jerry Cans Market Attractiveness by End-Use, 2023 to 2033
Figure 58: North America Jerry Cans Market Attractiveness by Region, 2023 to 2033
Figure 59: North America Jerry Cans Market Attractiveness by Country, 2023 to 2033
Figure 60: Latin America Jerry Cans Market Value (US$ Billion) by Material Type, 2023 to 2033
Figure 61: Latin America Jerry Cans Market Value (US$ Billion) by Capacity, 2023 to 2033
Figure 62: Latin America Jerry Cans Market Value (US$ Billion) by End-Use, 2023 to 2033
Figure 63: Latin America Jerry Cans Market Value (US$ Billion) by Region, 2023 to 2033
Figure 64: Latin America Jerry Cans Market Value (US$ Billion) by Country, 2023 to 2033
Figure 65: Latin America Jerry Cans Market Value (US$ Billion) Analysis by Country, 2016 to 2022
Figure 66: Latin America Jerry Cans Market Volume (Units) Analysis by Country, 2016 to 2033
Figure 67: Latin America Jerry Cans Market Value Share (%) and BPS Analysis by Country, 2023 to 2033
Figure 68: Latin America Jerry Cans Market Y-o-Y Growth (%) Projections by Country, 2023 to 2033
Figure 69: Latin America Jerry Cans Market Value (US$ Billion) Analysis by Material Type, 2016 to 2022
Figure 70: Latin America Jerry Cans Market Volume (Units) Analysis by Material Type, 2016 to 2033
Figure 71: Latin America Jerry Cans Market Value Share (%) and BPS Analysis by Material Type, 2023 to 2033
Figure 72: Latin America Jerry Cans Market Y-o-Y Growth (%) Projections by Material Type, 2023 to 2033
Figure 73: Latin America Jerry Cans Market Value (US$ Billion) Analysis by Capacity, 2016 to 2022
Figure 74: Latin America Jerry Cans Market Volume (Units) Analysis by Capacity, 2016 to 2033
Figure 75: Latin America Jerry Cans Market Value Share (%) and BPS Analysis by Capacity, 2023 to 2033
Figure 76: Latin America Jerry Cans Market Y-o-Y Growth (%) Projections by Capacity, 2023 to 2033
Figure 77: Latin America Jerry Cans Market Value (US$ Billion) Analysis by End-Use, 2016 to 2022
Figure 78: Latin America Jerry Cans Market Volume (Units) Analysis by End-Use, 2016 to 2033
Figure 79: Latin America Jerry Cans Market Value Share (%) and BPS Analysis by End-Use, 2023 to 2033
Figure 80: Latin America Jerry Cans Market Y-o-Y Growth (%) Projections by End-Use, 2023 to 2033
Figure 81: Latin America Jerry Cans Market Value (US$ Billion) Analysis by Region, 2016 to 2022
Figure 82: Latin America Jerry Cans Market Volume (Units) Analysis by Region, 2016 to 2033
Figure 83: Latin America Jerry Cans Market Value Share (%) and BPS Analysis by Region, 2023 to 2033
Figure 84: Latin America Jerry Cans Market Y-o-Y Growth (%) Projections by Region, 2023 to 2033
Figure 85: Latin America Jerry Cans Market Attractiveness by Material Type, 2023 to 2033
Figure 86: Latin America Jerry Cans Market Attractiveness by Capacity, 2023 to 2033
Figure 87: Latin America Jerry Cans Market Attractiveness by End-Use, 2023 to 2033
Figure 88: Latin America Jerry Cans Market Attractiveness by Region, 2023 to 2033
Figure 89: Latin America Jerry Cans Market Attractiveness by Country, 2023 to 2033
Figure 90: Europe Jerry Cans Market Value (US$ Billion) by Material Type, 2023 to 2033
Figure 91: Europe Jerry Cans Market Value (US$ Billion) by Capacity, 2023 to 2033
Figure 92: Europe Jerry Cans Market Value (US$ Billion) by End-Use, 2023 to 2033
Figure 93: Europe Jerry Cans Market Value (US$ Billion) by Region, 2023 to 2033
Figure 94: Europe Jerry Cans Market Value (US$ Billion) by Country, 2023 to 2033
Figure 95: Europe Jerry Cans Market Value (US$ Billion) Analysis by Country, 2016 to 2022
Figure 96: Europe Jerry Cans Market Volume (Units) Analysis by Country, 2016 to 2033
Figure 97: Europe Jerry Cans Market Value Share (%) and BPS Analysis by Country, 2023 to 2033
Figure 98: Europe Jerry Cans Market Y-o-Y Growth (%) Projections by Country, 2023 to 2033
Figure 99: Europe Jerry Cans Market Value (US$ Billion) Analysis by Material Type, 2016 to 2022
Figure 100: Europe Jerry Cans Market Volume (Units) Analysis by Material Type, 2016 to 2033
Figure 101: Europe Jerry Cans Market Value Share (%) and BPS Analysis by Material Type, 2023 to 2033
Figure 102: Europe Jerry Cans Market Y-o-Y Growth (%) Projections by Material Type, 2023 to 2033
Figure 103: Europe Jerry Cans Market Value (US$ Billion) Analysis by Capacity, 2016 to 2022
Figure 104: Europe Jerry Cans Market Volume (Units) Analysis by Capacity, 2016 to 2033
Figure 105: Europe Jerry Cans Market Value Share (%) and BPS Analysis by Capacity, 2023 to 2033
Figure 106: Europe Jerry Cans Market Y-o-Y Growth (%) Projections by Capacity, 2023 to 2033
Figure 107: Europe Jerry Cans Market Value (US$ Billion) Analysis by End-Use, 2016 to 2022
Figure 108: Europe Jerry Cans Market Volume (Units) Analysis by End-Use, 2016 to 2033
Figure 109: Europe Jerry Cans Market Value Share (%) and BPS Analysis by End-Use, 2023 to 2033
Figure 110: Europe Jerry Cans Market Y-o-Y Growth (%) Projections by End-Use, 2023 to 2033
Figure 111: Europe Jerry Cans Market Value (US$ Billion) Analysis by Region, 2016 to 2022
Figure 112: Europe Jerry Cans Market Volume (Units) Analysis by Region, 2016 to 2033
Figure 113: Europe Jerry Cans Market Value Share (%) and BPS Analysis by Region, 2023 to 2033
Figure 114: Europe Jerry Cans Market Y-o-Y Growth (%) Projections by Region, 2023 to 2033
Figure 115: Europe Jerry Cans Market Attractiveness by Material Type, 2023 to 2033
Figure 116: Europe Jerry Cans Market Attractiveness by Capacity, 2023 to 2033
Figure 117: Europe Jerry Cans Market Attractiveness by End-Use, 2023 to 2033
Figure 118: Europe Jerry Cans Market Attractiveness by Region, 2023 to 2033
Figure 119: Europe Jerry Cans Market Attractiveness by Country, 2023 to 2033
Figure 120: MEA Jerry Cans Market Value (US$ Billion) by Material Type, 2023 to 2033
Figure 121: MEA Jerry Cans Market Value (US$ Billion) by Capacity, 2023 to 2033
Figure 122: MEA Jerry Cans Market Value (US$ Billion) by End-Use, 2023 to 2033
Figure 123: MEA Jerry Cans Market Value (US$ Billion) by Region, 2023 to 2033
Figure 124: MEA Jerry Cans Market Value (US$ Billion) by Country, 2023 to 2033
Figure 125: MEA Jerry Cans Market Value (US$ Billion) Analysis by Country, 2016 to 2022
Figure 126: MEA Jerry Cans Market Volume (Units) Analysis by Country, 2016 to 2033
Figure 127: MEA Jerry Cans Market Value Share (%) and BPS Analysis by Country, 2023 to 2033
Figure 128: MEA Jerry Cans Market Y-o-Y Growth (%) Projections by Country, 2023 to 2033
Figure 129: MEA Jerry Cans Market Value (US$ Billion) Analysis by Material Type, 2016 to 2022
Figure 130: MEA Jerry Cans Market Volume (Units) Analysis by Material Type, 2016 to 2033
Figure 131: MEA Jerry Cans Market Value Share (%) and BPS Analysis by Material Type, 2023 to 2033
Figure 132: MEA Jerry Cans Market Y-o-Y Growth (%) Projections by Material Type, 2023 to 2033
Figure 133: MEA Jerry Cans Market Value (US$ Billion) Analysis by Capacity, 2016 to 2022
Figure 134: MEA Jerry Cans Market Volume (Units) Analysis by Capacity, 2016 to 2033
Figure 135: MEA Jerry Cans Market Value Share (%) and BPS Analysis by Capacity, 2023 to 2033
Figure 136: MEA Jerry Cans Market Y-o-Y Growth (%) Projections by Capacity, 2023 to 2033
Figure 137: MEA Jerry Cans Market Value (US$ Billion) Analysis by End-Use, 2016 to 2022
Figure 138: MEA Jerry Cans Market Volume (Units) Analysis by End-Use, 2016 to 2033
Figure 139: MEA Jerry Cans Market Value Share (%) and BPS Analysis by End-Use, 2023 to 2033
Figure 140: MEA Jerry Cans Market Y-o-Y Growth (%) Projections by End-Use, 2023 to 2033
Figure 141: MEA Jerry Cans Market Value (US$ Billion) Analysis by Region, 2016 to 2022
Figure 142: MEA Jerry Cans Market Volume (Units) Analysis by Region, 2016 to 2033
Figure 143: MEA Jerry Cans Market Value Share (%) and BPS Analysis by Region, 2023 to 2033
Figure 144 MEA Jerry Cans Market Y-o-Y Growth (%) Projections by Region, 2023 to 2033
Figure 145: MEA Jerry Cans Market Attractiveness by Material Type, 2023 to 2033
Figure 146: MEA Jerry Cans Market Attractiveness by Capacity, 2023 to 2033
Figure 147: MEA Jerry Cans Market Attractiveness by End-Use, 2023 to 2033
Figure 148: MEA Jerry Cans Market Attractiveness by Region, 2023 to 2033
Figure 149: MEA Jerry Cans Market Attractiveness by Country, 2023 to 2033
Figure 150: East Asia Jerry Cans Market Value (US$ Billion) by Material Type, 2023 to 2033
Figure 151: East Asia Jerry Cans Market Value (US$ Billion) by Capacity, 2023 to 2033
Figure 152: East Asia Jerry Cans Market Value (US$ Billion) by End-Use, 2023 to 2033
Figure 153: East Asia Jerry Cans Market Value (US$ Billion) by Region, 2023 to 2033
Figure 154: East Asia Jerry Cans Market Value (US$ Billion) by Country, 2023 to 2033
Figure 155: East Asia Jerry Cans Market Value (US$ Billion) Analysis by Country, 2016 to 2022
Figure 156: East Asia Jerry Cans Market Volume (Units) Analysis by Country, 2016 to 2033
Figure 157: East Asia Jerry Cans Market Value Share (%) and BPS Analysis by Country, 2023 to 2033
Figure 158: East Asia Jerry Cans Market Y-o-Y Growth (%) Projections by Country, 2023 to 2033
Figure 159: East Asia Jerry Cans Market Value (US$ Billion) Analysis by Material Type, 2016 to 2022
Figure 160: East Asia Jerry Cans Market Volume (Units) Analysis by Material Type, 2016 to 2033
Figure 161: East Asia Jerry Cans Market Value Share (%) and BPS Analysis by Material Type, 2023 to 2033
Figure 162: East Asia Jerry Cans Market Y-o-Y Growth (%) Projections by Material Type, 2023 to 2033
Figure 163: East Asia Jerry Cans Market Value (US$ Billion) Analysis by Capacity, 2016 to 2022
Figure 164: East Asia Jerry Cans Market Volume (Units) Analysis by Capacity, 2016 to 2033
Figure 165: East Asia Jerry Cans Market Value Share (%) and BPS Analysis by Capacity, 2023 to 2033
Figure 166: East Asia Jerry Cans Market Y-o-Y Growth (%) Projections by Capacity, 2023 to 2033
Figure 167: East Asia Jerry Cans Market Value (US$ Billion) Analysis by End-Use, 2016 to 2022
Figure 168: East Asia Jerry Cans Market Volume (Units) Analysis by End-Use, 2016 to 2033
Figure 169: East Asia Jerry Cans Market Value Share (%) and BPS Analysis by End-Use, 2023 to 2033
Figure 170: East Asia Jerry Cans Market Y-o-Y Growth (%) Projections by End-Use, 2023 to 2033
Figure 171: East Asia Jerry Cans Market Value (US$ Billion) Analysis by Region, 2016 to 2022
Figure 172: East Asia Jerry Cans Market Volume (Units) Analysis by Region, 2016 to 2033
Figure 173: East Asia Jerry Cans Market Value Share (%) and BPS Analysis by Region, 2023 to 2033
Figure 174: East Asia Jerry Cans Market Y-o-Y Growth (%) Projections by Region, 2023 to 2033
Figure 175: East Asia Jerry Cans Market Attractiveness by Material Type, 2023 to 2033
Figure 176: East Asia Jerry Cans Market Attractiveness by Capacity, 2023 to 2033
Figure 177: East Asia Jerry Cans Market Attractiveness by End-Use, 2023 to 2033
Figure 178: East Asia Jerry Cans Market Attractiveness by Region, 2023 to 2033
Figure 179: East Asia Jerry Cans Market Attractiveness by Country, 2023 to 2033
Figure 180: South Asia & Pacific Jerry Cans Market Value (US$ Billion) by Material Type, 2023 to 2033
Figure 181: South Asia & Pacific Jerry Cans Market Value (US$ Billion) by Capacity, 2023 to 2033
Figure 182: South Asia & Pacific Jerry Cans Market Value (US$ Billion) by End-Use, 2023 to 2033
Figure 183: South Asia & Pacific Jerry Cans Market Value (US$ Billion) by Region, 2023 to 2033
Figure 184: South Asia & Pacific Jerry Cans Market Value (US$ Billion) by Country, 2023 to 2033
Figure 185: South Asia & Pacific Jerry Cans Market Value (US$ Billion) Analysis by Country, 2016 to 2022
Figure 186: South Asia & Pacific Jerry Cans Market Volume (Units) Analysis by Country, 2016 to 2033
Figure 187: South Asia & Pacific Jerry Cans Market Value Share (%) and BPS Analysis by Country, 2023 to 2033
Figure 188: South Asia & Pacific Jerry Cans Market Y-o-Y Growth (%) Projections by Country, 2023 to 2033
Figure 189: South Asia & Pacific Jerry Cans Market Value (US$ Billion) Analysis by Material Type, 2016 to 2022
Figure 190: South Asia & Pacific Jerry Cans Market Volume (Units) Analysis by Material Type, 2016 to 2033
Figure 191: South Asia & Pacific Jerry Cans Market Value Share (%) and BPS Analysis by Material Type, 2023 to 2033
Figure 192: South Asia & Pacific Jerry Cans Market Y-o-Y Growth (%) Projections by Material Type, 2023 to 2033
Figure 193: South Asia & Pacific Jerry Cans Market Value (US$ Billion) Analysis by Capacity, 2016 to 2022
Figure 194: South Asia & Pacific Jerry Cans Market Volume (Units) Analysis by Capacity, 2016 to 2033
Figure 195: South Asia & Pacific Jerry Cans Market Value Share (%) and BPS Analysis by Capacity, 2023 to 2033
Figure 196: South Asia & Pacific Jerry Cans Market Y-o-Y Growth (%) Projections by Capacity, 2023 to 2033
Figure 197: South Asia & Pacific Jerry Cans Market Value (US$ Billion) Analysis by End-Use, 2016 to 2022
Figure 198: South Asia & Pacific Jerry Cans Market Volume (Units) Analysis by End-Use, 2016 to 2033
Figure 199: South Asia & Pacific Jerry Cans Market Value Share (%) and BPS Analysis by End-Use, 2023 to 2033
Figure 200: South Asia & Pacific Jerry Cans Market Y-o-Y Growth (%) Projections by End-Use, 2023 to 2033
Figure 201: South Asia & Pacific Jerry Cans Market Value (US$ Billion) Analysis by Region, 2016 to 2022
Figure 202: South Asia & Pacific Jerry Cans Market Volume (Units) Analysis by Region, 2016 to 2033
Figure 203: South Asia & Pacific Jerry Cans Market Value Share (%) and BPS Analysis by Region, 2023 to 2033
Figure 204: South Asia & Pacific Jerry Cans Market Y-o-Y Growth (%) Projections by Region, 2023 to 2033
Figure 205: South Asia & Pacific Jerry Cans Market Attractiveness by Material Type, 2023 to 2033
Figure 206: South Asia & Pacific Jerry Cans Market Attractiveness by Capacity, 2023 to 2033
Figure 207: South Asia & Pacific Jerry Cans Market Attractiveness by End-Use, 2023 to 2033
Figure 208: South Asia & Pacific Jerry Cans Market Attractiveness by Region, 2023 to 2033
Figure 209: South Asia & Pacific Jerry Cans Market Attractiveness by Country, 2023 to 2033
Figure 210: Oceania Jerry Cans Market Value (US$ Billion) by Material Type, 2023 to 2033
Figure 211: Oceania Jerry Cans Market Value (US$ Billion) by Capacity, 2023 to 2033
Figure 212: Oceania Jerry Cans Market Value (US$ Billion) by End-Use, 2023 to 2033
Figure 213: Oceania Jerry Cans Market Value (US$ Billion) by Region, 2023 to 2033
Figure 214: Oceania Jerry Cans Market Value (US$ Billion) by Country, 2023 to 2033
Figure 215: Oceania Jerry Cans Market Value (US$ Billion) Analysis by Country, 2016 to 2022
Figure 216: Oceania Jerry Cans Market Volume (Units) Analysis by Country, 2016 to 2033
Figure 217: Oceania Jerry Cans Market Value Share (%) and BPS Analysis by Country, 2023 to 2033
Figure 218: Oceania Jerry Cans Market Y-o-Y Growth (%) Projections by Country, 2023 to 2033
Figure 219: Oceania Jerry Cans Market Value (US$ Billion) Analysis by Material Type, 2016 to 2022
Figure 220: Oceania Jerry Cans Market Volume (Units) Analysis by Material Type, 2016 to 2033
Figure 221: Oceania Jerry Cans Market Value Share (%) and BPS Analysis by Material Type, 2023 to 2033
Figure 222: Oceania Jerry Cans Market Y-o-Y Growth (%) Projections by Material Type, 2023 to 2033
Figure 223: Oceania Jerry Cans Market Value (US$ Billion) Analysis by Capacity, 2016 to 2022
Figure 224: Oceania Jerry Cans Market Volume (Units) Analysis by Capacity, 2016 to 2033
Figure 225: Oceania Jerry Cans Market Value Share (%) and BPS Analysis by Capacity, 2023 to 2033
Figure 226: Oceania Jerry Cans Market Y-o-Y Growth (%) Projections by Capacity, 2023 to 2033
Figure 227: Oceania Jerry Cans Market Value (US$ Billion) Analysis by End-Use, 2016 to 2022
Figure 228: Oceania Jerry Cans Market Volume (Units) Analysis by End-Use, 2016 to 2033
Figure 229: Oceania Jerry Cans Market Value Share (%) and BPS Analysis by End-Use, 2023 to 2033
Figure 230: Oceania Jerry Cans Market Y-o-Y Growth (%) Projections by End-Use, 2023 to 2033
Figure 231: Oceania Jerry Cans Market Value (US$ Billion) Analysis by Region, 2016 to 2022
Figure 232: Oceania Jerry Cans Market Volume (Units) Analysis by Region, 2016 to 2033
Figure 233: Oceania Jerry Cans Market Value Share (%) and BPS Analysis by Region, 2023 to 2033
Figure 234: Oceania Jerry Cans Market Y-o-Y Growth (%) Projections by Region, 2023 to 2033
Figure 235: Oceania Jerry Cans Market Attractiveness by Material Type, 2023 to 2033
Figure 236: Oceania Jerry Cans Market Attractiveness by Capacity, 2023 to 2033
Figure 237: Oceania Jerry Cans Market Attractiveness by End-Use, 2023 to 2033
Figure 238: Oceania Jerry Cans Market Attractiveness by Region, 2023 to 2033
Figure 239: Oceania Jerry Cans Market Attractiveness by Country, 2023 to 2033
The overall market size for the Jerry Cans Market was USD 2.5 Billion in 2025.
The Jerry Cans Market is expected to reach USD 3.9 Billion in 2035.
The market will be driven by increasing demand from automotive, chemical, agriculture, and food & beverage industries. Advancements in reinforced jerry cans, tamper-proof lids, and digital tracking systems will further boost market growth.
Key challenges include fluctuating raw material costs, environmental concerns related to plastic waste, and compliance with safety regulations. However, innovations in bio-based materials, anti-spill designs, and AI-driven quality control are addressing these challenges.
Asia-Pacific is expected to dominate due to rapid industrialization, growing automotive production, and increasing trade activities. North America and Europe are also key markets due to stringent regulatory policies promoting safe and sustainable liquid storage solutions.
Explore Packaging Formats Insights
Thank you!
You will receive an email from our Business Development Manager. Please be sure to check your SPAM/JUNK folder too.