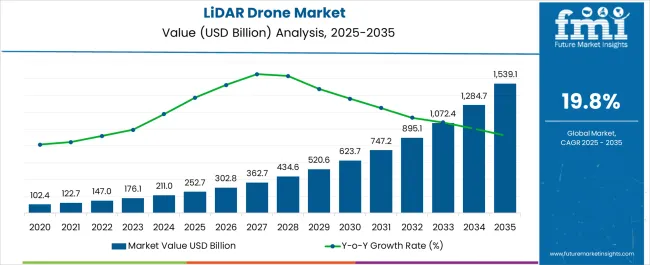
The global LiDAR drone market reached USD 114.3 million in 2021. Total LiDAR drone sales are set to rise at an impressive CAGR of 19.8% between 2022 to 2032. Overall size of the global market will reach around USD 892 million by the end of 2032.
In 2022, LiDAR drone market valuation reached USD 147.0 million. Demand in the market will remain particularly high for rotary wing LiDAR drones. The target segment is expected to expand at 19.7% over the next ten years (2022 to 2032).
Light Detection and Ranging (LiDAR) drones are types of drones specifically designed for carrying LiDAR sensors. They are used to collect data that can be utilized to make detailed 3D models for various applications and industries. LiDAR drones use light energy and advanced lasers to scan and measure any target from a distance
Initially, LiDAR sensors and LiDAR drones were reserved for specialized and well-funded projects. However, with easy availability of LiDAR sensors due to decreasing costs, aerial LIDAR technologies such as LiDAR drones are becoming common and popular.
LiDAR drones or LiDAR UAVs (unmanned aerial vehicles) are being extensively used for fast and efficient mapping. They allow mapping companies to overcome difficult terrain or hazardous locations.
Lidar drones are preferred over conventional surveying practices on account of their ability to produce exact data and 3D images in less time and at lower costs.
Growing applications across agriculture, mining, archaeology, forestry, and several other industries will fuel LiDAR drone sales during the assessment period.
In recent years, rise in food insecurity due to reduction in arable land and population growth has prompted farmers to shift towards precision farming/agriculture. This has created enormous devices for modern technologies including LIDAR drones and the trend is expected to continue over the next ten years.
Rising government initiatives and investments for farmers will further support expansion of LiDAR drone industry. Governments of several countries are putting efforts to support farmers. For instance, in June 2022, the Indian government announced that it will provide funding support to individuals and various Farmers Produce Organizations (FPOs).
The central government provides 40% financial support (up to Rs 4 Lakh) to support Custom Hiring Centres (CHCs) and FPOs for purchase of the drones. Another 50% (Rs 5 Lakh) is to be given for drone purchases to agriculture graduates in establishing CHCs. Such government initiatives are going to provide a booster for the growth of LIDAR drone market.
North America will continue to remain at the epicenter of LiDAR drone market during the forecast period. North America market reached USD 59.09 million in 2022. By 2032, North America market is set to attain a valuation of USD 358.58 million.
Growing popularity of LiDAR drones across the United States and strong presence of leading companies are driving North America market.
The United States has made great progress in LiDAR drone technology during the last few years. It has made rules and regulations to promote growth of LiDAR drones and UAVs in the nation.
The country is home to several drone-making companies such as Phoenix LiDAR systems, LIDARUSA, and Velodyne LiDAR Inc, which are researching in areas such as high-altitude drone technology, high-resolution scanning cameras, low-weight sensors for lightweight-payload drones. This research will help drones-technology make faster progress in high altitude scanning of large areas and will make payloads lighter.
The Department of Defence (DoD) of the United States recently allocated USD 7.5 billion for drone purchases, research and development of high-tech drones, and their constructions. This will make sure the United States will see large growth in use of drones in military applications.
Asia pacific lidar drone market will also witness significant growth during the next ten years. Rapid shift towards precision agriculture, favorable government support, increasing mining activities, and adoption of advanced surveying technologies are driving Asia Pacific market.
Attributes | Key Insights |
---|---|
LiDAR Drone Market Size (2022) | USD 147 million |
Projected Market Size (2032) | USD 892 million |
Value-based CAGR (2022 to 2032) | 19.8% |
USA Market CAGR (2022 to 2032) | 17.9% |
As per Future Market Insights (FMI), global sales of LiDAR drones increased at a CAGR of 27.7% from 2017 to 2021. For the assessment period (2022 to 2032), LiDAR drone demand will accelerate at 19.8% CAGR. This will create an absolute $ opportunity of USD 745 million by the end of 2032.
LiDAR drones are used in agriculture, accident incidents, archaeology, mining, forestry, insurance, and inspection applications. These drones use ultraviolet lights and thus can be used during nights as well when the light available is poor.
They can easily capture and produce accurate 3D maps of the places they are sent to scan and give us minute details of the place. This helps in gathering exact information about the places where accidents have taken place and can help in sending necessary help during an emergency.
Exact depiction of accident places can be done using such drones and such evidence can be used in courts to show the potential reasons and impacts of accidents.
Drones, specifically LiDAR drones, are extensively being used in the mining industry to make the workflow smooth and avoid accidents. For instance, in August 2022, Central Mining Planning and Design Institute (CMPDI) announced that they have started to assess the wider rollout of drones in their mining operations.
The underground fires and waterlogging which have been common issues in this industry will be tackled by the use of drones. Besides, with the usage of drones, analysis of situations through the high-resolution photographs taken by drones will further enable the authority to make wise decisions.
CMPDI also mentioned that they have recently purchased two drones for surveillance, with the presence of mines with over 600 million coal production per year. The adoption of LiDAR drones by CMPDI and other mining companies is likely to swell in the next ten years.
Growing applications in archaeological research will elevate LiDAR drone demand during the assessment period. LiDAR drones are being increasingly utilized during archaeological research and surveys due to their efficient nature.
For instance, in August 2022, a group of 14 students of Embry-Riddle Aeronautical University that went to New Mexico and Arizona to work with archaeologists in mapping ancient cities, used drones to map- locations that were inhabited 4000 years ago.
The students’ team identified a reservoir system and prehistoric canals, which are believed to support a population of nearly 10,000 in Safford, Arizona. They searched for irrigation systems and farmlands near Tularosa, which was inhabited from 450 A.D. to 650 A.D.
Man’s growing desire to search for locations that used to exist hundreds of years ago will act as a catalyst triggering LiDAR drone sales through 203.2 Besides, increasing applications in agriculture industry will create lucrative opportunities for LiDAR drone manufacturers.
Laser technology is used in LiDAR drones. In comparison to photogrammetric systems, laser technology is expensive. Photogrammetric systems are easily available and are of low cost.
For instance, a photogrammetric system costs USD 20 to 30K and on the other hand, the manned LiDAR drone costs nearly USD 150K, whereas an unmanned LiDAR drone costs from USD 145K to USD 180K.
Hence, rising popularity of photogrammetric system drones due to their low cost will act as an impediment to the expansion of LiDAR drones’ industry.
Besides this, strict rules and regulations governing the usage of drones and lack of skilled professionals are negatively influencing the market.
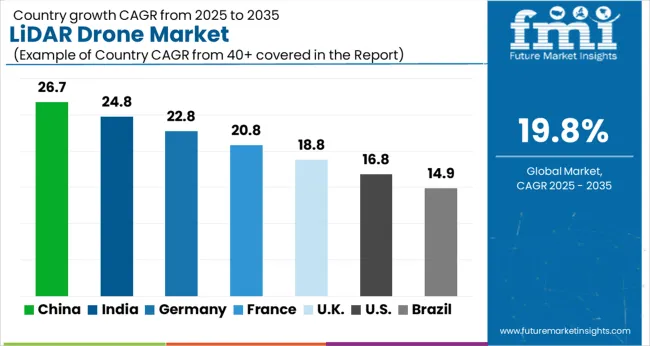
Country | United States |
---|---|
Projected CAGR (2022 to 2032) | 17.9% |
Historical CAGR (2017 to 2021) | 24.8% |
Market Value (2032) | USD 258.2 million |
Country | United Kingdom |
---|---|
Projected CAGR (2022 to 2032) | 18.8% |
Historical CAGR (2017 to 2021) | 26.1% |
Market Value (2032) | USD 41.4 million |
Country | China |
---|---|
Projected CAGR (2022 to 2032) | 20.8% |
Historical CAGR (2017 to 2021) | 29.5% |
Market Value (2032) | USD 73.9 million |
Country | Japan |
---|---|
Projected CAGR (2022 to 2032) | 19.1% |
Historical CAGR (2017 to 2021) | 26.8% |
Market Value (2032) | USD 62.4 million |
Country | South Korea |
---|---|
Projected CAGR (2022 to 2032) | 20.2% |
Historical CAGR (2017 to 2021) | 28.6% |
Market Value (2032) | USD 34.8 million |
Heavy Presence of LiDAR Drone Companies Boosting the USA Market
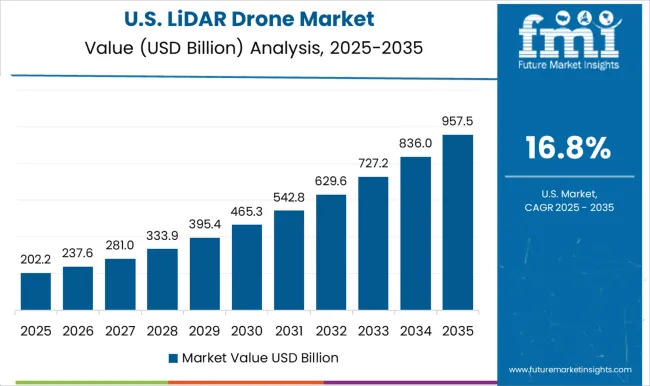
The United States lies at the center stage of LiDAR drone revenue growth. As per Future Market Insights, the United States LiDAR drone market size will reach USD 258.2 million by 2032.
Overall LiDAR drone sales across the USA are forecast to rise at 17.9% CAGR through 2032. Between 2022 and 2032, the United States market is set to create an absolute $ opportunity of USD 208.5 million. The USA LiDAR drone market expanded at a CAGR of 24.8% from 2017 to 2022.
Rising application of LiDAR drones in mining, agriculture, inspections, law enforcement, and archaeology is driving the United States market.
Large presence of leading LiDAR drone manufacturing companies is also boosting the USA market. The United States is home to companies such as Velodyne Inc., LIDARUSA, Phoenix LiDAR systems, and GeoCue Group which are doing research and development in commercial UAV LiDAR mapping solutions, drones mounting on multi-platforms such as aircraft and vehicles.
Besides this, several start-ups are showing inclination towards entering this market due to increasing demand for LiDAR technology from various fields.
Rotary Wing Drone Remains Top Selling Type
As per the drone type, demand for rotary-wing drones is likely to remain high in the global market. FMI predicts rotary wing LiDAR drone segment to expand at 19.7% CAGR through 2032. Between 2017 and 2021, rotary-wing LiDAR drone demand grew at 27.6% CAGR.
Rising adoption of rotary wing drones due to their several advantages is driving growth of the target segment. Generally, a rotary wing drone has 4 rotors and these rotors help in controlling the motion of the drone using propellers. This gives rotary-wing drones an edge over fixed-wing to land in any area and helps in maneuverability.
Rotary wing drones are also cost-effective as compared to fixed wing LiDAR drones. For instance, cost of fixed wing drone is around USD 250,000 whereas a rotary wing drone costs around USD 100,000.
Thus, such cost- effective rotary-wing drones are essential in surveillance of mining and agricultural industries where drones are required to fly at lower heights and work in a confined area.
Key advantages of rotary-wing drones
Take less time to set up, take off, and land
Topography LiDAR to be the Most Lucrative Type
Topographic LiDAR drones are expected to remain the most lucrative type through 2032. Topographic LiDAR segment witnessed a CAGR of 27.5% from 2017 to 2021. Between 2022 to 2032, it will expand at 17.6% CAGR.
Topographic LiDAR drones are used in mining work, civil engineering, road operations, road construction, and corridor mapping. This type of LiDAR is the most revenue-generating segment because of its applications in mining, agricultural and road-transport industries.
Topographic LiDAR drones have an edge over bathymetric LiDAR drones as they can cover large land areas. Thanks to this feature, they are used in urban planning and geomorphology.
Topographic LiDAR is useful to map surface terrain, whether it’s mountain ranges, forests, or cityscapes For instance, In October 2022, in Bia?owie?a forest in Poland, more than 800 ancient monuments were found using Topographic LiDAR Drones. The survey was conducted by a team of scientists and archaeologists from the Institute of Archaeology of Cardinal Stefan Wyszynski University in Warsaw.
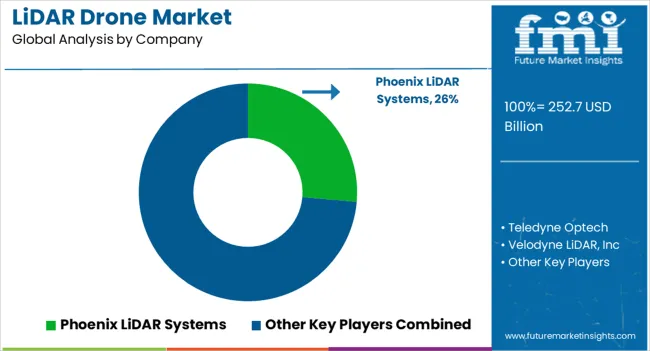
Key LiDAR drone companies operating in the market include SZ DJI Technology company ltd, Velodyne LiDAR Inc, Phoenix LiDAR Systems, Teledyne Optech, Sick AG, Trimble Navigation Ltd, Leica Geosystems AG, Faro Technology, and Riegl Measurement System.
New product launches with innovative designs and intensive research and development activities are key strategies adopted by companies. Besides this, leading LiDAR drone manufacturers are using merger and collaboration strategy to gain an upper hand in the market.
Recent Developments
Attribute | Details |
---|---|
Estimated Market Size (2022) | USD 147.0 million |
Projected Market Size (2032) | USD 892.0 million |
Anticipated Growth Rate (2022 to 2032) | 19.8% CAGR |
Forecast Period | 2022 to 2032 |
Historical Data Available for | 2017 to 2021 |
Market Analysis | USD Million for Value and MT for Volume |
Key Regions Covered | North America; Latin America; Europe; Asia Pacific; and the Middle East & Africa |
Key Countries Covered | United States, Canada, Brazil, Mexico, Germany, United Kingdom, France, Italy, Spain, Nordic, Russia, Poland, China, India, Thailand, Indonesia, Australia and New Zealand, Japan, GCC countries, North Africa, South Africa, and others. |
Key Segments Covered | LiDAR Type, Components, Drone Type, Range, Application, and Region |
Key Companies Profiled | Phoenix LiDAR Systems; Teledyne Optech; Velodyne LiDAR Inc; SZ DJI Technology company ltd; Sick AG; Trimble Navigation Ltd; Faro Technology; Riegl Measurement System; Leica Geosystems AG; 3D Robotics Inc; MicroDrones |
Report Coverage | Market Forecast, Company Share Analysis, Competition Intelligence, Drivers Restraints Opportunity Trends Analysis, Market Dynamics and Challenges, and Strategic Growth Initiatives |
Table 1: Global Market Value (US$ Million) Forecast by Region, 2017 to 2032
Table 2: Global Market Volume (Unit) Forecast by Region, 2017 to 2032
Table 3: Global Market Value (US$ Million) Forecast by LiDAR Type, 2017 to 2032
Table 4: Global Market Volume (Unit) Forecast by LiDAR Type, 2017 to 2032
Table 5: Global Market Value (US$ Million) Forecast by Component, 2017 to 2032
Table 6: Global Market Volume (Unit) Forecast by Component, 2017 to 2032
Table 7: Global Market Value (US$ Million) Forecast by Drone Type, 2017 to 2032
Table 8: Global Market Volume (Unit) Forecast by Drone Type, 2017 to 2032
Table 9: Global Market Value (US$ Million) Forecast by Range, 2017 to 2032
Table 10: Global Market Volume (Unit) Forecast by Range, 2017 to 2032
Table 11: Global Market Value (US$ Million) Forecast by Application, 2017 to 2032
Table 12: Global Market Volume (Unit) Forecast by Application, 2017 to 2032
Table 13: North America Market Value (US$ Million) Forecast by Country, 2017 to 2032
Table 14: North America Market Volume (Unit) Forecast by Country, 2017 to 2032
Table 15: North America Market Value (US$ Million) Forecast by LiDAR Type, 2017 to 2032
Table 16: North America Market Volume (Unit) Forecast by LiDAR Type, 2017 to 2032
Table 17: North America Market Value (US$ Million) Forecast by Component, 2017 to 2032
Table 18: North America Market Volume (Unit) Forecast by Component, 2017 to 2032
Table 19: North America Market Value (US$ Million) Forecast by Drone Type, 2017 to 2032
Table 20: North America Market Volume (Unit) Forecast by Drone Type, 2017 to 2032
Table 21: North America Market Value (US$ Million) Forecast by Range, 2017 to 2032
Table 22: North America Market Volume (Unit) Forecast by Range, 2017 to 2032
Table 23: North America Market Value (US$ Million) Forecast by Application, 2017 to 2032
Table 24: North America Market Volume (Unit) Forecast by Application, 2017 to 2032
Table 25: Latin America Market Value (US$ Million) Forecast by Country, 2017 to 2032
Table 26: Latin America Market Volume (Unit) Forecast by Country, 2017 to 2032
Table 27: Latin America Market Value (US$ Million) Forecast by LiDAR Type, 2017 to 2032
Table 28: Latin America Market Volume (Unit) Forecast by LiDAR Type, 2017 to 2032
Table 29: Latin America Market Value (US$ Million) Forecast by Component, 2017 to 2032
Table 30: Latin America Market Volume (Unit) Forecast by Component, 2017 to 2032
Table 31: Latin America Market Value (US$ Million) Forecast by Drone Type, 2017 to 2032
Table 32: Latin America Market Volume (Unit) Forecast by Drone Type, 2017 to 2032
Table 33: Latin America Market Value (US$ Million) Forecast by Range, 2017 to 2032
Table 34: Latin America Market Volume (Unit) Forecast by Range, 2017 to 2032
Table 35: Latin America Market Value (US$ Million) Forecast by Application, 2017 to 2032
Table 36: Latin America Market Volume (Unit) Forecast by Application, 2017 to 2032
Table 37: Europe Market Value (US$ Million) Forecast by Country, 2017 to 2032
Table 38: Europe Market Volume (Unit) Forecast by Country, 2017 to 2032
Table 39: Europe Market Value (US$ Million) Forecast by LiDAR Type, 2017 to 2032
Table 40: Europe Market Volume (Unit) Forecast by LiDAR Type, 2017 to 2032
Table 41: Europe Market Value (US$ Million) Forecast by Component, 2017 to 2032
Table 42: Europe Market Volume (Unit) Forecast by Component, 2017 to 2032
Table 43: Europe Market Value (US$ Million) Forecast by Drone Type, 2017 to 2032
Table 44: Europe Market Volume (Unit) Forecast by Drone Type, 2017 to 2032
Table 45: Europe Market Value (US$ Million) Forecast by Range, 2017 to 2032
Table 46: Europe Market Volume (Unit) Forecast by Range, 2017 to 2032
Table 47: Europe Market Value (US$ Million) Forecast by Application, 2017 to 2032
Table 48: Europe Market Volume (Unit) Forecast by Application, 2017 to 2032
Table 49: Asia Pacific Market Value (US$ Million) Forecast by Country, 2017 to 2032
Table 50: Asia Pacific Market Volume (Unit) Forecast by Country, 2017 to 2032
Table 51: Asia Pacific Market Value (US$ Million) Forecast by LiDAR Type, 2017 to 2032
Table 52: Asia Pacific Market Volume (Unit) Forecast by LiDAR Type, 2017 to 2032
Table 53: Asia Pacific Market Value (US$ Million) Forecast by Component, 2017 to 2032
Table 54: Asia Pacific Market Volume (Unit) Forecast by Component, 2017 to 2032
Table 55: Asia Pacific Market Value (US$ Million) Forecast by Drone Type, 2017 to 2032
Table 56: Asia Pacific Market Volume (Unit) Forecast by Drone Type, 2017 to 2032
Table 57: Asia Pacific Market Value (US$ Million) Forecast by Range, 2017 to 2032
Table 58: Asia Pacific Market Volume (Unit) Forecast by Range, 2017 to 2032
Table 59: Asia Pacific Market Value (US$ Million) Forecast by Application, 2017 to 2032
Table 60: Asia Pacific Market Volume (Unit) Forecast by Application, 2017 to 2032
Table 61: Middle East & Africa Market Value (US$ Million) Forecast by Country, 2017 to 2032
Table 62: Middle East & Africa Market Volume (Unit) Forecast by Country, 2017 to 2032
Table 63: Middle East & Africa Market Value (US$ Million) Forecast by LiDAR Type, 2017 to 2032
Table 64: Middle East & Africa Market Volume (Unit) Forecast by LiDAR Type, 2017 to 2032
Table 65: Middle East & Africa Market Value (US$ Million) Forecast by Component, 2017 to 2032
Table 66: Middle East & Africa Market Volume (Unit) Forecast by Component, 2017 to 2032
Table 67: Middle East & Africa Market Value (US$ Million) Forecast by Drone Type, 2017 to 2032
Table 68: Middle East & Africa Market Volume (Unit) Forecast by Drone Type, 2017 to 2032
Table 69: Middle East & Africa Market Value (US$ Million) Forecast by Range, 2017 to 2032
Table 70: Middle East & Africa Market Volume (Unit) Forecast by Range, 2017 to 2032
Table 71: Middle East & Africa Market Value (US$ Million) Forecast by Application, 2017 to 2032
Table 72: Middle East & Africa Market Volume (Unit) Forecast by Application, 2017 to 2032
Figure 1: Global Market Value (US$ Million) by LiDAR Type, 2022 to 2032
Figure 2: Global Market Value (US$ Million) by Component, 2022 to 2032
Figure 3: Global Market Value (US$ Million) by Drone Type, 2022 to 2032
Figure 4: Global Market Value (US$ Million) by Range, 2022 to 2032
Figure 5: Global Market Value (US$ Million) by Application, 2022 to 2032
Figure 6: Global Market Value (US$ Million) by Region, 2022 to 2032
Figure 7: Global Market Value (US$ Million) Analysis by Region, 2017 to 2032
Figure 8: Global Market Volume (Unit) Analysis by Region, 2017 to 2032
Figure 9: Global Market Value Share (%) and BPS Analysis by Region, 2022 to 2032
Figure 10: Global Market Y-o-Y Growth (%) Projections by Region, 2022 to 2032
Figure 11: Global Market Value (US$ Million) Analysis by LiDAR Type, 2017 to 2032
Figure 12: Global Market Volume (Unit) Analysis by LiDAR Type, 2017 to 2032
Figure 13: Global Market Value Share (%) and BPS Analysis by LiDAR Type, 2022 to 2032
Figure 14: Global Market Y-o-Y Growth (%) Projections by LiDAR Type, 2022 to 2032
Figure 15: Global Market Value (US$ Million) Analysis by Component, 2017 to 2032
Figure 16: Global Market Volume (Unit) Analysis by Component, 2017 to 2032
Figure 17: Global Market Value Share (%) and BPS Analysis by Component, 2022 to 2032
Figure 18: Global Market Y-o-Y Growth (%) Projections by Component, 2022 to 2032
Figure 19: Global Market Value (US$ Million) Analysis by Drone Type, 2017 to 2032
Figure 20: Global Market Volume (Unit) Analysis by Drone Type, 2017 to 2032
Figure 21: Global Market Value Share (%) and BPS Analysis by Drone Type, 2022 to 2032
Figure 22: Global Market Y-o-Y Growth (%) Projections by Drone Type, 2022 to 2032
Figure 23: Global Market Value (US$ Million) Analysis by Range, 2017 to 2032
Figure 24: Global Market Volume (Unit) Analysis by Range, 2017 to 2032
Figure 25: Global Market Value Share (%) and BPS Analysis by Range, 2022 to 2032
Figure 26: Global Market Y-o-Y Growth (%) Projections by Range, 2022 to 2032
Figure 27: Global Market Value (US$ Million) Analysis by Application, 2017 to 2032
Figure 28: Global Market Volume (Unit) Analysis by Application, 2017 to 2032
Figure 29: Global Market Value Share (%) and BPS Analysis by Application, 2022 to 2032
Figure 30: Global Market Y-o-Y Growth (%) Projections by Application, 2022 to 2032
Figure 31: Global Market Attractiveness by LiDAR Type, 2022 to 2032
Figure 32: Global Market Attractiveness by Component, 2022 to 2032
Figure 33: Global Market Attractiveness by Drone Type, 2022 to 2032
Figure 34: Global Market Attractiveness by Range, 2022 to 2032
Figure 35: Global Market Attractiveness by Application, 2022 to 2032
Figure 36: Global Market Attractiveness by Region, 2022 to 2032
Figure 37: North America Market Value (US$ Million) by LiDAR Type, 2022 to 2032
Figure 38: North America Market Value (US$ Million) by Component, 2022 to 2032
Figure 39: North America Market Value (US$ Million) by Drone Type, 2022 to 2032
Figure 40: North America Market Value (US$ Million) by Range, 2022 to 2032
Figure 41: North America Market Value (US$ Million) by Application, 2022 to 2032
Figure 42: North America Market Value (US$ Million) by Country, 2022 to 2032
Figure 43: North America Market Value (US$ Million) Analysis by Country, 2017 to 2032
Figure 44: North America Market Volume (Unit) Analysis by Country, 2017 to 2032
Figure 45: North America Market Value Share (%) and BPS Analysis by Country, 2022 to 2032
Figure 46: North America Market Y-o-Y Growth (%) Projections by Country, 2022 to 2032
Figure 47: North America Market Value (US$ Million) Analysis by LiDAR Type, 2017 to 2032
Figure 48: North America Market Volume (Unit) Analysis by LiDAR Type, 2017 to 2032
Figure 49: North America Market Value Share (%) and BPS Analysis by LiDAR Type, 2022 to 2032
Figure 50: North America Market Y-o-Y Growth (%) Projections by LiDAR Type, 2022 to 2032
Figure 51: North America Market Value (US$ Million) Analysis by Component, 2017 to 2032
Figure 52: North America Market Volume (Unit) Analysis by Component, 2017 to 2032
Figure 53: North America Market Value Share (%) and BPS Analysis by Component, 2022 to 2032
Figure 54: North America Market Y-o-Y Growth (%) Projections by Component, 2022 to 2032
Figure 55: North America Market Value (US$ Million) Analysis by Drone Type, 2017 to 2032
Figure 56: North America Market Volume (Unit) Analysis by Drone Type, 2017 to 2032
Figure 57: North America Market Value Share (%) and BPS Analysis by Drone Type, 2022 to 2032
Figure 58: North America Market Y-o-Y Growth (%) Projections by Drone Type, 2022 to 2032
Figure 59: North America Market Value (US$ Million) Analysis by Range, 2017 to 2032
Figure 60: North America Market Volume (Unit) Analysis by Range, 2017 to 2032
Figure 61: North America Market Value Share (%) and BPS Analysis by Range, 2022 to 2032
Figure 62: North America Market Y-o-Y Growth (%) Projections by Range, 2022 to 2032
Figure 63: North America Market Value (US$ Million) Analysis by Application, 2017 to 2032
Figure 64: North America Market Volume (Unit) Analysis by Application, 2017 to 2032
Figure 65: North America Market Value Share (%) and BPS Analysis by Application, 2022 to 2032
Figure 66: North America Market Y-o-Y Growth (%) Projections by Application, 2022 to 2032
Figure 67: North America Market Attractiveness by LiDAR Type, 2022 to 2032
Figure 68: North America Market Attractiveness by Component, 2022 to 2032
Figure 69: North America Market Attractiveness by Drone Type, 2022 to 2032
Figure 70: North America Market Attractiveness by Range, 2022 to 2032
Figure 71: North America Market Attractiveness by Application, 2022 to 2032
Figure 72: North America Market Attractiveness by Country, 2022 to 2032
Figure 73: Latin America Market Value (US$ Million) by LiDAR Type, 2022 to 2032
Figure 74: Latin America Market Value (US$ Million) by Component, 2022 to 2032
Figure 75: Latin America Market Value (US$ Million) by Drone Type, 2022 to 2032
Figure 76: Latin America Market Value (US$ Million) by Range, 2022 to 2032
Figure 77: Latin America Market Value (US$ Million) by Application, 2022 to 2032
Figure 78: Latin America Market Value (US$ Million) by Country, 2022 to 2032
Figure 79: Latin America Market Value (US$ Million) Analysis by Country, 2017 to 2032
Figure 80: Latin America Market Volume (Unit) Analysis by Country, 2017 to 2032
Figure 81: Latin America Market Value Share (%) and BPS Analysis by Country, 2022 to 2032
Figure 82: Latin America Market Y-o-Y Growth (%) Projections by Country, 2022 to 2032
Figure 83: Latin America Market Value (US$ Million) Analysis by LiDAR Type, 2017 to 2032
Figure 84: Latin America Market Volume (Unit) Analysis by LiDAR Type, 2017 to 2032
Figure 85: Latin America Market Value Share (%) and BPS Analysis by LiDAR Type, 2022 to 2032
Figure 86: Latin America Market Y-o-Y Growth (%) Projections by LiDAR Type, 2022 to 2032
Figure 87: Latin America Market Value (US$ Million) Analysis by Component, 2017 to 2032
Figure 88: Latin America Market Volume (Unit) Analysis by Component, 2017 to 2032
Figure 89: Latin America Market Value Share (%) and BPS Analysis by Component, 2022 to 2032
Figure 90: Latin America Market Y-o-Y Growth (%) Projections by Component, 2022 to 2032
Figure 91: Latin America Market Value (US$ Million) Analysis by Drone Type, 2017 to 2032
Figure 92: Latin America Market Volume (Unit) Analysis by Drone Type, 2017 to 2032
Figure 93: Latin America Market Value Share (%) and BPS Analysis by Drone Type, 2022 to 2032
Figure 94: Latin America Market Y-o-Y Growth (%) Projections by Drone Type, 2022 to 2032
Figure 95: Latin America Market Value (US$ Million) Analysis by Range, 2017 to 2032
Figure 96: Latin America Market Volume (Unit) Analysis by Range, 2017 to 2032
Figure 97: Latin America Market Value Share (%) and BPS Analysis by Range, 2022 to 2032
Figure 98: Latin America Market Y-o-Y Growth (%) Projections by Range, 2022 to 2032
Figure 99: Latin America Market Value (US$ Million) Analysis by Application, 2017 to 2032
Figure 100: Latin America Market Volume (Unit) Analysis by Application, 2017 to 2032
Figure 101: Latin America Market Value Share (%) and BPS Analysis by Application, 2022 to 2032
Figure 102: Latin America Market Y-o-Y Growth (%) Projections by Application, 2022 to 2032
Figure 103: Latin America Market Attractiveness by LiDAR Type, 2022 to 2032
Figure 104: Latin America Market Attractiveness by Component, 2022 to 2032
Figure 105: Latin America Market Attractiveness by Drone Type, 2022 to 2032
Figure 106: Latin America Market Attractiveness by Range, 2022 to 2032
Figure 107: Latin America Market Attractiveness by Application, 2022 to 2032
Figure 108: Latin America Market Attractiveness by Country, 2022 to 2032
Figure 109: Europe Market Value (US$ Million) by LiDAR Type, 2022 to 2032
Figure 110: Europe Market Value (US$ Million) by Component, 2022 to 2032
Figure 111: Europe Market Value (US$ Million) by Drone Type, 2022 to 2032
Figure 112: Europe Market Value (US$ Million) by Range, 2022 to 2032
Figure 113: Europe Market Value (US$ Million) by Application, 2022 to 2032
Figure 114: Europe Market Value (US$ Million) by Country, 2022 to 2032
Figure 115: Europe Market Value (US$ Million) Analysis by Country, 2017 to 2032
Figure 116: Europe Market Volume (Unit) Analysis by Country, 2017 to 2032
Figure 117: Europe Market Value Share (%) and BPS Analysis by Country, 2022 to 2032
Figure 118: Europe Market Y-o-Y Growth (%) Projections by Country, 2022 to 2032
Figure 119: Europe Market Value (US$ Million) Analysis by LiDAR Type, 2017 to 2032
Figure 120: Europe Market Volume (Unit) Analysis by LiDAR Type, 2017 to 2032
Figure 121: Europe Market Value Share (%) and BPS Analysis by LiDAR Type, 2022 to 2032
Figure 122: Europe Market Y-o-Y Growth (%) Projections by LiDAR Type, 2022 to 2032
Figure 123: Europe Market Value (US$ Million) Analysis by Component, 2017 to 2032
Figure 124: Europe Market Volume (Unit) Analysis by Component, 2017 to 2032
Figure 125: Europe Market Value Share (%) and BPS Analysis by Component, 2022 to 2032
Figure 126: Europe Market Y-o-Y Growth (%) Projections by Component, 2022 to 2032
Figure 127: Europe Market Value (US$ Million) Analysis by Drone Type, 2017 to 2032
Figure 128: Europe Market Volume (Unit) Analysis by Drone Type, 2017 to 2032
Figure 129: Europe Market Value Share (%) and BPS Analysis by Drone Type, 2022 to 2032
Figure 130: Europe Market Y-o-Y Growth (%) Projections by Drone Type, 2022 to 2032
Figure 131: Europe Market Value (US$ Million) Analysis by Range, 2017 to 2032
Figure 132: Europe Market Volume (Unit) Analysis by Range, 2017 to 2032
Figure 133: Europe Market Value Share (%) and BPS Analysis by Range, 2022 to 2032
Figure 134: Europe Market Y-o-Y Growth (%) Projections by Range, 2022 to 2032
Figure 135: Europe Market Value (US$ Million) Analysis by Application, 2017 to 2032
Figure 136: Europe Market Volume (Unit) Analysis by Application, 2017 to 2032
Figure 137: Europe Market Value Share (%) and BPS Analysis by Application, 2022 to 2032
Figure 138: Europe Market Y-o-Y Growth (%) Projections by Application, 2022 to 2032
Figure 139: Europe Market Attractiveness by LiDAR Type, 2022 to 2032
Figure 140: Europe Market Attractiveness by Component, 2022 to 2032
Figure 141: Europe Market Attractiveness by Drone Type, 2022 to 2032
Figure 142: Europe Market Attractiveness by Range, 2022 to 2032
Figure 143: Europe Market Attractiveness by Application, 2022 to 2032
Figure 144: Europe Market Attractiveness by Country, 2022 to 2032
Figure 145: Asia Pacific Market Value (US$ Million) by LiDAR Type, 2022 to 2032
Figure 146: Asia Pacific Market Value (US$ Million) by Component, 2022 to 2032
Figure 147: Asia Pacific Market Value (US$ Million) by Drone Type, 2022 to 2032
Figure 148: Asia Pacific Market Value (US$ Million) by Range, 2022 to 2032
Figure 149: Asia Pacific Market Value (US$ Million) by Application, 2022 to 2032
Figure 150: Asia Pacific Market Value (US$ Million) by Country, 2022 to 2032
Figure 151: Asia Pacific Market Value (US$ Million) Analysis by Country, 2017 to 2032
Figure 152: Asia Pacific Market Volume (Unit) Analysis by Country, 2017 to 2032
Figure 153: Asia Pacific Market Value Share (%) and BPS Analysis by Country, 2022 to 2032
Figure 154: Asia Pacific Market Y-o-Y Growth (%) Projections by Country, 2022 to 2032
Figure 155: Asia Pacific Market Value (US$ Million) Analysis by LiDAR Type, 2017 to 2032
Figure 156: Asia Pacific Market Volume (Unit) Analysis by LiDAR Type, 2017 to 2032
Figure 157: Asia Pacific Market Value Share (%) and BPS Analysis by LiDAR Type, 2022 to 2032
Figure 158: Asia Pacific Market Y-o-Y Growth (%) Projections by LiDAR Type, 2022 to 2032
Figure 159: Asia Pacific Market Value (US$ Million) Analysis by Component, 2017 to 2032
Figure 160: Asia Pacific Market Volume (Unit) Analysis by Component, 2017 to 2032
Figure 161: Asia Pacific Market Value Share (%) and BPS Analysis by Component, 2022 to 2032
Figure 162: Asia Pacific Market Y-o-Y Growth (%) Projections by Component, 2022 to 2032
Figure 163: Asia Pacific Market Value (US$ Million) Analysis by Drone Type, 2017 to 2032
Figure 164: Asia Pacific Market Volume (Unit) Analysis by Drone Type, 2017 to 2032
Figure 165: Asia Pacific Market Value Share (%) and BPS Analysis by Drone Type, 2022 to 2032
Figure 166: Asia Pacific Market Y-o-Y Growth (%) Projections by Drone Type, 2022 to 2032
Figure 167: Asia Pacific Market Value (US$ Million) Analysis by Range, 2017 to 2032
Figure 168: Asia Pacific Market Volume (Unit) Analysis by Range, 2017 to 2032
Figure 169: Asia Pacific Market Value Share (%) and BPS Analysis by Range, 2022 to 2032
Figure 170: Asia Pacific Market Y-o-Y Growth (%) Projections by Range, 2022 to 2032
Figure 171: Asia Pacific Market Value (US$ Million) Analysis by Application, 2017 to 2032
Figure 172: Asia Pacific Market Volume (Unit) Analysis by Application, 2017 to 2032
Figure 173: Asia Pacific Market Value Share (%) and BPS Analysis by Application, 2022 to 2032
Figure 174: Asia Pacific Market Y-o-Y Growth (%) Projections by Application, 2022 to 2032
Figure 175: Asia Pacific Market Attractiveness by LiDAR Type, 2022 to 2032
Figure 176: Asia Pacific Market Attractiveness by Component, 2022 to 2032
Figure 177: Asia Pacific Market Attractiveness by Drone Type, 2022 to 2032
Figure 178: Asia Pacific Market Attractiveness by Range, 2022 to 2032
Figure 179: Asia Pacific Market Attractiveness by Application, 2022 to 2032
Figure 180: Asia Pacific Market Attractiveness by Country, 2022 to 2032
Figure 181: Middle East & Africa Market Value (US$ Million) by LiDAR Type, 2022 to 2032
Figure 182: Middle East & Africa Market Value (US$ Million) by Component, 2022 to 2032
Figure 183: Middle East & Africa Market Value (US$ Million) by Drone Type, 2022 to 2032
Figure 184: Middle East & Africa Market Value (US$ Million) by Range, 2022 to 2032
Figure 185: Middle East & Africa Market Value (US$ Million) by Application, 2022 to 2032
Figure 186: Middle East & Africa Market Value (US$ Million) by Country, 2022 to 2032
Figure 187: Middle East & Africa Market Value (US$ Million) Analysis by Country, 2017 to 2032
Figure 188: Middle East & Africa Market Volume (Unit) Analysis by Country, 2017 to 2032
Figure 189: Middle East & Africa Market Value Share (%) and BPS Analysis by Country, 2022 to 2032
Figure 190: Middle East & Africa Market Y-o-Y Growth (%) Projections by Country, 2022 to 2032
Figure 191: Middle East & Africa Market Value (US$ Million) Analysis by LiDAR Type, 2017 to 2032
Figure 192: Middle East & Africa Market Volume (Unit) Analysis by LiDAR Type, 2017 to 2032
Figure 193: Middle East & Africa Market Value Share (%) and BPS Analysis by LiDAR Type, 2022 to 2032
Figure 194: Middle East & Africa Market Y-o-Y Growth (%) Projections by LiDAR Type, 2022 to 2032
Figure 195: Middle East & Africa Market Value (US$ Million) Analysis by Component, 2017 to 2032
Figure 196: Middle East & Africa Market Volume (Unit) Analysis by Component, 2017 to 2032
Figure 197: Middle East & Africa Market Value Share (%) and BPS Analysis by Component, 2022 to 2032
Figure 198: Middle East & Africa Market Y-o-Y Growth (%) Projections by Component, 2022 to 2032
Figure 199: Middle East & Africa Market Value (US$ Million) Analysis by Drone Type, 2017 to 2032
Figure 200: Middle East & Africa Market Volume (Unit) Analysis by Drone Type, 2017 to 2032
Figure 201: Middle East & Africa Market Value Share (%) and BPS Analysis by Drone Type, 2022 to 2032
Figure 202: Middle East & Africa Market Y-o-Y Growth (%) Projections by Drone Type, 2022 to 2032
Figure 203: Middle East & Africa Market Value (US$ Million) Analysis by Range, 2017 to 2032
Figure 204: Middle East & Africa Market Volume (Unit) Analysis by Range, 2017 to 2032
Figure 205: Middle East & Africa Market Value Share (%) and BPS Analysis by Range, 2022 to 2032
Figure 206: Middle East & Africa Market Y-o-Y Growth (%) Projections by Range, 2022 to 2032
Figure 207: Middle East & Africa Market Value (US$ Million) Analysis by Application, 2017 to 2032
Figure 208: Middle East & Africa Market Volume (Unit) Analysis by Application, 2017 to 2032
Figure 209: Middle East & Africa Market Value Share (%) and BPS Analysis by Application, 2022 to 2032
Figure 210: Middle East & Africa Market Y-o-Y Growth (%) Projections by Application, 2022 to 2032
Figure 211: Middle East & Africa Market Attractiveness by LiDAR Type, 2022 to 2032
Figure 212: Middle East & Africa Market Attractiveness by Component, 2022 to 2032
Figure 213: Middle East & Africa Market Attractiveness by Drone Type, 2022 to 2032
Figure 214: Middle East & Africa Market Attractiveness by Range, 2022 to 2032
Figure 215: Middle East & Africa Market Attractiveness by Application, 2022 to 2032
Figure 216: Middle East & Africa Market Attractiveness by Country, 2022 to 2032
The United States, China, and Japan dominate the global LiDAR Drone Market.
The market is forecast to register a CAGR of 19.8% through 2032.
During 2018 to 2022, the market grew at a CAGR of 25%.
Technological advancement, such as the development of new LiDAR sensors and the use of drones for autonomous navigation, are driving market growth.
The global market size to reach USD 836.74 million by 2033.
Explore Similar Insights
Thank you!
You will receive an email from our Business Development Manager. Please be sure to check your SPAM/JUNK folder too.