

- Market Size (2026)
- USD 779.4 Mn
- Forecast (2036)
- USD 1120.9 Mn
- CAGR (2026 to 2036)
- 3.7%
Mastic Gum Market Size, Market Forecast and Outlook By FMI
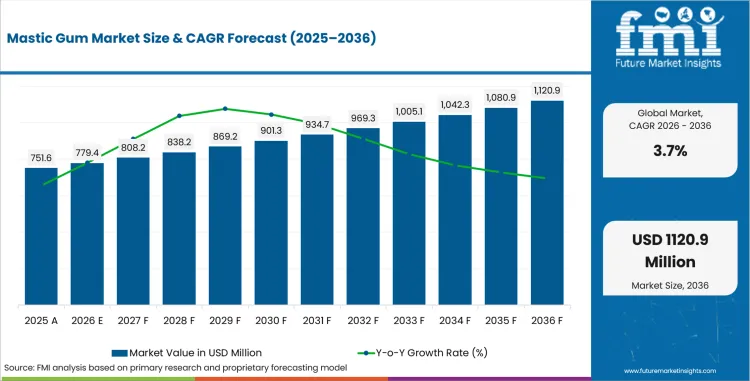
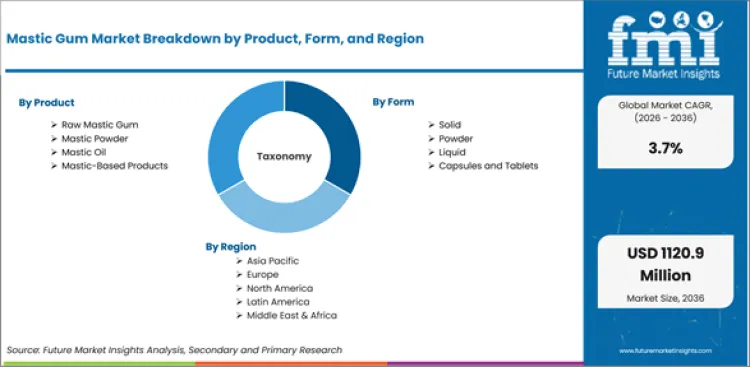
The mastic gum market was valued at USD 751.6 million in 2025. The market is set to reach USD 779.4 million by 2026-end and grow at a CAGR of 3.7% between 2026-2036 to reach USD 1,120.9 million by 2036. Raw Mastic Gum will dominate with a 35.0% share, while Solid will lead with a 40.0% share.
Key Takeaways, Market Size, and Forecast
- 2026 Market Size: USD 779.4 Million
- 2036 Market Size: USD 1120.9 Million
- Compound Annual Growth Rate (CAGR): 3.7% from 2026 to 2036
- Absolute $ Opportunity: USD 341.5 Million between 2026 and 2036
- Leading Product Segment: Raw Mastic Gum
- Raw Mastic Gum Share in 2026: 35.0%
- Fastest-growing Country: China
- China CAGR: 5.0% through 2036
| Parameter | Details |
|---|---|
| Market Size in 2026 (Value) | USD 779.4 Million |
| Market Forecast in 2036 (Value) | USD 1120.9 Million |
| CAGR (2026 to 2036) | 3.7% |
| Years Considered | 2021 to 2036 |
| Base Year | 2025 |
| Forecast Period | 2026 to 2036 |
| Units Considered | Value (USD Mn) |
| Leading Sub-Region | China |
Summary of the Mastic Gum Market
- Demand and Growth Drivers
- Mastic Gum demand is shaped by evolving food safety standards and clean-label requirements across food and beverages applications, with end users prioritizing traceable and certified raw mastic gum inputs during the forecast period.
- Adoption is increasing due to premiumization trends in food and beverages segments, where solid formulations offer functional and processing advantages over conventional alternatives.
- Growth reflects the expansion of organized retail and institutional procurement channels that broaden addressable demand for standardized mastic gum products across key consuming markets.
- Product and Segment View
- Raw Mastic Gum is expected to lead the product segment at 35.0% share in 2026, supported by established demand across commercial and institutional end users.
- Food and Beverages is likely to remain a leading application category, reflecting concentrated procurement volumes and stable downstream demand patterns.
- Solid is expected to account for 40.0% of the form segment, supported by processing compatibility and cost efficiency across manufacturing systems.
- Geography and Competitive Outlook
- China is expected to lead growth at 5.0% through 2036, supported by production capacity expansion and increasing investment in product quality.
- India at 4.6% reflects steady demand from established processing and institutional channels with a focus on compliance and traceability.
- Companies with integrated supply chains, multi-regional distribution, and regulatory compliance expertise are likely to strengthen competitive positioning during the forecast period.
- Analyst Opinion
- Nandini Roy Choudhury, Principal Consultant at FMI says, 'Companies that can scale raw mastic gum supply while maintaining quality certification across food and beverages applications are likely to capture disproportionate share in high-growth markets such as China during the forecast period.'
- The mastic gum market is transitioning from commodity-driven procurement to specification-led sourcing as end users prioritize traceability and functional performance.
- Adoption is supported by regulatory tightening in key markets that favors certified and standardized ingredient inputs over unverified supply sources.
- Cost competitiveness remains a key differentiator, with producers that achieve scale while maintaining quality certifications positioned to gain procurement preference.
Mastic Gum Market Definition
The mastic gum market encompasses commercially traded products categorized by product, form, application, end use, distribution channel, nature, source. Core product categories include raw mastic gum, mastic powder, mastic oil, solid, powder, liquid, food and beverages, pharmaceuticals, and related formulations used across food processing, industrial, pharmaceutical, and consumer applications. The market covers revenue generated from 2026 to 2036 across all distribution and end-use channels.
Mastic Gum Market Inclusions
Market scope encompasses all commercially traded mastic gum products categorized by product (raw mastic gum, mastic powder, mastic oil, mastic-based products), form (solid, powder, liquid, capsules and tablets), application (food and beverages, pharmaceuticals, cosmetics and personal care, nutraceuticals), end use (food manufacturers, pharmaceutical companies, cosmetic manufacturers, nutraceutical companies), distribution channel (direct sales, distributors, retail stores, online retail), nature (conventional, organic), source (natural resin, cultivated sources). Revenue coverage spans from 2026 to 2036 across all regions and distribution channels.
Mastic Gum Market Exclusions
The scope does not include raw, unprocessed, or non-commercial-grade mastic gum products sold outside organized trade channels. Products intended exclusively for non-commercial research or laboratory use without commercial intent are excluded. Synthetic substitutes that do not contain mastic gum as a primary functional ingredient are also outside the scope.
Mastic Gum Market Research Methodology
- Primary Research: FMI analysts conducted interviews with mastic gum producers, food processing companies, ingredient distributors, and end-use application specialists in key markets.
- Desk Research: Combined data from industry trade associations, regulatory compliance databases, sustainability certification bodies, and manufacturer disclosures.
- Market Sizing and Forecasting: Bottom-up aggregation of demand across product, form, application, end use, distribution channel, nature, source segments, with regional adoption curves triangulated against trade and production data.
- Data Validation: Cross-checked quarterly against global production data, import and export statistics, and manufacturer-reported capacity utilization.
Why is the Mastic Gum Market Growing?
- Regulatory tightening in food safety and ingredient traceability is creating structured demand for certified mastic gum products across food and beverages and institutional procurement channels in major consuming markets.
- Expansion of organized retail and e-commerce distribution is broadening the addressable market for premium and specialty-grade raw mastic gum formulations across both developed and emerging economies.
- China leads growth at 5.0%, supported by a large production and consumption base, increasing processing capacity, and rising quality certification requirements.
The mastic gum market is expanding as food manufacturers, institutional buyers, and industrial processors shift procurement toward standardized and certified ingredient inputs. Demand is shaped by regulatory requirements for ingredient traceability, clean-label compliance, and food safety certification across major consuming markets. Raw Mastic Gum products account for the leading share of demand, reflecting established processing infrastructure and broad compatibility with downstream manufacturing systems. End users are increasingly specifying quality parameters tied to functional performance, shelf stability, and regulatory compliance, which favors suppliers with documented quality management systems and consistent output.
Growth is further supported by the premiumization of consumer-facing products that incorporate specialty and functional mastic gum ingredients. Health and wellness trends are influencing formulation strategies in food and beverages and nutraceutical applications, creating demand for higher-specification inputs. Distribution channel evolution, including B2B digital procurement platforms, is reducing transaction costs and improving supplier visibility. China and India represent the strongest growth corridors, combining production capacity expansion, domestic consumption growth, and regulatory modernization that supports quality-driven procurement.
Market Segmentation Analysis
- Raw Mastic Gum accounts for 35.0% of the product segment in 2026, reflecting established demand across primary commercial applications.
- Food and Beverages leads the application segment at 35.0% share, supported by concentrated end-use demand.
- Food Manufacturers accounts for 35.0% of the end use segment, reflecting institutional procurement and bulk sourcing preferences.
The mastic gum market is segmented by product, form, application, end use, distribution channel, nature, source. By product, segments include Raw Mastic Gum, Mastic Powder, Mastic Oil, Mastic-Based Products. By form, segments include Solid, Powder, Liquid, Capsules and Tablets. By application, segments include Food and Beverages, Pharmaceuticals, Cosmetics and Personal Care, Nutraceuticals. By end use, segments include Food Manufacturers, Pharmaceutical Companies, Cosmetic Manufacturers, Nutraceutical Companies. By distribution channel, segments include Direct Sales, Distributors, Retail Stores, Online Retail. By nature, segments include Conventional, Organic. By source, segments include Natural Resin, Cultivated Sources.
Insights into the Raw Mastic Gum Product Segment
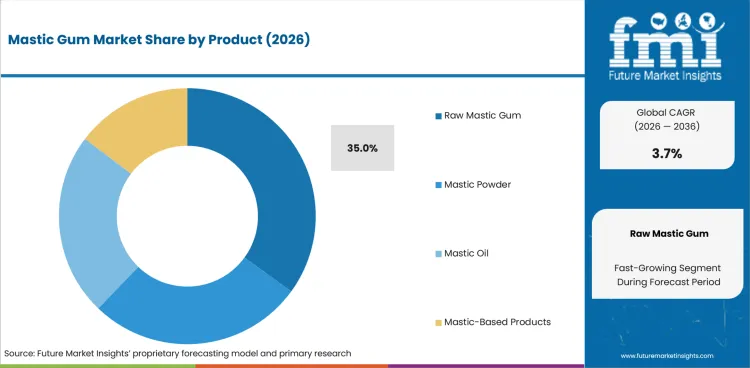
Raw Mastic Gum is expected to account for 35.0% of the product segment in 2026. Key sub-categories include tears , granules, food grade powder, each serving distinct processing and application requirements. Demand is concentrated in commercial food manufacturing, industrial processing, and institutional procurement channels where product consistency and regulatory compliance are primary sourcing criteria.
Procurement patterns for raw mastic gum products are shaped by downstream formulation requirements, shelf-stability targets, and compatibility with existing production systems. Suppliers that maintain certified quality management and offer consistent batch-to-batch performance are gaining preference among large-scale processors and contract manufacturers.
Insights into the Solid Form Segment
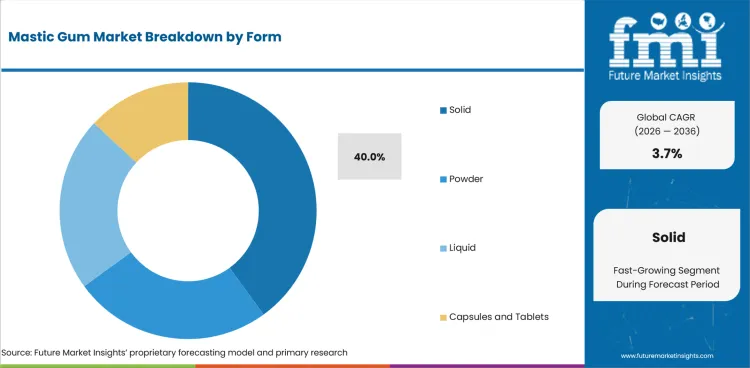
Solid is expected to account for 40.0% of the form segment in 2026. Demand is concentrated in commercial food manufacturing, industrial processing, and institutional procurement channels where product consistency and regulatory compliance are primary sourcing criteria.
Procurement patterns for solid products are shaped by downstream formulation requirements, shelf-stability targets, and compatibility with existing production systems. Suppliers that maintain certified quality management and offer consistent batch-to-batch performance are gaining preference among large-scale processors and contract manufacturers.
Mastic Gum Market Drivers, Restraints, and Opportunities
- Regulatory compliance and traceability requirements are creating structured demand for certified mastic gum products across food manufacturing and institutional channels.
- Cost pressure from raw material volatility and supply chain complexity constrains margin growth for mid-tier producers, concentrating procurement among established suppliers.
- Premiumization and functional product development are expanding higher-value application segments across health, wellness, and specialty food categories.
The mastic gum market is expanding on the basis of regulatory compliance requirements, functional product demand, and distribution modernization. Cost pressure from raw material volatility constrains margin growth in commodity segments, while opportunities in premium and health-oriented applications support value growth across the forecast period.
Regulatory Compliance and Traceability Requirements
Demand is shaped by regulatory tightening across major markets that requires ingredient traceability, quality certification, and documented sourcing practices. Food safety mandates in the EU, the USA, and East Asia are raising specification thresholds for mastic gum products, favoring suppliers with certified quality systems and auditable supply chains.
Cost Pressure and Supply Chain Complexity
Adoption is constrained by cost sensitivity in commodity segments where mastic gum products compete with lower-cost alternatives. Raw material price volatility, logistics costs, and multi-tier distribution create margin pressure for mid-tier producers without scale advantages.
Premiumization and Functional Product Development
Growth reflects the expansion of premium and functional product segments where mastic gum ingredients deliver performance advantages in formulation, shelf stability, or nutritional profile. Health and wellness trends in consumer-facing categories support higher-value applications.
Distribution Channel Modernization
Procurement is shifting toward digital B2B platforms and direct supply arrangements that reduce intermediary costs and improve sourcing transparency, enabling mid-tier buyers to access specification-grade products previously limited to large-scale industrial purchasers.
Analysis of Mastic Gum Market By Key Countries
.webp "Top Country Growth Comparison Mastic Gum Market Cagr (2026 2036)")
| Country | CAGR |
|---|---|
| China | 5.0% |
| India | 4.6% |
| Germany | 4.3% |
| France | 3.9% |
| UK | 3.5% |
| USA | 3.1% |
| Brazil | 2.8% |
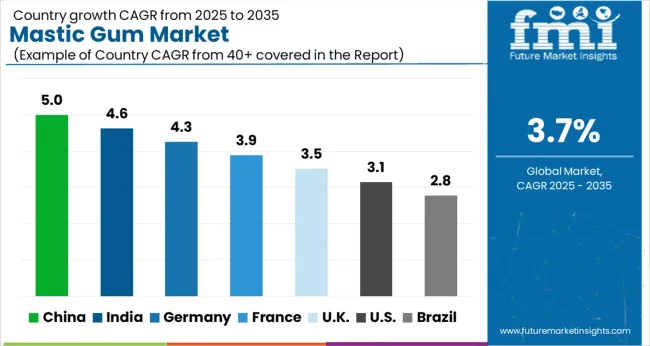
- China leads with a CAGR of 5.0%, supported by a large production and consumption base and increasing investment in raw mastic gum quality standards.
- India at 4.6% reflects steady demand shaped by institutional procurement and regulatory compliance requirements for raw mastic gum products.
- Germany (4.3%) shows growth driven by food and beverages sector expansion and specification-led sourcing for raw mastic gum ingredients.
- France at 3.9% indicates demand supported by retail modernization and premiumization trends in food and beverages applications.
The global mastic gum market is projected to expand at a CAGR of 3.7% from 2026 to 2036. The analysis covers more than 30 countries, with key markets listed below.
Future Outlook for Mastic Gum Market in China
China is projected to grow at 5.0% through 2036, supported by cost advantage of local manufacturers that strengthens domestic processing capacity for raw mastic gum products. Export-oriented processing channels is creating additional procurement channels across food and beverages end uses.
- Largest producer and consumer base is supporting adoption of certified and standardized raw mastic gum formulations.
- Demand for specification-grade raw mastic gum is reinforced by e-commerce logistics platforms in domestic and export-facing channels.
- Food delivery infrastructure is expanding procurement pipelines for raw mastic gum products in food and beverages applications.
Opportunity Analysis of Mastic Gum Market in India
Regulatory standards shaped by urbanization are influencing procurement for raw mastic gum in India, projected to grow at 4.6% through 2036. Compliance requirements linked to organized retail expansion are supporting specification-grade sourcing across food and beverages segments.
- Demand for specification-grade raw mastic gum is reinforced by organized retail expansion in domestic and export-facing channels.
- E-commerce channels is expanding procurement pipelines for raw mastic gum products in food and beverages applications.
- Sourcing decisions for raw mastic gum inputs are shaped by tier-2 and tier-3 city distribution across commercial and institutional end uses.
In-depth Analysis of Mastic Gum Market in Germany
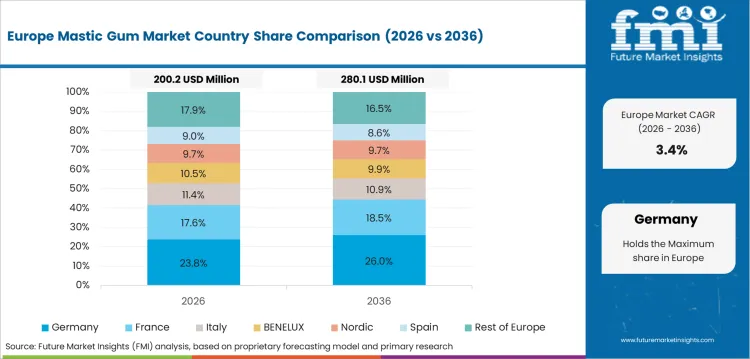
The scale of Germany's food and beverages sector is supporting growth at 4.3% through 2036. Retailer sustainability commitments and retailer consolidation are expanding the addressable market for raw mastic gum products across commercial and institutional channels.
- Retailer sustainability commitments is expanding procurement pipelines for raw mastic gum products in food and beverages applications.
- Sourcing decisions for raw mastic gum inputs are shaped by retailer consolidation across commercial and institutional end uses.
- Growth in food and beverages channels reflects the influence of Ecodesign Regulation compliance on specification and volume requirements for raw mastic gum.
Sales Analysis of Mastic Gum Market in France
Government and institutional frameworks around established food processing expertise are shaping raw mastic gum procurement in France, projected to grow at 3.9% through 2036. EU sustainability directives is reinforcing demand across food and beverages applications.
- Sourcing decisions for raw mastic gum inputs are shaped by clean-label consumer demand across commercial and institutional end uses.
- Growth in food and beverages channels reflects the influence of established food processing expertise on specification and volume requirements for raw mastic gum.
- EU sustainability directives is supporting adoption of certified and standardized raw mastic gum formulations.
Growth Analysis of Mastic Gum Market in UK
The mature food and beverages landscape in UK is generating replacement and specification-upgrade demand for raw mastic gum products, projected to grow at 3.5% through 2036. Post-Brexit packaging regulations and retailer sustainability targets are the primary demand drivers.
- Growth in food and beverages channels reflects the influence of clean-label consumer demand on specification and volume requirements for raw mastic gum.
- UK Plastics Tax is supporting adoption of certified and standardized raw mastic gum formulations.
- Demand for specification-grade raw mastic gum is reinforced by post-Brexit packaging regulations in domestic and export-facing channels.
Demand Outlook for Mastic Gum Market in USA
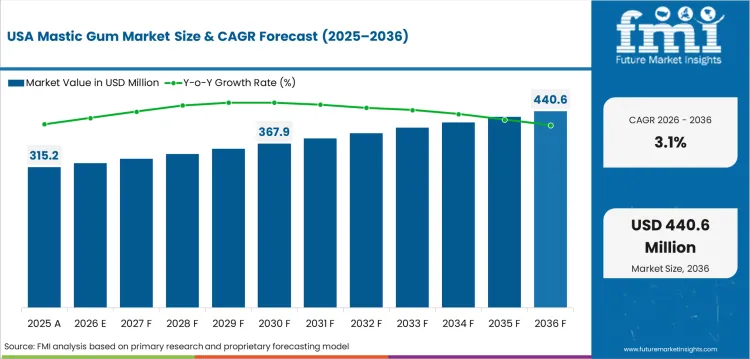
Demand for raw mastic gum in USA is shaped by brand differentiation strategies and clean-label consumer preferences. The market is projected to expand at 3.1% through 2036, with food and beverages applications accounting for a significant share of procurement volume across organized trade channels.
- Sustainability mandates is supporting adoption of certified and standardized raw mastic gum formulations.
- Demand for specification-grade raw mastic gum is reinforced by retailer packaging requirements in domestic and export-facing channels.
- Recyclability targets is expanding procurement pipelines for raw mastic gum products in food and beverages applications.
Competitive Landscape and Strategic Positioning
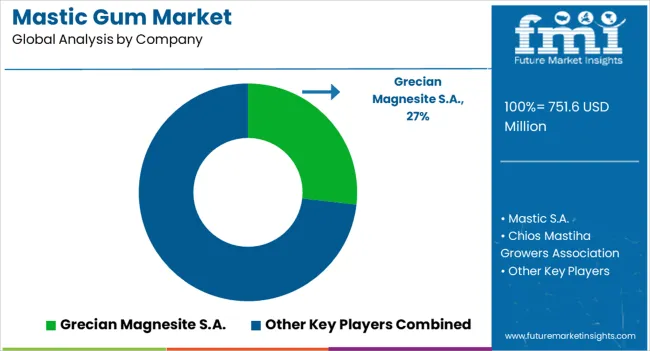
- Grecian Magnesite S.A. leads through integrated manufacturing, global distribution, and established procurement relationships across food and beverages and institutional channels.
- Mastic S.A. and Chios Mastiha Growers Association compete on product breadth, regional coverage, and raw mastic gum formulation expertise.
- Emerging players are targeting niche segments including functional formulations, clean-label products, and regional specialty raw mastic gum applications.
Grecian Magnesite S.A. maintains a strong position in the mastic gum market through integrated supply chain capabilities, multi-regional manufacturing, and established relationships with large-scale food and beverages processors and institutional buyers. Mastic S.A. offers a diversified ingredient portfolio that includes raw mastic gum products alongside complementary formulations.
Chios Mastiha Growers Association competes on the basis of product quality, certification compliance, and regional distribution strength. Mid-tier players focus on niche segments, regional markets, or specific application expertise to differentiate from larger integrated competitors.
Barriers to entry include processing infrastructure capital cost, quality certification timelines, established supplier relationships in institutional procurement, and multi-jurisdictional regulatory compliance costs. Strategic priorities include cost reduction through scale, high-growth regional market expansion, and specialty product line development.
Key Companies in the Mastic Gum Market
Key global companies leading the mastic gum market include:
-
Grecian Magnesite S.A., Mastic S.A., Chios Mastiha Growers Association, Merck KGaA maintain leading positions through manufacturing scale, regulatory compliance infrastructure, and established procurement relationships with large-scale food and beverages processors and institutional buyers.
- Lalilab Inc, Sharawi Chewing Gum Factory, Mazaya’s Tobacco-Molasses have established regional leadership through focused distribution, application-specific raw mastic gum formulations, and localized customer support.
Competitive Benchmarking: Mastic Gum Market
| Company | Product Breadth | Processing Technology | Food and beverages Access | Geographic Footprint |
|---|---|---|---|---|
| Grecian Magnesite S.A. | High | Medium | Strong | Global |
| Mastic S.A. | High | Medium | Strong | Global |
| Chios Mastiha Growers Association | High | Medium | Strong | Global |
| Merck KGaA | Medium | Medium | Moderate | Multi-regional |
| Lalilab Inc | Medium | High | Moderate | Multi-regional |
| Sharawi Chewing Gum Factory | Medium | High | Moderate | Multi-regional |
| Mazaya’s Tobacco-Molasses | Low | High | Low | Regional |
Source: Future Market Insights competitive analysis, 2026.
Key Developments in Mastic Gum Market
- In 2025, Grecian Magnesite S.A. expanded its raw mastic gum product portfolio with new specification-grade formulations targeting food and beverages and institutional procurement channels.
- In 2025, Mastic S.A. invested in processing capacity expansion to support growing demand for certified and traceable raw mastic gum ingredients across key regional markets.
Key Players in the Mastic Gum Market
Major Global Players
- Grecian Magnesite S.A.
- Mastic S.A.
- Chios Mastiha Growers Association
- Merck KGaA
- Lalilab Inc
Emerging Players/Startups
- Kottatis Natural Products
- Anemos Company
- Damsak Foods
Report Scope and Coverage
| Parameter | Details |
|---|---|
| Market size by 2036 | USD 1120.9 Million |
| Growth rate | 3.7% CAGR (2026 to 2036) |
| Forecast period | 2026 to 2036 |
| Base year value (2025) | USD 751.6 Million |
| Key Segment Covered | Product, Form, Application, End Use, Distribution Channel, Nature, Source |
| Regions covered | North America, Latin America, Western Europe, Eastern Europe, East Asia, South Asia and Pacific, Middle East and Africa |
| Countries covered | USA, China, India, Germany, France, UK, Brazil, 30 plus countries |
| Key companies profiled | Grecian Magnesite S.A., Mastic S.A., Chios Mastiha Growers Association, Merck KGaA, Lalilab Inc, Sharawi Chewing Gum Factory, Mazaya’s Tobacco-Molasses |
| Approach | Hybrid bottom-up and top-down methodology starting with verified transaction data, projecting adoption velocity across segments and regions. |
Market Segmentation Analysis
Mastic Gum Market Segmented by Product:
- Raw Mastic Gum
- Tears
- Large Tears
- Small Tears
- Granules
- Coarse Granules
- Fine Granules
- Tears
- Mastic Powder
- Food Grade Powder
- Fine Powder
- Blended Powder
- Pharmaceutical Grade Powder
- High Purity Powder
- Micronized Powder
- Food Grade Powder
- Mastic Oil
- Essential Oil
- Steam Distilled Oil
- Cold Extracted Oil
- Concentrated Extract
- High Potency Extract
- Standardized Extract
- Essential Oil
- Mastic-Based Products
- Dietary Supplements
- Capsules
- Tablets
- Food Products
- Chewing Gum
- Flavoring Agent
- Cosmetics
- Skincare Products
- Oral Care Products
- Dietary Supplements
Mastic Gum Market Segmented by Form:
- Solid
- Tears
- Granules
- Powder
- Fine Powder
- Micronized Powder
- Liquid
- Oil
- Extract
- Capsules and Tablets
- Supplement Form
- Dosage Form
Mastic Gum Market Segmented by Application:
- Food and Beverages
- Confectionery
- Chewing Gum
- Candies
- Flavoring Agent
- Bakery Products
- Beverages
- Confectionery
- Pharmaceuticals
- Digestive Health
- Stomach Ulcer Treatment
- Gut Health Support
- Oral Health
- Antibacterial Use
- Dental Care
- Digestive Health
- Cosmetics and Personal Care
- Skincare
- Anti-aging
- Acne Treatment
- Oral Care
- Toothpaste
- Mouthwash
- Skincare
- Nutraceuticals
- Dietary Supplements
- Capsules
- Functional Products
- Dietary Supplements
Mastic Gum Market Segmented by End Use:
- Food Manufacturers
- Confectionery Producers
- Chewing Gum Manufacturers
- Flavor Houses
- Confectionery Producers
- Pharmaceutical Companies
- Drug Manufacturers
- Digestive Medicines
- Oral Health Products
- Drug Manufacturers
- Cosmetic Manufacturers
- Personal Care Brands
- Skincare Products
- Oral Care Products
- Personal Care Brands
- Nutraceutical Companies
- Supplement Manufacturers
- Capsules and Tablets
- Supplement Manufacturers
Mastic Gum Market Segmented by Distribution Channel:
- Direct Sales
- Bulk Supply
- Contract Buyers
- Distributors
- Regional Distributors
- Global Suppliers
- Retail Stores
- Specialty Stores
- Health Stores
- Online Retail
- E-commerce Platforms
- Direct-to-Consumer
Mastic Gum Market Segmented by Nature:
- Conventional
- Standard Resin
- Commercial Production
- Organic
- Certified Organic
- Natural Harvested
Mastic Gum Market Segmented by Source:
- Natural Resin
- Tree Harvested
- Wild Collection
- Cultivated Sources
- Farmed Trees
- Managed Production
Mastic Gum Market by Region:
- North America
- USA
- Canada
- Mexico
- Latin America
- Brazil
- Chile
- Rest of Latin America
- Western Europe
- Germany
- UK
- Italy
- Spain
- France
- Nordic
- BENELUX
- Rest of Western Europe
- Eastern Europe
- Russia
- Poland
- Hungary
- Balkan & Baltic
- Rest of Eastern Europe
- East Asia
- China
- Japan
- South Korea
- South Asia and Pacific
- India
- ASEAN
- Australia & New Zealand
- Rest of South Asia and Pacific
- Middle East & Africa
- Kingdom of Saudi Arabia
- Other GCC Countries
- Türkiye
- South Africa
- Other African Union
- Rest of Middle East & Africa
Research Sources and Bibliography
- 1. Food and Agriculture Organization. (2025). FAO Global Food and Agriculture Statistics. FAO.
- 2. World Health Organization. (2025). WHO Global Health Observatory Data Repository. WHO.
- 3. International Organization for Standardization. (2025). ISO Food Safety Management Standards. ISO.
- 4. USA Food and Drug Administration. (2025). FDA Food Safety Modernization Act Compliance Guide. FDA.
- 5. European Commission. (2025). EU Food Safety and Quality Standards Framework. EC.
This bibliography is provided for reader reference.
This Report Answers
- Estimating the size of the market and how much revenue it will generate from 2026 to 2036.
- Segmenting by product, form, application, end use, distribution channel, nature, source.
- Insights about more than 30 markets in the region.
- Analysis of demand drivers, restraints, and growth opportunities.
- Assessment of the competitive landscape.
- Finding investment opportunities across key application and end-use segments.
- Tracking supply chain and distribution channel developments.
- Delivery of data in PDF and Excel formats.
Frequently Asked Questions
How big is the mastic gum market in 2026?
The global mastic gum market is estimated to be valued at USD 779.4 million in 2026.
What will be the size of the mastic gum market in 2036?
The market size for the mastic gum market is projected to reach USD 1,120.9 million by 2036.
How much will the mastic gum market growth be between 2026 and 2036?
The mastic gum market is expected to grow at a 3.7% CAGR between 2026 and 2036.
What are the key products in the mastic gum market?
The key products in the mastic gum market are Raw Mastic Gum, Mastic Powder, Mastic Oil and Mastic-Based Products.
Which form segment is expected to contribute a significant share in the mastic gum market in 2026?
In terms of form, the solid segment is expected to command 40.0% share in the mastic gum market in 2026.
Preview the report firsthand - request a free sample
Get SampleGet the brochure for pricing and purchase details.
Get PDFTable of Content
- Key Takeaways
- Market Size and CAGR
- Top Growth Driver
- Fastest Growing Segment
- Leading Region
- Key Companies
- Emerging Opportunities
- Executive Summary
- Global Market Outlook
- Demand-side Trends
- Supply-side Trends
- Technology Roadmap Analysis
- Analysis and Recommendations
- Analyst Perspective (What is happening? Why now? What should investors know?)
- Key Questions Answered
- How large is the market?
- What is the CAGR?
- What are key trends?
- Which region dominates?
- Who are the leaders?
- Market Overview
- Market Coverage / Taxonomy
- Market Definition / Scope / Limitations
- Research Methodology
- Chapter Orientation
- Analytical Lens and Working Hypotheses
- Market Structure, Signals, and Trend Drivers
- Benchmarking and Cross-market Comparability
- Market Sizing, Forecasting, and Opportunity Mapping
- Research Design and Evidence Framework
- Desk Research Programme (Secondary Evidence)
- Expert Input and Fieldwork (Primary Evidence)
- Tooling, Models, and Reference Databases
- Data Engineering and Model Build
- Quality Assurance and Audit Trail
- Market Background
- Market Dynamics (Drivers, Restraints, Opportunity, Trends)
- Scenario Forecast (Optimistic, Likely, Conservative)
- Impact Analysis
- AI Impact
- Sustainability Impact
- Regulatory Impact
- Technology Impact
- Consumer / Buyer Analysis
- Purchase Drivers
- Adoption Barriers
- Buyer Journey
- Opportunity Map Analysis
- Product Life Cycle Analysis
- Supply Chain Analysis
- Investment Feasibility Matrix
- Value Chain Analysis
- PESTLE and Porter's Analysis
- Regulatory Landscape
- Regional Parent Market Outlook
- Production and Consumption Statistics
- Import and Export Statistics
- Global Market Analysis and Forecast, 2021 to 2036
- Historical Market Size Value (USD Million) Analysis, 2021 to 2025
- Current and Future Market Size Value (USD Million) Projections, 2026 to 2036
- Y-o-Y Growth Trend Analysis
- Absolute $ Opportunity Analysis
- Global Market Pricing Analysis, 2021 to 2036
- Global Market Analysis and Forecast, By Product, 2021 to 2036
- Introduction / Key Findings
- Historical Market Size Value (USD Million) Analysis By Product, 2021 to 2025
- Current and Future Market Size Value (USD Million) Analysis and Forecast By Product, 2026 to 2036
- Raw Mastic Gum
- Tears
- Granules
- Mastic Powder
- Food Grade Powder
- Pharmaceutical Grade Powder
- Mastic Oil
- Essential Oil
- Concentrated Extract
- Mastic-Based Products
- Dietary Supplements
- Food Products
- Raw Mastic Gum
- Y-o-Y Growth Trend Analysis By Product, 2021 to 2025
- Absolute $ Opportunity Analysis By Product, 2026 to 2036
- Global Market Analysis and Forecast, By Form, 2021 to 2036
- Introduction / Key Findings
- Historical Market Size Value (USD Million) Analysis By Form, 2021 to 2025
- Current and Future Market Size Value (USD Million) Analysis and Forecast By Form, 2026 to 2036
- Solid
- Tears
- Granules
- Powder
- Fine Powder
- Micronized Powder
- Liquid
- Oil
- Extract
- Capsules and Tablets
- Supplement Form
- Dosage Form
- Solid
- Y-o-Y Growth Trend Analysis By Form, 2021 to 2025
- Absolute $ Opportunity Analysis By Form, 2026 to 2036
- Global Market Analysis and Forecast, By Application, 2021 to 2036
- Introduction / Key Findings
- Historical Market Size Value (USD Million) Analysis By Application, 2021 to 2025
- Current and Future Market Size Value (USD Million) Analysis and Forecast By Application, 2026 to 2036
- Food and Beverages
- Confectionery
- Flavoring Agent
- Pharmaceuticals
- Digestive Health
- Oral Health
- Cosmetics and Personal Care
- Skincare
- Oral Care
- Nutraceuticals
- Dietary Supplements
- Food and Beverages
- Y-o-Y Growth Trend Analysis By Application, 2021 to 2025
- Absolute $ Opportunity Analysis By Application, 2026 to 2036
- Global Market Analysis and Forecast, By End Use, 2021 to 2036
- Introduction / Key Findings
- Historical Market Size Value (USD Million) Analysis By End Use, 2021 to 2025
- Current and Future Market Size Value (USD Million) Analysis and Forecast By End Use, 2026 to 2036
- Food Manufacturers
- Confectionery Producers
- Pharmaceutical Companies
- Drug Manufacturers
- Cosmetic Manufacturers
- Personal Care Brands
- Nutraceutical Companies
- Supplement Manufacturers
- Food Manufacturers
- Y-o-Y Growth Trend Analysis By End Use, 2021 to 2025
- Absolute $ Opportunity Analysis By End Use, 2026 to 2036
- Global Market Analysis and Forecast, By Distribution Channel, 2021 to 2036
- Introduction / Key Findings
- Historical Market Size Value (USD Million) Analysis By Distribution Channel, 2021 to 2025
- Current and Future Market Size Value (USD Million) Analysis and Forecast By Distribution Channel, 2026 to 2036
- Direct Sales
- Bulk Supply
- Contract Buyers
- Distributors
- Regional Distributors
- Global Suppliers
- Retail Stores
- Specialty Stores
- Health Stores
- Online Retail
- E-commerce Platforms
- Direct-to-Consumer
- Direct Sales
- Y-o-Y Growth Trend Analysis By Distribution Channel, 2021 to 2025
- Absolute $ Opportunity Analysis By Distribution Channel, 2026 to 2036
- Global Market Analysis and Forecast, By Nature
- Introduction / Key Findings
- Historical Market Size Value (USD Million) Analysis By Nature, 2021 to 2025
- Current and Future Market Size Value (USD Million) Analysis and Forecast By Nature, 2026 to 2036
- Conventional
- Standard Resin
- Commercial Production
- Organic
- Certified Organic
- Natural Harvested
- Conventional
- Y-o-Y Growth Trend Analysis By Nature, 2021 to 2025
- Absolute $ Opportunity Analysis By Nature, 2026 to 2036
- Global Market Analysis and Forecast, By Source
- Introduction / Key Findings
- Historical Market Size Value (USD Million) Analysis By Source, 2021 to 2025
- Current and Future Market Size Value (USD Million) Analysis and Forecast By Source, 2026 to 2036
- Natural Resin
- Tree Harvested
- Wild Collection
- Cultivated Sources
- Farmed Trees
- Managed Production
- Natural Resin
- Y-o-Y Growth Trend Analysis By Source, 2021 to 2025
- Absolute $ Opportunity Analysis By Source, 2026 to 2036
- Global Market Analysis and Forecast, By Region, 2021 to 2036
- Introduction
- Historical Market Size Value (USD Million) Analysis By Region, 2021 to 2025
- Current Market Size Value (USD Million) Analysis and Forecast By Region, 2026 to 2036
- North America
- Latin America
- Western Europe
- Eastern Europe
- East Asia
- South Asia and Pacific
- Middle East & Africa
- Market Attractiveness Analysis By Region
- North America Market Analysis and Forecast, By Country, 2021 to 2036
- Historical Market Size Value (USD Million) Trend Analysis By Market Taxonomy, 2021 to 2025
- Market Size Value (USD Million) Forecast By Market Taxonomy, 2026 to 2036
- By Country
- USA
- Canada
- Mexico
- By Product
- By Form
- By Application
- By End Use
- By Distribution Channel
- By Nature
- By Source
- By Country
- Market Attractiveness Analysis
- By Country
- By Product
- By Form
- By Application
- By End Use
- By Distribution Channel
- By Nature
- By Source
- Key Takeaways
- Latin America Market Analysis and Forecast, By Country
- Historical Market Size Value (USD Million) Trend Analysis By Market Taxonomy, 2021 to 2025
- Market Size Value (USD Million) Forecast By Market Taxonomy, 2026 to 2036
- By Country
- Brazil
- Chile
- Rest of Latin America
- By Product
- By Form
- By Application
- By End Use
- By Distribution Channel
- By Nature
- By Source
- By Country
- Market Attractiveness Analysis
- By Country
- By Product
- By Form
- By Application
- By End Use
- By Distribution Channel
- By Nature
- By Source
- Key Takeaways
- Western Europe Market Analysis and Forecast, By Country
- Historical Market Size Value (USD Million) Trend Analysis By Market Taxonomy, 2021 to 2025
- Market Size Value (USD Million) Forecast By Market Taxonomy, 2026 to 2036
- By Country
- Germany
- UK
- Italy
- Spain
- France
- Nordic
- BENELUX
- Rest of Western Europe
- By Product
- By Form
- By Application
- By End Use
- By Distribution Channel
- By Nature
- By Source
- By Country
- Market Attractiveness Analysis
- By Country
- By Product
- By Form
- By Application
- By End Use
- By Distribution Channel
- By Nature
- By Source
- Key Takeaways
- Eastern Europe Market Analysis and Forecast, By Country
- Historical Market Size Value (USD Million) Trend Analysis By Market Taxonomy, 2021 to 2025
- Market Size Value (USD Million) Forecast By Market Taxonomy, 2026 to 2036
- By Country
- Russia
- Poland
- Hungary
- Balkan & Baltic
- Rest of Eastern Europe
- By Product
- By Form
- By Application
- By End Use
- By Distribution Channel
- By Nature
- By Source
- By Country
- Market Attractiveness Analysis
- By Country
- By Product
- By Form
- By Application
- By End Use
- By Distribution Channel
- By Nature
- By Source
- Key Takeaways
- East Asia Market Analysis and Forecast, By Country
- Historical Market Size Value (USD Million) Trend Analysis By Market Taxonomy, 2021 to 2025
- Market Size Value (USD Million) Forecast By Market Taxonomy, 2026 to 2036
- By Country
- China
- Japan
- South Korea
- By Product
- By Form
- By Application
- By End Use
- By Distribution Channel
- By Nature
- By Source
- By Country
- Market Attractiveness Analysis
- By Country
- By Product
- By Form
- By Application
- By End Use
- By Distribution Channel
- By Nature
- By Source
- Key Takeaways
- South Asia and Pacific Market Analysis and Forecast, By Country
- Historical Market Size Value (USD Million) Trend Analysis By Market Taxonomy, 2021 to 2025
- Market Size Value (USD Million) Forecast By Market Taxonomy, 2026 to 2036
- By Country
- India
- ASEAN
- Australia & New Zealand
- Rest of South Asia and Pacific
- By Product
- By Form
- By Application
- By End Use
- By Distribution Channel
- By Nature
- By Source
- By Country
- Market Attractiveness Analysis
- By Country
- By Product
- By Form
- By Application
- By End Use
- By Distribution Channel
- By Nature
- By Source
- Key Takeaways
- Middle East & Africa Market Analysis and Forecast, By Country
- Historical Market Size Value (USD Million) Trend Analysis By Market Taxonomy, 2021 to 2025
- Market Size Value (USD Million) Forecast By Market Taxonomy, 2026 to 2036
- By Country
- Kingdom of Saudi Arabia
- Other GCC Countries
- Türkiye
- South Africa
- Other African Union
- Rest of Middle East & Africa
- By Product
- By Form
- By Application
- By End Use
- By Distribution Channel
- By Nature
- By Source
- By Country
- Market Attractiveness Analysis
- By Country
- By Product
- By Form
- By Application
- By End Use
- By Distribution Channel
- By Nature
- By Source
- Key Takeaways
- Key Countries Market Analysis
- USA
- Pricing Analysis
- Market Share Analysis, 2025
- By Product
- By Form
- By Application
- By End Use
- By Distribution Channel
- By Nature
- By Source
- Canada
- Pricing Analysis
- Market Share Analysis, 2025
- By Product
- By Form
- By Application
- By End Use
- By Distribution Channel
- By Nature
- By Source
- Mexico
- Pricing Analysis
- Market Share Analysis, 2025
- By Product
- By Form
- By Application
- By End Use
- By Distribution Channel
- By Nature
- By Source
- Brazil
- Pricing Analysis
- Market Share Analysis, 2025
- By Product
- By Form
- By Application
- By End Use
- By Distribution Channel
- By Nature
- By Source
- Chile
- Pricing Analysis
- Market Share Analysis, 2025
- By Product
- By Form
- By Application
- By End Use
- By Distribution Channel
- By Nature
- By Source
- Germany
- Pricing Analysis
- Market Share Analysis, 2025
- By Product
- By Form
- By Application
- By End Use
- By Distribution Channel
- By Nature
- By Source
- UK
- Pricing Analysis
- Market Share Analysis, 2025
- By Product
- By Form
- By Application
- By End Use
- By Distribution Channel
- By Nature
- By Source
- Italy
- Pricing Analysis
- Market Share Analysis, 2025
- By Product
- By Form
- By Application
- By End Use
- By Distribution Channel
- By Nature
- By Source
- Spain
- Pricing Analysis
- Market Share Analysis, 2025
- By Product
- By Form
- By Application
- By End Use
- By Distribution Channel
- By Nature
- By Source
- France
- Pricing Analysis
- Market Share Analysis, 2025
- By Product
- By Form
- By Application
- By End Use
- By Distribution Channel
- By Nature
- By Source
- India
- Pricing Analysis
- Market Share Analysis, 2025
- By Product
- By Form
- By Application
- By End Use
- By Distribution Channel
- By Nature
- By Source
- ASEAN
- Pricing Analysis
- Market Share Analysis, 2025
- By Product
- By Form
- By Application
- By End Use
- By Distribution Channel
- By Nature
- By Source
- Australia & New Zealand
- Pricing Analysis
- Market Share Analysis, 2025
- By Product
- By Form
- By Application
- By End Use
- By Distribution Channel
- By Nature
- By Source
- China
- Pricing Analysis
- Market Share Analysis, 2025
- By Product
- By Form
- By Application
- By End Use
- By Distribution Channel
- By Nature
- By Source
- Japan
- Pricing Analysis
- Market Share Analysis, 2025
- By Product
- By Form
- By Application
- By End Use
- By Distribution Channel
- By Nature
- By Source
- South Korea
- Pricing Analysis
- Market Share Analysis, 2025
- By Product
- By Form
- By Application
- By End Use
- By Distribution Channel
- By Nature
- By Source
- Russia
- Pricing Analysis
- Market Share Analysis, 2025
- By Product
- By Form
- By Application
- By End Use
- By Distribution Channel
- By Nature
- By Source
- Poland
- Pricing Analysis
- Market Share Analysis, 2025
- By Product
- By Form
- By Application
- By End Use
- By Distribution Channel
- By Nature
- By Source
- Hungary
- Pricing Analysis
- Market Share Analysis, 2025
- By Product
- By Form
- By Application
- By End Use
- By Distribution Channel
- By Nature
- By Source
- Kingdom of Saudi Arabia
- Pricing Analysis
- Market Share Analysis, 2025
- By Product
- By Form
- By Application
- By End Use
- By Distribution Channel
- By Nature
- By Source
- Türkiye
- Pricing Analysis
- Market Share Analysis, 2025
- By Product
- By Form
- By Application
- By End Use
- By Distribution Channel
- By Nature
- By Source
- South Africa
- Pricing Analysis
- Market Share Analysis, 2025
- By Product
- By Form
- By Application
- By End Use
- By Distribution Channel
- By Nature
- By Source
- USA
- Market Structure Analysis
- Competition Dashboard
- Competition Benchmarking
- Market Share Analysis of Top Players
- By Regional
- By Product
- By Form
- By Application
- By End Use
- By Distribution Channel
- By Nature
- By Source
- Emerging Startups
- Innovation Benchmarking
- Competition Analysis
- Competition Deep Dive
- Grecian Magnesite S.A.
- Overview
- Product Portfolio
- Profitability by Market Segments (Product/Region/Sales Channel)
- Sales Footprint
- Strategy Overview
- Marketing Strategy
- Product Strategy
- Channel Strategy
- Mastic S.A.
- Chios Mastiha Growers Association
- Merck KGaA
- Lalilab Inc
- Sharawi Chewing Gum Factory
- Mazaya’s Tobacco-Molasses
- Grecian Magnesite S.A.
- Case Studies
- Success Stories
- Recent Developments
- Competition Deep Dive
- Assumptions & Acronyms Used


