Meningococcal Vaccines Market
Meningococcal Vaccines Market by Product, Age Group, Distribution Channel & Region - Forecast 2022 – 2032
Market Insights on Meningococcal Vaccines covering sales outlook, demand forecast and up-to-date key trends
Meningococcal Vaccines Market Outlook (2022-2032)
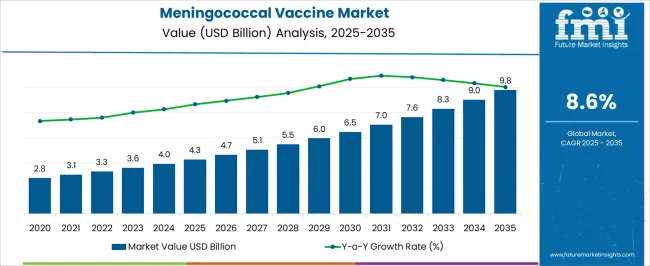
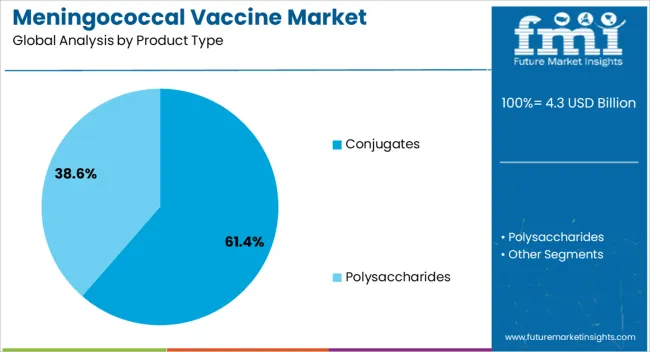
[312 Pages Report] Global meningococcal vaccines market is set to expand at a 8.6% CAGR over the forecast period, reaching US$ 3.4 Bn in 2022. As per Future Market Insights (FMI), in terms of revenue, conjugate vaccines segment dominated the market with 62.6% revenue share in 2021.
Data Points |
Market Insights |
Meningococcal Vaccines Market Base Year Value (2021) |
US$ 3.1 Bn |
Estimated Market Size (2022) |
US$ 3.4 Bn |
Projected Market Valuation (2032) |
US$ 7.7 Bn |
Value-based CAGR (2022-2032) |
8.6% |
Market Share of Top 5 Countries |
65.9% |
Rising prevalence of meningitis, growing demand for permanent cure of meningitis and private-public partnerships to provide funding for immunization programs are some factors that are expected to create opportunities for growth in the market.
Bacterial meningitis, also known as cerebrospinal meningitis, is more aggressive and can lead to permanent damage or death. Survivors of bacterial meningitis may suffer from long-term effects including hearing loss, brain damage, memory loss, learning difficulties, or even septicaemia.
Don't pay for what you don't need
Customize your report by selecting specific countries or regions and save 30%!
How The Market Progressed Till June 2022?
Particulars |
Details |
H1, 2021 |
9.20% |
H1, 2022 Projected |
8.65% |
H1, 2022 Outlook |
8.15% |
BPS Change - H1, 2022 (O) – H1, 2022 (P) |
(-) 50 ↓ |
BPS Change – H1, 2022 (O) – H1, 2021 |
(-) 105 ↓ |
Comparative and review analysis of market dynamics for the meningococcal vaccines market by Future Market Insights revealed that H1-2022 outlook period in comparison to H1-2022 will project a negative growth in terms of Basis Point Share by 50 BPS. However, In H1-2022, the market growth rate of meningococcal vaccines is expected to fall by nearly 105 basis point share (BPS), as per FMI analysis.
A cost-effective vaccine would ideally only need a limited number of doses, be safe for infants, cover most of the pathogenic serogroups, be economically accessible, and offer lifetime immunity. Unfortunately, none of the vaccinations that are currently on the market satisfy these requirements.
Meningococcal polysaccharide vaccines (MPSV) and meningococcal polysaccharide-protein conjugated vaccines (MCV) are currently the only vaccinations for invasive meningococcal disease. MPSV have a number of drawbacks that make the adoption of MCV more advantageous.
First off, due to their low immunogenicity and high disease burden, MPSV are ineffective in younger children (less than 2 years), who have the highest incidence of disease.
Second, they are unable to give long-term immunity since, according to new evidence from a Cochrane review, immunity after the first year of immunisation is not well established. These disadvantages present a restraint towards the market values for meningococcal vaccines, and hence the associated BPS values.
2017-2021 Meningococcal Vaccines Market Historic Outlook Vs 2022-2032 Forecast
The market value for meningococcal vaccines accounted for nearly 5.3% of the overall US$ 59 Bn global vaccines market in 2021.
Threat of pandemic meningitis outbreaks drive investment by government and manufacturers that will propel the demand for meningococcal vaccines in the forthcoming years. Meningococcal outbreak is a public health challenge, especially meningococcal meningitis. The disease is associated with high rate of mortality and long-term neurological defects among infants and children.
Majority of developing countries, including BRICS are taking steps to initiate the development and production of meningococcal vaccines. This is creating significant opportunities for multinational companies to invest in the vaccine production. For instance, ABIVAX Société Anonyme, a French biotechnology company, collaborated with Latin American meningococcal vaccine manufacturer Finlay institute of vaccines in 2014 to commercialize meningococcal vaccines.
Meningococcal vaccinations that are being included in national immunisation programmes will assure a long-term and inexpensive supply of vaccines for both the public and private sectors. For instance, in July, 2020 GSK Australia given Meningococcal B (MenB) vaccination for Aboriginal and Torres Strait Islander infants to the National Immunization Program (NIP).
With the help of global partners such as the World Health Organization (WHO) and the United Nations Children's Fund, vaccines are now being administered more quickly in low-income countries such as Africa. Expanding vaccine access in these underserved markets will augment the growth in the market.
According to the WHO vaccination coverage statistics, nearly 250 million Africans were immunised against meningococcal disease within six years of the vaccine's introduction. By the end of 2020, MenAfriVac will have vaccinated nearly 350 million people in 24 of the 26 nations in the meningitis belt.
The market is expected to expand at a 8.6% CAGR over the forecast period, offering an absolute $ opportunity of US$ 273.4 Mn.
What are the Key Opportunities for Meningococcal Vaccines Manufacturers?
Creating stable vaccine supply in emerging countries provides enormous growth opportunities for manufacturers of meningococcal vaccines. To ensure steady supply, manufacturers must look for high-quality manufacturing capacities to fulfil the unmet demand.
To respond effectively to emergency outbreaks of infectious diseases such as meningococcal disease, collaboration across many parties to develop and assess vaccines, as well as innovative supply and funding models, is becoming increasingly vital. As a result, firms have a great opportunity to enter this market to meet the unmet need for meningococcal vaccinations.
What are the Factors Restraining Demand for Meningococcal Vaccines?
Factors restraining the demand for meningococcal vaccines include limited supply and dependency on few manufacturers. Manufacturer’s access is limited by country’s capacity to support immunization and unawareness among general population. There exists a vast difference in coverage of established and new vaccines, primarily due to low awareness among general population.
Demand of meningococcal vaccines mainly depends on disease outbreaks, funding decisions, adoption by NIP, regulatory scenarios, and competing vaccine introduction priorities. Besides this, manufacturers’ access to certain markets is restricted by the differential pricing strategies adopted by government of developing countries, which further restricts the penetration of newly approved/launched vaccine products.
Country-wise Insights
What is Driving the U.S. Meningococcal Vaccines Market?
“Surging Demand for Meningitis Vaccines in the U.S. will Augment Growth”
The U.S. leads the North America meningococcal vaccine market, accounting for about 94.0% of the total market share in 2021, and is estimated to show the high growth through the forecast period. Expansion in the healthcare sector, along with growing FDA approvals for vaccines and novel drugs in the U.S. will bode well for the market over the forecast period.
For example, the United States Food and Drug Administration (FDA) authorised PREVNAR 20, Pfizer's Pneumococcal 20-valent Conjugate Vaccine, for individuals aged 18 and above, in June 2021. In addition to this, the vaccine includes capsular polysaccharide conjugates for seven additional serotypes that cause invasive pneumococcal disease (IPD) and have been linked to high case fatality rates, antibiotic resistance, and/or meningitis.
Why is the U.K. Meningococcal Vaccines Market Considered Lucrative?
“Rising Prevalence of Meningococcal Disease in the U.K. Will Fuel Sales”
Demand in the U.K. is set to increase at a CAGR of 9.8% in the Europe meningococcal vaccines market during the forecast period. The coverage for immunization with meningococcal vaccines is as high as 90% in infants and 85% in children and adults in the country, which provides an opportunity for manufacturers to introduce their products in the market.
How is the China Meningococcal Vaccines Market Faring?
“Increasing Sales of Meningococcal B Vaccines in China Will Steer Growth”
China accounted for 50.7% of the East Asia meningococcal market share in 2021. High birth rate in China and rising prevalence of meningitis is underpinning the demand for meningococcal vaccines.
According to 2021 figures, the yearly incidence of meningococcal illness and carriage in China was 0.0017–0.0183 per 100,000 people in 2021. Incidence is highest in children under the age of one year, with a case fatality rate of 5.45 percent in 2021. Serogroup B has the highest rate of occurrence.
Get the data you need at a Fraction of the cost
Personalize your report by choosing insights you need
and save 40%!
Category-wise Insights
Which Meningococcal Vaccines Product is Driving the Market?
“Sales of Conjugate Vaccines to Remain High”
Based on product type, the conjugate vaccines segment accounted for 62.6% of the total market share in 2021, owing to its advanced technological features and high adoption rates by end users. Weak antigen and vaccines are combined and linked to a strong antigen as a carrier. This can give strong immune response to weak antigen. This factor is expected to drive sales in the market over the forecast period.
Which is the Leading Age Group in the Meningococcal Vaccines Market?
“Demand for Meningococcal Vaccines Among Adolescents Will Gain Traction”
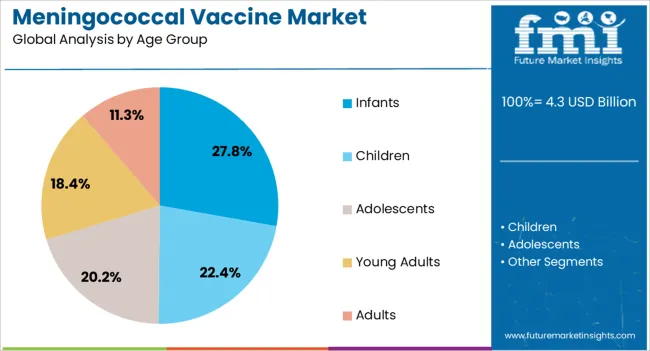
In terms of age group, sales in the adolescents & young adults segment are expected to grow at a CAGR of 7.6% over the assessment period. The segment accounted for about 30.5% of the total market share in 2021.
The metrics are valued as per the disease aggravation. This age group is more prone to meningococcal bacterial infection with life threating issues. In order to prevent the above mentioned factors, young adults have a higher adoption of meningococcal vaccines.
Which Distribution Channel Benefits the Most in the Meningococcal Vaccines Market?
“Adoption of Meningococcal Vaccines Across Public Health Agencies Will Gain Momentum”
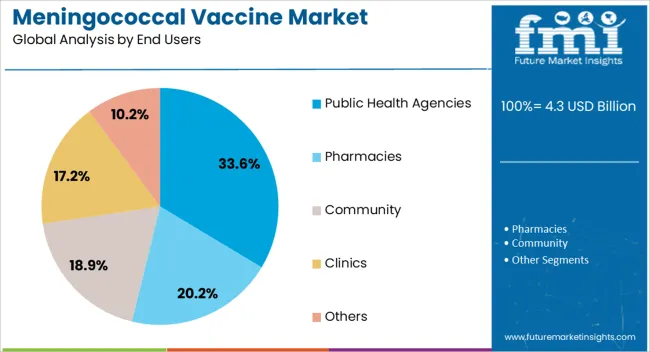
By distribution channel, public health agencies held about 38.1% of the total market share in 2021. Public health agencies have a large foot fall for all kinds of vaccines. Also, companies are focusing on unique strategies for distribution of vaccines across public health agencies.
Competitive Landscape
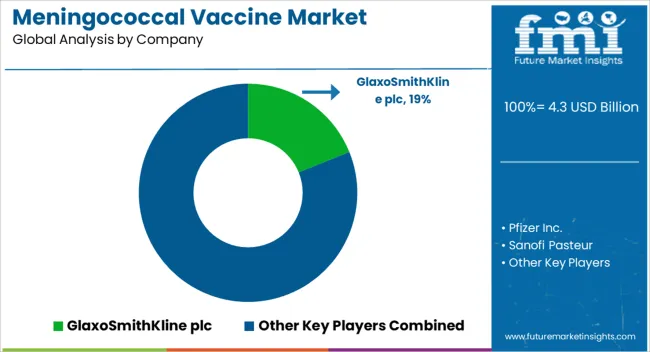
Key players operating in the global meningococcal vaccines market are focusing on the development and launch with regulatory approvals for meningococcal vaccines. Established players within the industry are focusing on mergers and acquisitions for improving their global presence. For instance:
- In August 2020, GlaxoSmithKline plc commenced patient dosing in a phase III clinical study comparing its 5-in-1 meningitis (MenABCWY) vaccine candidate against licenced meningococcal vaccines, Bexsero and Menveo.
- MenQuadfi was authorised by the European Commission (EC) in November 2020 for active vaccination of people aged 12 months and up against invasive meningococcal illness caused by Neisseria meningitis serogroups A, C, W, and Y.
Report Scope as per Meningococcal Vaccines Industry Analysis
Attribute |
Details |
Estimated Market Size (2022) |
US$ 3.4 Bn |
Projected Market Valuation (2032) |
US$ 7.7 Bn |
Value-based CAGR (2022-2032) |
8.6% |
Forecast Period |
2022-2032 |
Historical Data Available for |
2017-2021 |
Market Analysis |
US$ Bn for Value |
Key Regions Covered |
North America, Latin America, Europe, South Asia, East Asia, Oceania and Middle East & Africa |
Key Countries Covered |
The U.S., Canada, Brazil, Mexico, Germany, the U.K., France, Italy, Spain, Russia, Poland, China, Japan, South Korea, India, Thailand, Indonesia, Malaysia, Australia, New Zealand, GCC Countries, Turkey, South Africa and North Africa |
Key Market Segments Covered |
Product, Age Group, Distribution Channel and Region |
Key Companies Profiled |
|
Key Market Segments Covered in Meningococcal Vaccines Industry Research
By Product:
- Polysaccharide
- Conjugate
By Age Group:
- Infants
- Children
- Adolescents & young Adults
- Adults
By Distribution Channel:
- Pharmacies
- Community Clinics
- Public Health Agencies
- Others (hospital pharmacy, private market etc.)
By Region:
- North America
- Latin America
- Europe
- South Asia
- East Asia
- Oceania
- Middle East and Africa (MEA)
Frequently Asked Questions
How much is the meningococcal vaccines market currently worth?
The global meningococcal vaccines market is worth US$ 3.4 Bn in 2022 and is set to expand 2.3X over the forecast period.
What is the sales forecast for meningococcal vaccines through 2032?
The meningococcal vaccines market is expected to reach US$ 7.7 Bn by the end of 2032, with sales growing at a 8.6% CAGR.
What are the key trends shaping the meningococcal vaccines industry?
Expansion of product indications, and increasing pharmacy-based immunization services, are some of the key trends being witnessed in this marketplace.
Which are the top 5 countries driving demand for meningococcal vaccines?
The U.S., the U.K., China, France, and Japan are expected to drive demand for meningococcal vaccines products.
What is the North America market outlook for meningococcal vaccines?
North America is one of the key markets for meningococcal vaccines, with the U.S. expected to account over 94.0% of the North American market in 2021.
At what percentage is the demand for meningococcal vaccines expected to register growth in Europe?
Demand for meningococcal vaccines in Europe is expected to register growth of 8.6% over the next ten years.
Which are the key exporters of meningococcal vaccines market?
Pfizer Inc., Sanofi SA, GSK are the key exporters of meningococcal vaccines market.
Table of Content
1. Executive Summary 1.1. Global Market Outlook 1.2. Analysis and Recommendations 2. Market Overview 2.1. Market Coverage / Taxonomy 2.2. Market Definition / Scope / Limitations 3. Key Market Trends 3.1. Key Trends Impacting the Market 4. Key Success Factors 4.1. Disease Epidemiology 4.2. Pipeline Assessment 4.3. Parent Market Analysis 5. Market Background 5.1. Macro-Economic Factors 5.1.1. Global GDP Growth Outlook 5.1.2. Global Healthcare GDP Growth Overview 5.1.3. Shift Towards Value-Based Healthcare Model 5.1.4. The Most Considered Factor By Companies in Vaccine Pricing 5.1.5. Global Biotechnology Mergers and Acquisition Overview 5.2. Forecast Factors - Relevance & Impact 5.2.1. Global Increase in Healthcare Expenditure 5.2.2. Expanding Product Indications 5.2.3. Endemic outbreaks of Meningococcal disease 5.2.4. Prevalence of Meningococcal disease 5.2.5. Product Penetration Rate across End Users 5.2.6. New/Improved Product Launches 5.3. Market Dynamics 5.3.1. Drivers 5.3.2. Restraints 5.3.3. Opportunity Analysis 6. COVID-19-19 Crisis – Impact Assessment 6.1. COVID-19 Impact-2021 Market Outlook 6.2. Short-Mid-Long Term Outlook 7. Global Market Demand (in Value or Size in US$ Bn) Analysis 2017–2021 and Forecast, 2022–2032 7.1. Historical Market Value (US$ Bn) Analysis, 2017–2021 7.2. Current and Future Market Value (US$ Bn) Projections, 2022–2032 7.2.1. Y-o-Y Growth Trend Analysis 7.2.2. Absolute $ Opportunity Analysis 8. Global Market Analysis 2017–2021 and Forecast 2022–2032, By Product Type 8.1. Introduction / Key Findings 8.2. Historical Market Size (US$ Bn) Analysis By Product Type, 2017–2021 8.3. Current and Future Market Size (US$ Bn) Analysis and Forecast By Product Type, 2022–2032 8.3.1. Polysaccharide Vaccines 8.3.2. Conjugate Vaccines 8.4. Market Attractiveness Analysis By Product Type 9. Global Market Analysis 2017–2021 and Forecast 2022–2032, By Age Group 9.1. Introduction / Key Findings 9.2. Historical Market Size (US$ Bn), By Age Group, 2017–2021 9.3. Current and Future Market Size (US$ Bn) and Forecast By Age Group, 2022–2032 9.3.1. Infants 9.3.2. Children 9.3.3. Adolescents & young Adults 9.3.4. Adults 9.4. Market Attractiveness Analysis By Age Group 10. Global Market Analysis 2017–2021 and Forecast 2022–2032, By Distribution Channel 10.1. Introduction / Key Findings 10.2. Historical Market Size (US$ Bn), By Distribution Channel, 2017–2021 10.3. Current and Future Market Size (US$ Bn) and Forecast By Distribution Channel, 2022–2032 10.3.1. Pharmacies 10.3.2. Community Clinics 10.3.3. Public Health Agencies 10.3.4. Others (hospital pharmacy, private market etc.) 10.4. Market Attractiveness Analysis By Distribution Channel 11. Global Market Analysis 2017–2021 and Forecast 2022–2032, by Region 11.1. Introduction 11.2. Historical Market Size (US$ Bn) Analysis By Region, 2017–2021 11.3. Current Market Size (US$ Bn) Analysis and Forecast By Region, 2022–2032 11.3.1. North America 11.3.2. Latin America 11.3.3. Europe 11.3.4. East Asia 11.3.5. South Asia 11.3.6. Oceania 11.3.7. Middle East and Africa (MEA) 11.4. Market Attractiveness Analysis By Region 12. North America Market Analysis 2017–2021 and Forecast 2022–2032 12.1. Introduction 12.2. Historical Market Size (US$ Bn) and Trend Analysis By Market Taxonomy, 2017–2021 12.3. Market Size (US$ Bn) Forecast By Market Taxonomy, 2022–2032 12.3.1. By Country 12.3.1.1. U.S. 12.3.1.2. Canada 12.3.2. By Product Type 12.3.3. By Age Group 12.3.4. By Distribution Channel 12.4. Market Attractiveness Analysis 12.4.1. By Country 12.4.2. By Product Type 12.4.3. By Age Group 12.4.4. By Distribution Channel 12.5. Key Market Participants - Intensity Mapping 12.6. Drivers and Restraints - Impact Analysis 12.7. Country Level Analysis & Forecast 12.7.1. U.S. Market Analysis 12.7.1.1. Introduction 12.7.1.2. Market Analysis and Forecast by Market Taxonomy 12.7.1.2.1. By Product Type 12.7.1.2.2. By Age Group 12.7.1.2.3. By Distribution Channel 12.7.2. Canada Market Analysis 12.7.2.1. Introduction 12.7.2.2. Market Analysis and Forecast by Market Taxonomy 12.7.2.2.1. By Product Type 12.7.2.2.2. By Age Group 12.7.2.2.3. By Distribution Channel 13. Latin America Market Analysis 2017–2021 and Forecast 2022–2032 13.1. Introduction 13.2. Historical Market Size (US$ Bn) and Trend Analysis By Market Taxonomy, 2017–2021 13.3. Market Size (US$ Bn) Forecast By Market Taxonomy, 2022–2032 13.3.1. By Country 13.3.1.1. Mexico 13.3.1.2. Brazil 13.3.1.3. Argentina 13.3.1.4. Rest of Latin America 13.3.2. By Product Type 13.3.3. By Age Group 13.3.4. By Distribution Channel 13.4. Market Attractiveness Analysis 13.4.1. By Country 13.4.2. By Product Type 13.4.3. By Age Group 13.4.4. By Distribution Channel 13.5. Key Market Participants - Intensity Mapping 13.6. Drivers and Restraints - Impact Analysis 13.7. Country Level Analysis & Forecast 13.7.1. Mexico Market Analysis 13.7.1.1. Introduction 13.7.1.2. Market Analysis and Forecast by Market Taxonomy 13.7.1.2.1. By Product Type 13.7.1.2.2. By Age Group 13.7.1.2.3. By Distribution Channel 13.7.2. Brazil Market Analysis 13.7.2.1. Introduction 13.7.2.2. Market Analysis and Forecast by Market Taxonomy 13.7.2.2.1. By Product Type 13.7.2.2.2. By Age Group 13.7.2.2.3. By Distribution Channel 13.7.3. Argentina Market Analysis 13.7.3.1. Introduction 13.7.3.2. Market Analysis and Forecast by Market Taxonomy 13.7.3.2.1. By Product Type 13.7.3.2.2. By Age Group 13.7.3.2.3. By Distribution Channel 13.7.4. Rest of the Latin America Market Analysis 13.7.4.1. Introduction 13.7.4.2. Market Analysis and Forecast by Market Taxonomy 13.7.4.2.1. By Product Type 13.7.4.2.2. By Age Group 13.7.4.2.3. By Distribution Channel 14. Europe Market Analysis 2017–2021 and Forecast 2022–2032 14.1. Introduction 14.2. Historical Market Size (US$ Bn) and Trend Analysis By Market Taxonomy, 2017–2021 14.3. Market Size (US$ Bn) Forecast By Market Taxonomy, 2022–2032 14.3.1. By Country 14.3.1.1. Germany 14.3.1.2. Italy 14.3.1.3. France 14.3.1.4. U.K. 14.3.1.5. Spain 14.3.1.6. Poland 14.3.1.7. Russia 14.3.1.8. Rest of Europe 14.3.2. By Product Type 14.3.3. By Age Group 14.3.4. By Distribution Channel 14.4. Market Attractiveness Analysis 14.4.1. By Country 14.4.2. By Product Type 14.4.3. By Age Group 14.4.4. By Distribution Channel 14.5. Key Market Participants - Intensity Mapping 14.6. Drivers and Restraints - Impact Analysis 14.7. Country Level Analysis & Forecast 14.7.1. Germany Market Analysis 14.7.1.1. Introduction 14.7.1.2. Market Analysis and Forecast by Market Taxonomy 14.7.1.2.1. By Product Type 14.7.1.2.2. By Age Group 14.7.1.2.3. By Distribution Channel 14.7.2. Italy Market Analysis 14.7.2.1. Introduction 14.7.2.2. Market Analysis and Forecast by Market Taxonomy 14.7.2.2.1. By Product Type 14.7.2.2.2. By Age Group 14.7.2.2.3. By Distribution Channel 14.7.3. France Market Analysis 14.7.3.1. Introduction 14.7.3.2. Market Analysis and Forecast by Market Taxonomy 14.7.3.2.1. By Product Type 14.7.3.2.2. By Age Group 14.7.3.2.3. By Distribution Channel 14.7.4. U.K. Market Analysis 14.7.4.1. Introduction 14.7.4.2. Market Analysis and Forecast by Market Taxonomy 14.7.4.2.1. By Product Type 14.7.4.2.2. By Age Group 14.7.4.2.3. By Distribution Channel 14.7.5. Spain Market Analysis 14.7.5.1. Introduction 14.7.5.2. Market Analysis and Forecast by Market Taxonomy 14.7.5.2.1. By Product Type 14.7.5.2.2. By Age Group 14.7.5.2.3. By Distribution Channel 14.7.6. Poland Market Analysis 14.7.6.1. Introduction 14.7.6.2. Market Analysis and Forecast by Market Taxonomy 14.7.6.2.1. By Product Type 14.7.6.2.2. By Age Group 14.7.6.2.3. By Distribution Channel 14.7.7. Russia Market Analysis 14.7.7.1. Introduction 14.7.7.2. Market Analysis and Forecast by Market Taxonomy 14.7.7.2.1. By Product Type 14.7.7.2.2. By Age Group 14.7.7.2.3. By Distribution Channel 15. South Asia Market Analysis 2017–2021 and Forecast 2022–2032 15.1. Introduction 15.2. Historical Market Size (US$ Bn) and Trend Analysis By Market Taxonomy, 2017–2021 15.3. Market Size (US$ Bn) Forecast By Market Taxonomy, 2022–2032 15.3.1. By Country 15.3.1.1. India 15.3.1.2. Indonesia 15.3.1.3. Malaysia 15.3.1.4. Thailand 15.3.1.5. Rest of South Asia 15.3.2. By Product Type 15.3.3. By Age Group 15.3.4. By Distribution Channel 15.4. Market Attractiveness Analysis 15.4.1. By Country 15.4.2. By Product Type 15.4.3. By Age Group 15.4.4. By Distribution Channel 15.5. Key Market Participants - Intensity Mapping 15.6. Drivers and Restraints - Impact Analysis 15.7. Country Level Analysis & Forecast 15.7.1. India Market Analysis 15.7.1.1. Introduction 15.7.1.2. Market Analysis and Forecast by Market Taxonomy 15.7.1.2.1. By Product Type 15.7.1.2.2. By Age Group 15.7.1.2.3. By Distribution Channel 15.7.2. Indonesia Market Analysis 15.7.2.1. Introduction 15.7.2.2. Market Analysis and Forecast by Market Taxonomy 15.7.2.2.1. By Product Type 15.7.2.2.2. By Age Group 15.7.2.2.3. By Distribution Channel 15.7.3. Malaysia Market Analysis 15.7.3.1. Introduction 15.7.3.2. Market Analysis and Forecast by Market Taxonomy 15.7.3.2.1. By Product Type 15.7.3.2.2. By Age Group 15.7.3.2.3. By Distribution Channel 15.7.4. Thailand Market Analysis 15.7.4.1. Introduction 15.7.4.2. Market Analysis and Forecast by Market Taxonomy 15.7.4.2.1. By Product Type 15.7.4.2.2. By Age Group 15.7.4.2.3. By Distribution Channel 15.7.5. Rest of South Asia Market Analysis 15.7.5.1. Introduction 15.7.5.2. Market Analysis and Forecast by Market Taxonomy 15.7.5.2.1. By Product Type 15.7.5.2.2. By Age Group 15.7.5.2.3. By Distribution Channel 16. East Asia Market Analysis 2017–2021 and Forecast 2022–2032 16.1. Introduction 16.2. Historical Market Size (US$ Bn) and Trend Analysis By Market Taxonomy, 2017–2021 16.3. Market Size (US$ Bn) Forecast By Market Taxonomy, 2022–2032 16.3.1. By Country 16.3.1.1. China 16.3.1.2. Japan 16.3.1.3. South Korea 16.3.2. By Product Type 16.3.3. By Age Group 16.3.4. By Distribution Channel 16.4. Market Attractiveness Analysis 16.4.1. By Country 16.4.2. By Product Type 16.4.3. By Age Group 16.4.4. By Distribution Channel 16.5. Key Market Participants - Intensity Mapping 16.6. Drivers and Restraints - Impact Analysis 16.7. Country Level Analysis & Forecast 16.7.1. China Market Analysis 16.7.1.1. Introduction 16.7.1.2. Market Analysis and Forecast by Market Taxonomy 16.7.1.2.1. By Product Type 16.7.1.2.2. By Age Group 16.7.1.2.3. By Distribution Channel 16.7.2. Japan Market Analysis 16.7.2.1. Introduction 16.7.2.2. Market Analysis and Forecast by Market Taxonomy 16.7.2.2.1. By Product Type 16.7.2.2.2. By Age Group 16.7.2.2.3. By Distribution Channel 16.7.3. South Korea Market Analysis 16.7.3.1. Introduction 16.7.3.2. Market Analysis and Forecast by Market Taxonomy 16.7.3.2.1. By Product Type 16.7.3.2.2. By Age Group 16.7.3.2.3. By Distribution Channel 17. Oceania Market 2017-2021 and Forecast 2022-2032 17.1. Introduction 17.2. Historical Market Size (US$ Bn) Trend Analysis By Market Taxonomy, 2017–2021 17.3. Market Size (US$ Bn) Forecast By Market Taxonomy, 2022–2032 17.3.1. By Country 17.3.1.1. Australia 17.3.1.2. New Zealand 17.3.2. By Product Type 17.3.3. By Age Group 17.3.4. By Distribution Channel 17.4. Market Attractiveness Analysis 17.4.1. By Country 17.4.2. By Product Type 17.4.3. By Age Group 17.4.4. By Distribution Channel 17.5. Key Market Participants - Intensity Mapping 17.6. Drivers and Restraints - Impact Analysis 17.7. Country Level Analysis & Forecast 17.7.1. Australia Market Analysis 17.7.1.1. Introduction 17.7.1.2. Market Analysis and Forecast by Market Taxonomy 17.7.1.2.1. By Product Type 17.7.1.2.2. By Age Group 17.7.1.2.3. By Distribution Channel 17.7.2. New Zealand Market Analysis 17.7.2.1. Introduction 17.7.2.2. Market Analysis and Forecast by Market Taxonomy 17.7.2.2.1. By Product Type 17.7.2.2.2. By Age Group 17.7.2.2.3. By Distribution Channel 18. Middle East and Africa (MEA) Market Analysis 2017–2021 and Forecast 2022–2032 18.1. Introduction 18.2. Historical Market Size (US$ Bn) and Trend Analysis By Market Taxonomy, 2017–2021 18.3. Market Size (US$ Bn) Forecast By Market Taxonomy, 2022–2032 18.3.1. By Country 18.3.1.1. GCC Countries 18.3.1.2. South Africa 18.3.1.3. Rest of Middle East and Africa 18.3.2. By Product Type 18.3.3. By Age Group 18.3.4. By Distribution Channel 18.4. Market Attractiveness Analysis 18.4.1. By Country 18.4.2. By Product Type 18.4.3. By Age Group 18.4.4. By Distribution Channel 18.5. Key Market Participants - Intensity Mapping 18.6. Drivers and Restraints - Impact Analysis 18.7. Country Level Analysis & Forecast 18.7.1. GCC Countries Market Analysis 18.7.1.1. Introduction 18.7.1.2. Market Analysis and Forecast by Market Taxonomy 18.7.1.2.1. By Product Type 18.7.1.2.2. By Age Group 18.7.1.2.3. By Distribution Channel 18.7.2. South Africa & North Africa Market Analysis 18.7.2.1. Introduction 18.7.2.2. Market Analysis and Forecast by Market Taxonomy 18.7.2.2.1. By Product Type 18.7.2.2.2. By Age Group 18.7.2.2.3. By Distribution Channel 18.7.3. Rest of MEA Market Analysis 18.7.3.1. Introduction 18.7.3.2. Market Analysis and Forecast by Market Taxonomy 18.7.3.2.1. By Product Type 18.7.3.2.2. By Age Group 18.7.3.2.3. By Distribution Channel 19. Market Structure Analysis 19.1. Market Analysis by Tier of Companies 19.2. Market Share Analysis of Top Players 20. Competition Analysis 20.1. Competition Dashboard 20.2. Competition Deep Dive 20.2.1. Pfizer Inc. 20.2.1.1. Overview 20.2.1.2. Product Portfolio 20.2.1.3. Key Financials 20.2.1.4. Sales Footprint 20.2.1.5. Strategy Overview 20.2.2. GlaxoSmithKline plc. 20.2.2.1. Overview 20.2.2.2. Product Portfolio 20.2.2.3. Key Financials 20.2.2.4. Sales Footprint 20.2.2.5. Strategy Overview 20.2.3. Sanofi SA 20.2.3.1. Overview 20.2.3.2. Product Portfolio 20.2.3.3. Key Financials 20.2.3.4. Sales Footprint 20.2.3.5. Strategy Overview 20.2.4. Serum Institute of India 20.2.4.1. Overview 20.2.4.2. Product Portfolio 20.2.4.3. Key Financials 20.2.4.4. Sales Footprint 20.2.4.5. Strategy Overview 21. Assumptions and Acronyms Used 22. Research Methodology
Don't pay for what you don't need
Customize your report by selecting specific countries or regions and save 30%!
List of Tables
Table 01: Global Market Value (US$ Bn) Analysis- and Opportunity Assessment 2017–2032, By Product Type Table 02: Global Market Value (US$ Bn) Analysis and Opportunity Assessment 2017–2032, By Age Group Table 03: Global Market Value (US$ Bn) Analysis- and Opportunity Assessment 2017–2032, By Distribution Channel Table 04: Global Market Value (US$ Bn) Analysis and Opportunity Assessment 2017–2032, By Country Table 05: North America Market Value (US$ Bn) Analysis 2017-2021 and Forecast 2022–2032, By Country Table 06: North America Market Value (US$ Bn) Analysis and Opportunity Assessment 2017–2032, By Product Type Table 07: North America Market Value (US$ Bn) Analysis and Opportunity Assessment 2017–2032, By Age Group Table 08: North America Market Value (US$ Bn) Analysis- and Opportunity Assessment 2017–2032, By Distribution Channel Table 09: Latin America Market Value (US$ Bn) Analysis 2017-2021 and Forecast 2022–2032, By Country Table 10: Latin America Market Value (US$ Bn) Analysis and Opportunity Assessment 2017–2032, By Product Type Table 11: Latin America Market Value (US$ Bn) Analysis and Opportunity Assessment 2017–2032, By Age Group Table 12: Latin America Market Value (US$ Bn) Analysis- and Opportunity Assessment 2017–2032, By Distribution Channel Table 13: Europe Market Value (US$ Bn) Analysis 2017-2021 and Forecast 2022–2032, By Country Table 14: Europe Market Value (US$ Bn) Analysis and Opportunity Assessment 2017–2032, By Product Type Table 15: Europe Market Value (US$ Bn) Analysis and Opportunity Assessment 2017–2032, By Age Group Table 16: Europe Market Value (US$ Bn) Analysis- and Opportunity Assessment 2017–2032, By Distribution Channel Table 17: South Asia Market Value (US$ Bn) Analysis 2017-2021 and Forecast 2022–2032, By Country Table 18: South Asia Market Value (US$ Bn) Analysis and Opportunity Assessment 2017–2032, By Product Type Table 19: South Asia Market Value (US$ Bn) Analysis and Opportunity Assessment 2017–2032, By Age Group Table 20: South Asia Market Value (US$ Bn) Analysis- and Opportunity Assessment 2017–2032, By Distribution Channel Table 21: East Asia Market Value (US$ Bn) Analysis 2017-2021 and Forecast 2022–2032, By Country Table 22: East Asia Market Value (US$ Bn) Analysis and Opportunity Assessment 2017–2032, By Product Type Table 23: East Asia Market Value (US$ Bn) Analysis and Opportunity Assessment 2017–2032, By Age Group Table 24: East Asia Market Value (US$ Bn) Analysis- and Opportunity Assessment 2017–2032, By Distribution Channel Table 25: Oceania Market Value (US$ Bn) Analysis 2017-2021 and Forecast 2022–2032, By Country Table 26: Oceania Market Value (US$ Bn) Analysis and Opportunity Assessment 2017–2032, By Product Type Table 27: Oceania Market Value (US$ Bn) Analysis and Opportunity Assessment 2017–2032, By Age Group Table 28: Oceania Market Value (US$ Bn) Analysis- and Opportunity Assessment 2017–2032, By Distribution Channel Table 29: MEA Market Value (US$ Bn) Analysis 2017-2021 and Forecast 2022–2032, By Country Table 30: MEA Market Value (US$ Bn) Analysis and Opportunity Assessment 2017–2032, By Product Type Table 31: MEA Market Value (US$ Bn) Analysis and Opportunity Assessment 2017–2032, By Age Group Table 32: MEA Market Value (US$ Bn) Analysis- and Opportunity Assessment 2017–2032, By Distribution Channel
List of Charts
Figure 01: Global Market Value Analysis (US$ Bn), 2017-2021 Figure 02: Global Market Value Forecast (US$ Bn), 2022–2032 Figure 03: Global Market Absolute $ Opportunity, 2022 - 2032 Figure 04: Global Market Share Analysis (%), By Product Type, 2022 & 2032 Figure 05: Global Market Y-o-Y Analysis (%), By Product Type, 2022–2032 Figure 06: Global Market Attractiveness Analysis by Product Type, 2022–2032 Figure 07: Global Market Share Analysis (%), By Age Group, 2022 & 2032 Figure 08: Global Market Y-o-Y Analysis (%), By Age Group, 2022–2032 Figure 09: Global Market Attractiveness Analysis By Age Group, 2022–2032 Figure 10: Global Market Share Analysis (%), By Distribution Channel, 2022 & 2032 Figure 11: Global Market Y-o-Y Analysis (%), By Distribution Channel, 2022–2032 Figure 12: Global Market Attractiveness Analysis By Distribution Channel, 2022–2032 Figure 13: Global Market Share Analysis (%), By Region , 2022 & 2032 Figure 14: Global Market Y-o-Y Analysis (%), By Country, 2022–2032 Figure 15: Global Market Attractiveness Analysis by Region, 2022–2032 Figure 16: North America Market Value Share, By Product Type, 2022 (E) Figure 17: North America Market Value Share, By Age Group, 2022 (E) Figure 18: North America Market Value Share, By Distribution Channel, 2022 (E) Figure 19: North America Market Value Share, By Country, 2022 (E) Figure 20: North America Market Value Analysis (US$ Bn), 2017-2021 Figure 21: North America Market Value Forecast (US$ Bn), 2022–2032 Figure 22: North America Market Attractiveness Analysis by Product Type, 2022–2032 Figure 23: North America Market Attractiveness Analysis by Age Group, 2022–2032 Figure 24: North America Market Attractiveness Analysis By Distribution Channel, 2022–2032 Figure 25: North America Market Attractiveness Analysis By Country, 2022–2032 Figure 26: U.S. Market Value Proportion Analysis, 2022 Figure 27: Global Vs. U.S. Growth Comparison Figure 28: U.S. Market Share Analysis (%) By Product Type, 2022 & 2032 Figure 29: U.S. Market Share Analysis (%) by Age Group, 2022 & 2032 Figure 30: U.S. Market Share Analysis (%) by Distribution Channel, 2022 & 2032 Figure 31: Canada Market Value Proportion Analysis, 2022 Figure 32: Global Vs. Canada Growth Comparison Figure 33: Canada Market Share Analysis (%) By Product Type, 2022 & 2032 Figure 34: Canada Market Share Analysis (%) by Age Group, 2022 & 2032 Figure 35: Canada Market Share Analysis (%) by Distribution Channel, 2022 & 2032 Figure 36: Latin America Market Value Share, By Product Type, 2022 (E) Figure 37: Latin America Market Value Share, By Age Group, 2022 (E) Figure 38: Latin America Market Value Share, By Distribution Channel, 2022 (E) Figure 39: Latin America Market Value Share, By Country, 2022 (E) Figure 40: Latin America Market Value Analysis (US$ Bn), 2017-2021 Figure 41: Latin America Market Value Forecast (US$ Bn), 2022–2032 Figure 42: Latin America Market Attractiveness Analysis by Product Type, 2022–2032 Figure 43: Latin America Market Attractiveness Analysis by Age Group, 2022–2032 Figure 44: Latin America Market Attractiveness Analysis By Distribution Channel, 2022–2032 Figure 45: Latin America Market Attractiveness Analysis By Country, 2022–2032 Figure 46: Brazil Market Value Proportion Analysis, 2022 Figure 47: Global Vs. Brazil Growth Comparison Figure 48: Brazil Market Share Analysis (%) By Product Type, 2022 & 2032 Figure 49: Brazil Market Share Analysis (%) by Age Group, 2022 & 2032 Figure 50: Brazil Market Share Analysis (%) by Distribution Channel, 2022 & 2032 Figure 51: Mexico Market Value Proportion Analysis, 2022 Figure 52: Global Vs. Mexico Growth Comparison Figure 53: Mexico Market Share Analysis (%) By Product Type, 2022 & 2032 Figure 54: Mexico Market Share Analysis (%) by Age Group, 2022 & 2032 Figure 55: Mexico Market Share Analysis (%) by Distribution Channel, 2022 & 2032 Figure 56: Europe Market Value Share, By Product Type, 2022 (E) Figure 57: Europe Market Value Share, By Age Group, 2022 (E) Figure 58: Europe Market Value Share, By Distribution Channel, 2022 (E) Figure 59: Europe Market Value Share, By Country, 2022 (E) Figure 60: Europe Market Value Analysis (US$ Bn), 2017-2021 Figure 61: Europe Market Value Forecast (US$ Bn), 2022–2032 Figure 62: Europe Market Attractiveness Analysis by Product Type, 2022–2032 Figure 63: Europe Market Attractiveness Analysis by Age Group, 2022–2032 Figure 64: Europe Market Attractiveness Analysis By Distribution Channel, 2022–2032 Figure 65: Europe Market Attractiveness Analysis By Country, 2022–2032 Figure 66: U.K. Market Value Proportion Analysis, 2022 Figure 67: Global Vs. U.K. Growth Comparison Figure 68: U.K. Market Share Analysis (%) By Product Type, 2022 & 2032 Figure 69: U.K. Market Share Analysis (%) by Age Group, 2022 & 2032 Figure 70: U.K. Market Share Analysis (%) by Distribution Channel, 2022 & 2032 Figure 71: France Market Value Proportion Analysis, 2022 Figure 72: Global Vs. France Growth Comparison Figure 73: France Market Share Analysis (%) By Product Type, 2022 & 2032 Figure 74: France Market Share Analysis (%) by Age Group, 2022 & 2032 Figure 75: France Market Share Analysis (%) by Distribution Channel, 2022 & 2032 Figure 76: Germany Market Value Proportion Analysis, 2022 Figure 77: Global Vs. Germany Growth Comparison Figure 78: Germany Market Share Analysis (%) By Product Type, 2022 & 2032 Figure 79: Germany Market Share Analysis (%) by Age Group, 2022 & 2032 Figure 80: Germany Market Share Analysis (%) by Distribution Channel, 2022 & 2032 Figure 81: Italy Market Value Proportion Analysis, 2022 Figure 82: Global Vs. Italy Growth Comparison Figure 83: Italy Market Share Analysis (%) By Product Type, 2022 & 2032 Figure 84: Italy Market Share Analysis (%) by Age Group, 2022 & 2032 Figure 85: Italy Market Share Analysis (%) by Distribution Channel, 2022 & 2032 Figure 86: Spain Market Value Proportion Analysis, 2022 Figure 87: Global Vs. Spain Growth Comparison Figure 88: Spain Market Share Analysis (%) By Product Type, 2022 & 2032 Figure 89: Spain Market Share Analysis (%) by Age Group, 2022 & 2032 Figure 90: Spain Market Share Analysis (%) by Distribution Channel, 2022 & 2032 Figure 91: Russia Market Value Proportion Analysis, 2022 Figure 92: Global Vs. Russia Growth Comparison Figure 93: Russia Market Share Analysis (%) By Product Type, 2022 & 2032 Figure 94: Russia Market Share Analysis (%) by Age Group, 2022 & 2032 Figure 95: Russia Market Share Analysis (%) by Distribution Channel, 2022 & 2032 Figure 96: Poland Market Value Proportion Analysis, 2022 Figure 97: Global Vs. Poland Growth Comparison Figure 98: Poland Market Share Analysis (%) By Product Type, 2022 & 2032 Figure 99: Poland Market Share Analysis (%) by Age Group, 2022 & 2032 Figure 100: Poland Market Share Analysis (%) by Distribution Channel, 2022 & 2032 Figure 101: South Asia Market Value Share, By Product Type, 2022 (E) Figure 102: South Asia Market Value Share, By Age Group, 2022 (E) Figure 103: South Asia Market Value Share, By Distribution Channel, 2022 (E) Figure 104: South Asia Market Value Share, By Country, 2022 (E) Figure 105: South Asia Market Value Analysis (US$ Bn), 2017-2021 Figure 106: South Asia Market Value Forecast (US$ Bn), 2022–2032 Figure 107: South Asia Market Attractiveness Analysis by Product Type, 2022–2032 Figure 108: South Asia Market Attractiveness Analysis by Age Group, 2022–2032 Figure 109: South Asia Market Attractiveness Analysis By Distribution Channel, 2022–2032 Figure 110: South Asia Market Attractiveness Analysis By Country, 2022–2032 Figure 111: India Market Value Proportion Analysis, 2022 Figure 112: Global Vs. India Growth Comparison Figure 113: India Market Share Analysis (%) By Product Type, 2022 & 2032 Figure 114: India Market Share Analysis (%) by Age Group, 2022 & 2032 Figure 115: India Market Share Analysis (%) by Distribution Channel, 2022 & 2032 Figure 116: Thailand Market Value Proportion Analysis, 2022 Figure 117: Global Vs. Thailand Growth Comparison Figure 118: Thailand Market Share Analysis (%) By Product Type, 2022 & 2032 Figure 119: Thailand Market Share Analysis (%) by Age Group, 2022 & 2032 Figure 120: Thailand Market Share Analysis (%) by Distribution Channel, 2022 & 2032 Figure 121: Malaysia Market Value Proportion Analysis, 2022 Figure 122: Global Vs. Malaysia Growth Comparison Figure 123: Malaysia Market Share Analysis (%) By Product Type, 2022 & 2032 Figure 124: Malaysia Market Share Analysis (%) by Age Group, 2022 & 2032 Figure 125: Malaysia Market Share Analysis (%) by Distribution Channel, 2022 & 2032 Figure 126: Indonesia Market Value Proportion Analysis, 2022 Figure 127: Global Vs. Indonesia Growth Comparison Figure 128: Indonesia Market Share Analysis (%) By Product Type, 2022 & 2032 Figure 129: Indonesia Market Share Analysis (%) by Age Group, 2022 & 2032 Figure 130: Indonesia Market Share Analysis (%) by Distribution Channel, 2022 & 2032 Figure 131: East Asia Market Value Share, By Product Type, 2022 (E) Figure 132: East Asia Market Value Share, By Age Group, 2022 (E) Figure 133: East Asia Market Value Share, By Distribution Channel, 2022 (E) Figure 134: East Asia Market Value Share, By Country, 2022 (E) Figure 135: East Asia Market Value Analysis (US$ Bn), 2017-2021 Figure 136: East Asia Market Value Forecast (US$ Bn), 2022–2032 Figure 137: East Asia Market Attractiveness Analysis by Product Type, 2022–2032 Figure 138: East Asia Market Attractiveness Analysis by Age Group, 2022–2032 Figure 139: East Asia Market Attractiveness Analysis By Distribution Channel, 2022–2032 Figure 140: East Asia Market Attractiveness Analysis By Country, 2022–2032 Figure 141: China Market Value Proportion Analysis, 2022 Figure 142: Global Vs. China Growth Comparison Figure 143: China Market Share Analysis (%) By Product Type, 2022 & 2032 Figure 144: China Market Share Analysis (%) by Age Group, 2022 & 2032 Figure 145: China Market Share Analysis (%) by Distribution Channel, 2022 & 2032 Figure 146: Japan Market Value Proportion Analysis, 2022 Figure 147: Global Vs. Japan Growth Comparison Figure 148: Japan Market Share Analysis (%) By Product Type, 2022 & 2032 Figure 149: Japan Market Share Analysis (%) by Age Group, 2022 & 2032 Figure 150: Japan Market Share Analysis (%) by Distribution Channel, 2022 & 2032 Figure 151: South Korea Market Value Proportion Analysis, 2022 Figure 152: Global Vs. South Korea Growth Comparison Figure 153: South Korea Market Share Analysis (%) By Product Type, 2022 & 2032 Figure 154: South Korea Market Share Analysis (%) by Age Group, 2022 & 2032 Figure 155: South Korea Market Share Analysis (%) by Distribution Channel, 2022 & 2032 Figure 156: Oceania Market Value Share, By Product Type, 2022 (E) Figure 157: Oceania Market Value Share, By Age Group, 2022 (E) Figure 158: Oceania Market Value Share, By Distribution Channel, 2022 (E) Figure 159: Oceania Market Value Share, By Country, 2022 (E) Figure 160: Oceania Market Value Analysis (US$ Bn), 2017-2021 Figure 161: Oceania Market Value Forecast (US$ Bn), 2022–2032 Figure 162: Oceania Market Attractiveness Analysis by Product Type, 2022–2032 Figure 163: Oceania Market Attractiveness Analysis by Age Group, 2022–2032 Figure 164: Oceania Market Attractiveness Analysis By Distribution Channel, 2022–2032 Figure 165: Oceania Market Attractiveness Analysis By Country, 2022–2032 Figure 166: Australia Market Value Proportion Analysis, 2022 Figure 167: Global Vs. Australia Growth Comparison Figure 168: Australia Market Share Analysis (%) By Product Type, 2022 & 2032 Figure 169: Australia Market Share Analysis (%) by Age Group, 2022 & 2032 Figure 170: Australia Market Share Analysis (%) by Distribution Channel, 2022 & 2032 Figure 171: New Zealand Market Value Proportion Analysis, 2022 Figure 172: Global Vs. New Zealand Growth Comparison Figure 173: New Zealand Market Share Analysis (%) By Product Type, 2022 & 2032 Figure 174: New Zealand Market Share Analysis (%) by Age Group, 2022 & 2032 Figure 175: New Zealand Market Share Analysis (%) by Distribution Channel, 2022 & 2032 Figure 176: MEA Market Value Share, By Product Type, 2022 (E) Figure 177: MEA Market Value Share, By Age Group, 2022 (E) Figure 178: MEA Market Value Share, By Distribution Channel, 2022 (E) Figure 179: MEA Market Value Share, By Country, 2022 (E) Figure 180: MEA Market Value Analysis (US$ Bn), 2017-2021 Figure 181: MEA Market Value Forecast (US$ Bn), 2022–2032 Figure 182: MEA Market Attractiveness Analysis by Product Type, 2022–2032 Figure 183: MEA Market Attractiveness Analysis by Age Group, 2022–2032 Figure 184: MEA Market Attractiveness Analysis By Distribution Channel, 2022–2032 Figure 185: MEA Market Attractiveness Analysis By Country, 2022–2032 Figure 186: Turkey Market Value Proportion Analysis, 2022 Figure 187: Global Vs. Turkey Growth Comparison Figure 188: Turkey Market Share Analysis (%) By Product Type, 2022 & 2032 Figure 189: Turkey Market Share Analysis (%) by Age Group, 2022 & 2032 Figure 190: Turkey Market Share Analysis (%) by Distribution Channel, 2022 & 2032 Figure 191: GCC Countries Market Value Proportion Analysis, 2022 Figure 192: Global Vs. GCC Countries Growth Comparison Figure 193: GCC Countries Market Share Analysis (%) By Product Type, 2022 & 2032 Figure 194: GCC Countries Market Share Analysis (%) by Age Group, 2022 & 2032 Figure 195: GCC Countries Market Share Analysis (%) by Distribution Channel, 2022 & 2032 Figure 196: North Africa Market Value Proportion Analysis, 2022 Figure 197: Global Vs. North Africa Growth Comparison Figure 198: North Africa Market Share Analysis (%) By Product Type, 2022 & 2032 Figure 199: North Africa Market Share Analysis (%) by Age Group, 2022 & 2032 Figure 200: North Africa Market Share Analysis (%) by Distribution Channel, 2022 & 2032 Figure 201: South Africa Market Value Proportion Analysis, 2022 Figure 202: Global Vs. South Africa Growth Comparison Figure 203: South Africa Market Share Analysis (%) By Product Type, 2022 & 2032 Figure 204: South Africa Market Share Analysis (%) by Age Group, 2022 & 2032 Figure 205: South Africa Market Share Analysis (%) by Distribution Channel, 2022 & 2032
Recommendations
Explore Healthcare Insights
View Reports