Mosquito Trap Market Size and Share Forecast Outlook 2025 to 2035
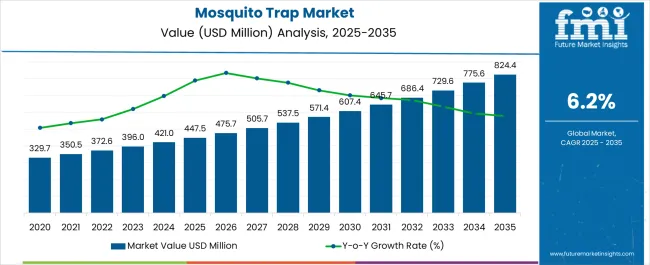
The Mosquito Trap Market is estimated to be valued at USD 447.5 million in 2025 and is projected to reach USD 824.4 million by 2035, registering a compound annual growth rate (CAGR) of 6.2% over the forecast period.
Quick Stats for Mosquito Trap Market
- Mosquito Trap Market Industry Value (2025): USD 447.5 million
- Mosquito Trap Market Forecast Value (2035): USD 824.4 million
- Mosquito Trap Market Forecast CAGR: 6.2%
- Leading Segment in Mosquito Trap Market in 2025: Electric Shock Mosquito Killer (39.5%)
- Key Growth Region in Mosquito Trap Market: North America, Asia-Pacific, Europe
- Top Key Players in Mosquito Trap Market: Woodstream Corp., Inzecto Corp., TNT Mosquito LLC., Novelty Manufacturing Co., Milo Enterprises Inc., Armatron International Inc., Kensizer Inc., Awoco, Shenzhen Tesenni Industrial Co Ltd., Biogents AG, Dynatrap, Thermacell Repellents, Remaig, Greenyellow, Yongtong Electronics
| Metric |
Value |
| Mosquito Trap Market Estimated Value in (2025 E) |
USD 447.5 million |
| Mosquito Trap Market Forecast Value in (2035 F) |
USD 824.4 million |
| Forecast CAGR (2025 to 2035) |
6.2% |
Rationale for Segmental Growth in the Mosquito Trap Market
The mosquito trap market is experiencing strong growth, driven by rising concerns about vector-borne diseases and the growing need for effective, chemical-free pest control solutions. Increasing urbanization, climate change, and population density have intensified the prevalence of mosquito-related health risks, boosting adoption of advanced trapping devices.
The market benefits from technological innovations that enhance efficiency, portability, and safety, appealing to both residential and commercial users. Consumer preference for eco-friendly and non-toxic mosquito control methods has further supported growth.
Online distribution platforms have expanded product accessibility, enabling manufacturers to tap into wider consumer bases. With ongoing public health campaigns and increasing disposable incomes, the demand for mosquito traps is expected to remain strong, particularly in high-risk regions.
Segmental Analysis
Insights into the Electric Shock Mosquito Killer Segment
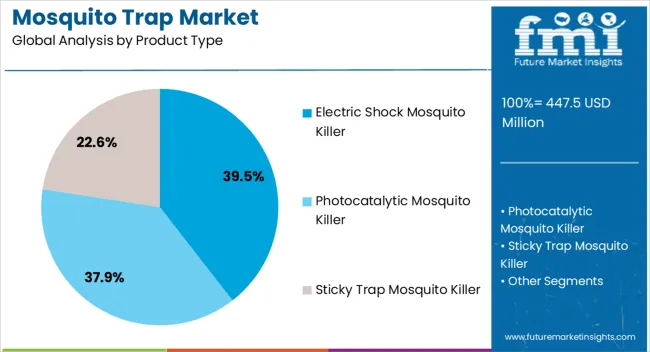
The electric shock mosquito killer segment leads the product type category with approximately 39.50% share, driven by its effectiveness, quick action, and minimal maintenance requirements. These devices provide immediate elimination of mosquitoes without reliance on chemicals, aligning with consumer preference for safer pest control methods.
The segment benefits from affordability, durability, and broad application in both residential and outdoor environments. Continuous design improvements, including quieter operation and energy-efficient components, have further enhanced appeal.
With rising consumer demand for reliable mosquito control solutions, the electric shock mosquito killer segment is expected to maintain its leading position.
Insights into the Outdoor Segment
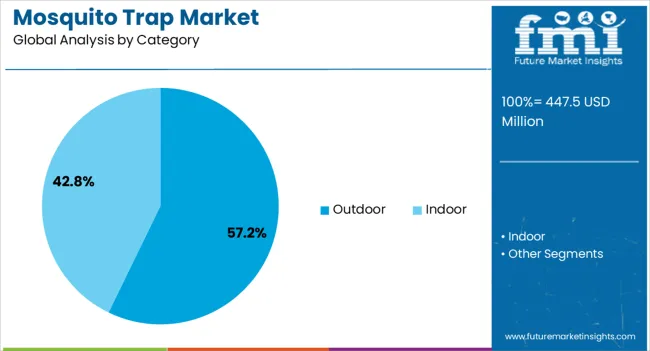
The outdoor segment dominates the category share with approximately 57.20%, supported by the widespread need for mosquito control in gardens, patios, and public outdoor spaces. High mosquito density in open-air environments has made outdoor traps essential for both residential users and hospitality venues.
The segment benefits from durable, weather-resistant designs and increasing consumer investment in outdoor living spaces. Demand is further reinforced by rising awareness of disease prevention and the need for long-lasting protection in high-risk regions.
With expanding applications in recreational and community settings, the outdoor segment is projected to sustain its dominance.
Insights into the Online Retail Segment
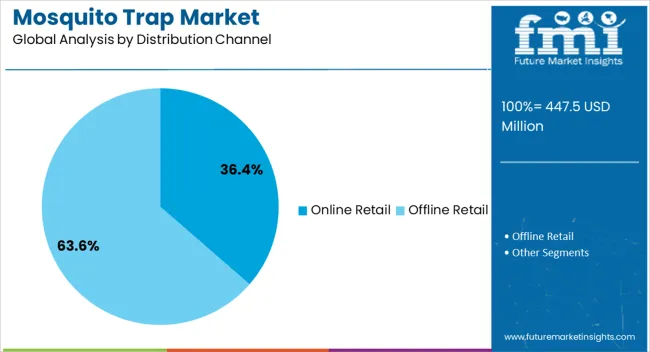
The online retail segment holds approximately 36.40% share of the distribution channel category, reflecting the rapid shift toward e-commerce for pest control products. Online platforms provide consumers with access to a wide range of brands, models, and price points, supported by user reviews and competitive pricing.
The convenience of doorstep delivery and promotional discounts has significantly boosted online sales. Manufacturers are increasingly leveraging digital marketing strategies to reach broader audiences and expand global presence.
With rising internet penetration and growing consumer reliance on online shopping, the online retail segment is expected to maintain its growth momentum in the mosquito trap market.
Historical Analysis of the Mosquito Trap Market
The global mosquito trap market expanded at a CAGR of 4.90% between 2020 and 2025, rising from USD 329.7 million in 2020 to USD 447.5 million in 2025. The market is anticipated to evolve at a CAGR of 6.30% between 2025 and 2035.
| Attributes |
Key Statistics |
| Market Size (2025) |
USD 447.5 million |
| Market Value (2020) |
USD 329.7 million |
| Estimated Growth (2020 to 2025) |
4.90% |
- The global market for mosquito trap products comprises various manufacturers that offer a wide range of trap products, catering to the needs of different consumers.
- Regional vendors, on the other hand, require assistance to compete with multinational firms in terms of quality, innovation, and more affordable goods as their market share grows.
- Around the world, small convenience shops and the residential sector are the two main markets for electric mosquito traps.
- Residential homes typically deploy electric mosquito traps in their gardens and lawns.
- Compared to rackets and other items, these are more in demand and come in smaller sizes.
- The global market for electric mosquito assassins is expanding, as seen by the rising demand for planting, with a particular emphasis on developing nations.
Consumption Analysis of the Mosquito Trap Market
- Mosquito traps have become increasingly popular among businesses and organizations to control the mosquito population. They are an eco-friendly solution that eliminates the need for harmful chemicals. This investment is crucial for providing employees and customers with a safe and comfortable environment, especially in regions where mosquitoes are a common problem.
- The rise in demand for innovative, more advanced solutions that can effectively combat the spread of mosquito-borne diseases is the key focus for market players. As the demand for such intelligent traps continues to escalate, manufacturers are under increasing pressure to develop and introduce innovative products that meet consumers' changing needs and preferences across different regions.
- Using environmentally friendly mosquito traps is growing in popularity as environmental concerns develop. Customers find these sustainable traps a better option because the product is manufactured with less harmful side effects on the environment and human health in mind.
- According to recent market research, the sales of advanced mosquito traps need to be improved due to their high cost. While these traps are highly effective in controlling the spread of mosquito-borne diseases, their expensive price tag makes it difficult for consumers worldwide to afford them. This has resulted in lower demand for the product and a slower adoption rate in areas with prevalent mosquito-borne illnesses.
- The global mosquito control market is fiercely contested between traditional methods and advanced options. Conventional methods such as pesticide sprays and netting have been around, but customer preferences have evolved with genetically modified mosquitoes and mosquito-repelling technology. Enterprises in the sector constantly innovate and improve to meet changing global demands.
Top Product Insights in the Mosquito Trap Industry
Electric Shock Mosquito Killers Zaps the Global Market
| Top Product |
Electric Shock Mosquito Killer |
| Market Share |
47.40% |
- Electric shock mosquito killers are the dominant product in the global mosquito trap market, and they are likely to account for over 47.40% of the market in 2025.
- It is growing in popularity in the mosquito trap industry since they are safe for the environment and have a broader appeal.
- It usually utilizes electricity to attract and kill mosquitos, which is suitable indoors and outdoors.
- Electric shock mosquito killers can effectively kill mosquitoes and require less maintenance, making them more popular among customers.
- It typically uses electricity instead of chemicals to eliminate insects, making them safe for people and pets.
Top Category Insights in the Mosquito Trap Market
Outdoor Mosquito Traps is the Leading Segment
| Top Category |
Outdoor |
| Market Share |
58.50% |
- In 2025, outdoor mosquito traps acquired a market share of 58.50% worldwide.
- Mosquitoes in outside spaces, such as patios, gardens, and camping grounds, are the objective of outdoor mosquito traps.
- These traps use various methods, such as heat emission, carbon dioxide release, and unique chemical lures, to draw in mosquitoes.
- Outdoor mosquito traps are frequently employed to keep mosquitoes at bay, such as in parks, residential buildings, and public spaces.
Analysis of Top Countries Manufacturing, Distributing, and Utilizing Mosquito Traps
Insect Control Devices Accelerates the Market in the United States
| Country |
United States |
| CAGR (2025 to 2035) |
4.4% |
- Mosquito trap sales in the United States are expected to be over-significant in 2035, with a CAGR of 4.4%.
- In the United States, mosquito-borne diseases such as Zika Virus have grown in significance.
- Since more individuals are looking for ways to shield themselves from these harmful insects, there is a greater emphasis on mosquito management.
- Simultaneously, more people are now residing in mosquito-infested regions due to urbanization, which raises the risk of illness even more.
- The demand for mosquito traps has been fueled partly by Americans' increasing disposable income since they are more eager to spend money on goods that will enhance their quality of life.
Chinese Insect Trapping Device Industry Witnesses Noteworthy Changes
| Country |
China |
| CAGR (2025 to 2035) |
6.4% |
- China's mosquito trap market is anticipated to expand at a noteworthy CAGR of 6.4% from 2025 to 2035.
- China's mosquito trap sector has seen several noteworthy changes in recent years.
- One of the main trends is the growing need for eco-friendly mosquito traps that eradicate mosquitoes without endangering the environment.
- Another significant trend is the increasing usage of smart mosquito traps, outfitted with cutting-edge technologies like sensors and internet connectivity, to allow customers to monitor and manage their devices in real time.
- Companies and organizations such as hotels, resorts, parks, and public institutions have also begun to utilize mosquito traps more often to curb the spread of mosquito-borne illnesses and offer a safe and healthy environment for their staff and clients.
- Overall, the growth of the mosquito trap industry is a reflection of the increasing importance of mosquito control in China.
Mosquito Control Products to Skyrocket in India
| Country |
India |
| CAGR (2025 to 2035) |
8.4% |
- India emerged as a significant country in the mosquito trap market, with a CAGR of 8.4% during the anticipated period.
- An increase in Indian households utilize mosquito traps, which efficiently deter and kill insects.
- Indian clients still choose mosquito candles and vaporizers, even if they are becoming more aware of mosquito traps.
- The main factors contributing to India's growing mosquito population include sewage problems, improper wastewater disposal, and unsanitary circumstances.
- Customers are searching for another effective mosquito-repellent option due to their increased awareness of the harmful effects of vaporizers on health and the toxic fumes and residues from candles and coils. This has led to the expansion of the mosquito trap market in the country.
Surge in Mosquito Control System Booming the Market in Australia
| Country |
Australia |
| CAGR (2025 to 2035) |
7.2% |
- Over the anticipated period, Australia is expected to expand at a CAGR of 7.2%.
- The mosquito trap industry in Australia is anticipated to rise steadily over the next several years, mainly due to increased public awareness of diseases caused by mosquitoes and different government-sponsored efforts to curb their spread.
- This market is predicted to increase due to increasing urbanization, shifting climate patterns, and the rising need for economical and efficient mosquito control solutions.
- Furthermore, growing expenditures in research and development and the adoption of creative and effective mosquito trapping and elimination technologies are anticipated to generate profitable growth prospects for the companies involved in the Australian market.
Insect Repellent Traps Utilized in Various Industries of Germany
| Country |
Germany |
| CAGR (2025 to 2035) |
5.8% |
- Germany is predicted to grow at 5.8% and is expected to dominate the sales of mosquito traps in Europe by 2035.
- These bug and mosquito traps manage flies and other insects while eliminating mosquitoes. Hotels, restaurants, business and industrial spaces, and healthcare institutions often employ mosquito traps.
- The use of these traps indoors, in gardens and backyards, is likewise becoming increasingly popular.
- The way these traps are used and produced in Germany has the potential to alter global market trends.
Competitive Landscape of the Mosquito Trap Market
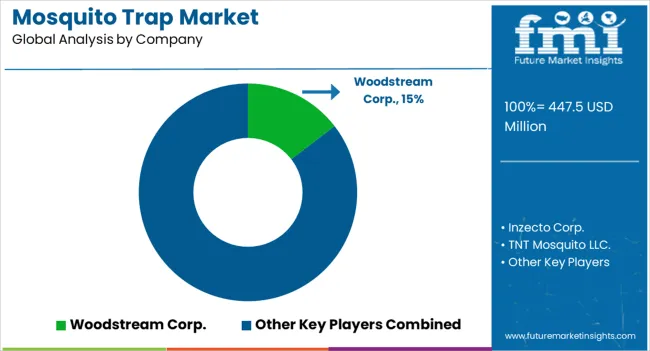
Market players are focused on strategic partnerships, new product launches, and commercializing sales and marketing for market growth. Due to the rising demand for mosquito control methods and increased public awareness of mosquito-borne illnesses, the market for mosquito elimination instruments offers substantial revenue prospects for industry players. Innovative designs for mosquito traps and focusing on growing countries with high mosquito populations and disease loads are two ways manufacturers and suppliers might increase their market share. By creating and providing efficient mosquito trap solutions, market players may establish themselves as leaders in mosquito control and improve their brand reputation.
Recent Developments in the Mosquito Trap Market
- In September 2025, the Mumbai civic body deployed Pune social startup EcoBio Group’s Eco BioTrap earlier this year at Dharavi, India. The product will be utilized in the slum areas of the country for infection control.
- In September 2025, Ukrainian engineering company Mosqitter introduced Mosqitter Grand 3.0, a software-driven mosquito trap mimicking human behavior, offering customizable modes, timing options, and environmental settings for optimal mosquito control.
- In April 2025, Target Specialty Products presented the In2Care Mosquito Trap to its portfolio, available online and in its 46 locations across the United States.
- In May 2025, ClearBreath, a Kickstarter-funded startup, created an all-in-one device that functions as a car air freshener, UV lamp, and mosquito trap.
Key Companies in the Mosquito Trap Industry
- Woodstream Corp.
- Inzecto Corp.
- TNT Mosquito LLC.
- Novelty Manufacturing Co.
- Milo Enterprises Inc.
- Armatron International Inc.
- Kensizer Inc.
- Awoco
- Shenzhen Tesenni Industrial Co Ltd.
- Biogents AG
- Dynatrap
- Thermacell Repellents
- Remaig
- Greenyellow
- Yongtong Electronics
Mosquito Trap Industry Analysis by Top Investment Segments
By Product Type:
- Electric Shock Mosquito Killer
- Photocatalytic Mosquito Killer
- Sticky Trap Mosquito Killer
By Category:
By Distribution Channel:
- Online Retail
- Offline Retail
- Wholesalers/Distributors
- Hypermarket/Supermarket
- Specialty Stores
By End User:
- Residential Areas
- Commercial Establishments
- Public Sector
By Region:
- North America
- Europe
- Asia Pacific
- Latin America
- The Middle East & Africa
Frequently Asked Questions
How big is the mosquito trap market in 2025?
The global mosquito trap market is estimated to be valued at USD 447.5 million in 2025.
What will be the size of mosquito trap market in 2035?
The market size for the mosquito trap market is projected to reach USD 824.4 million by 2035.
How much will be the mosquito trap market growth between 2025 and 2035?
The mosquito trap market is expected to grow at a 6.2% CAGR between 2025 and 2035.
What are the key product types in the mosquito trap market?
The key product types in mosquito trap market are electric shock mosquito killer, photocatalytic mosquito killer and sticky trap mosquito killer.
Which category segment to contribute significant share in the mosquito trap market in 2025?
In terms of category, outdoor segment to command 57.2% share in the mosquito trap market in 2025.


