

- Market Size (2026)
- USD 1240.6 Mn
- Forecast (2036)
- USD 3336.7 Mn
- CAGR (2026 to 2036)
- 10.4%
How big is the motion programming software market size?
USD 1,240.6 million in 2026 and USD 3,336.7 million by 2036 at a 10.4% CAGR.
Sales in motion programming software market are estimated to rise at 10.4% CAGR through 2036, increasing valuation from USD 1,240.6 million in 2026 to USD 3,336.7 million by 2036. Optimizing automated factory systems requires unified programming tools combining axis setup and controller diagnostics. Accelerated hardware deployment directly drives such demand during initial system integration. The International Federation of Robotics in September 2025 reported a total of 542,000 industrial robots installed in 2024 across global factories. High installation volume elevates software necessity for configuring robot setup and managing controller commissioning.
Industries in India and China seek local engineering support with hardware availability. Taiwan and South Korea system integrators screen utility tools optimized for electronics automation and multi-axis equipment response. Meeting unique regional criteria grows more significant as future workforce growth depends on ongoing factory modernization. USA Bureau of Labor Statistics reported in May 2026 stating continued adoption of automated manufacturing machinery is projected to create 41,200 new industrial machinery mechanic jobs by 2034. Expanding technical workforces rely on sophisticated software platforms to deploy robot cells and direct complex motion projects globally.
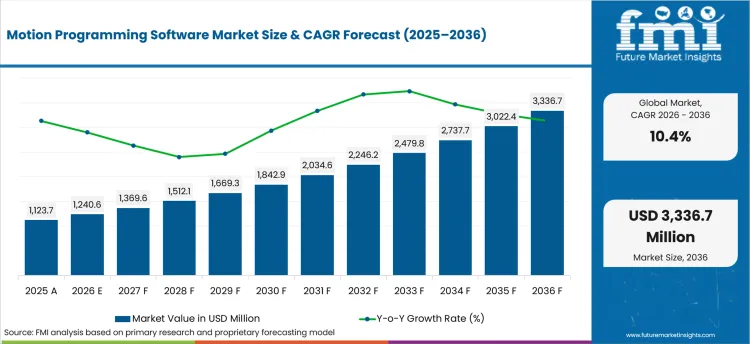
| Metric | Value |
|---|---|
| 2025 Market Size | USD 1,123.7 million |
| 2026 Market Size | USD 1,240.6 million |
| 2036 Market Size | USD 3,336.7 million |
| Forecast CAGR (2026-2036) | 10.4% |
| Deployment Focus | Desktop engineering software |
| Desktop engineering software Share (2026) | 51.0% |
| Control Architecture Focus | Multi-axis synchronized control |
| Multi-axis synchronized control Share (2026) | 42.0% |
| Sales Model Focus | Bundled with controller |
| Bundled with controller Share (2026) | 43.0% |
Summary of the Motion Programming Software Market
| Market Signal | Commercial Impact |
|---|---|
| Demand and Growth Drivers | Demand for motion programming software rises as automation buyers connect commissioning speed with controller diagnostics and service confidence. Account decisions are expected to reflect software compatibility and field response across repeat machine programs.
|
| Product and Segment View | Segment demand is led by desktop engineering environments and synchronized axis control. Specification work is anticipated to concentrate on controller-bundled software designed to protect project timing and commissioning records.
|
| Geography and Growth Outlook | Country demand is stronger across manufacturing markets with robotics installations and electronics automation depth. Supplier gains are likely to reflect local support access and proof-led software review.
|
| Competitive Landscape | Competition is likely to focus on software depth and controller platform continuity. Account gains are expected to favor suppliers with clear release histories and dependable engineering support.
|
| Analyst Perspective | Motion programming software is developing into a control-led software segment linked to commissioning efficiency and machine acceptance. Supplier progress is projected to improve through software release depth and engineering support aligned with OEM and plant requirements.
|
Source: Future Market Insights analysis, 2026.
How is the motion programming software market segmented?
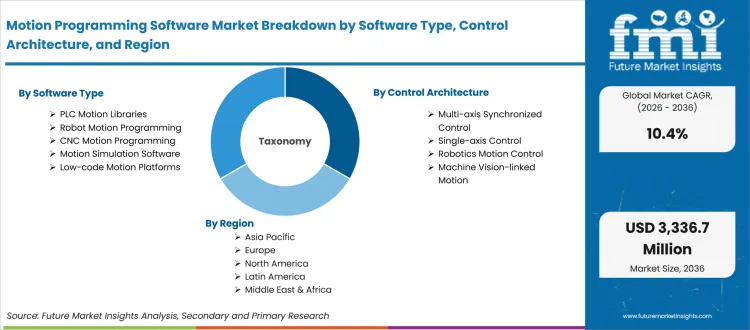
The motion programming software industry is segmented by software type, control architecture, deployment, end use, sales model, and region.
The motion programming software market is segmented by software type, control architecture, deployment, end use, sales model, and region. Software type coverage includes PLC motion libraries, robot motion programming, CNC motion programming, motion simulation software, and low-code motion platforms. Control architecture coverage includes single-axis control, multi-axis synchronized control, robotics motion control, and machine vision-linked motion. Deployment coverage includes desktop engineering software, controller-embedded software, and cloud collaboration/version control. End use coverage includes packaging machinery, robotics, machine tools, electronics assembly, material handling, and printing/textile. Sales model coverage includes bundled with controller, perpetual license, subscription, and engineering services. Regional coverage includes North America, Latin America, Europe, East Asia, South Asia, Oceania, and Middle East and Africa.
What drives desktop engineering software demand within deployment?
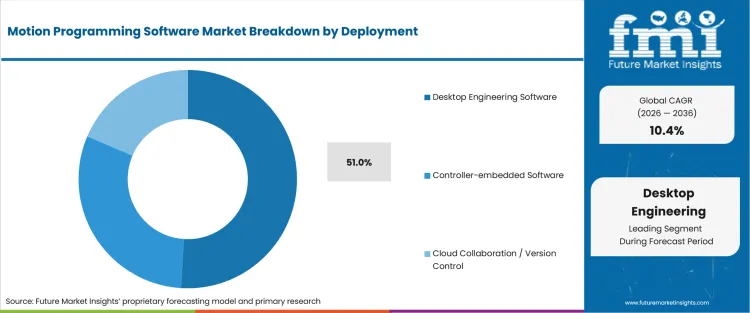
Desktop engineering software is estimated to influence motion programming software based on local project control and engineering familiarity. Programming teams screen desktop environments against controller access and offline project handling before shifting toward newer collaboration tools. On November 2025, Siemens stated for TIA Portal V21 reflecting Git-based continuous-integration workflows for LAD and PLC data types among others. This strengthens review of engineering environments used in automation projects.
- Based on deployment, desktop engineering software is forecast to hold 51.0% share in 2026, helped by offline programming and local project control. Accounts seek desktop tools releasing history, and technical files being documented.
- Controller-embedded software and cloud collaboration/version control serve different engineering programs. Desktop engineering software gains selection preference once buyers need stable project access and predictable commissioning steps.
How is multi-axis synchronized control positioned within control architecture?
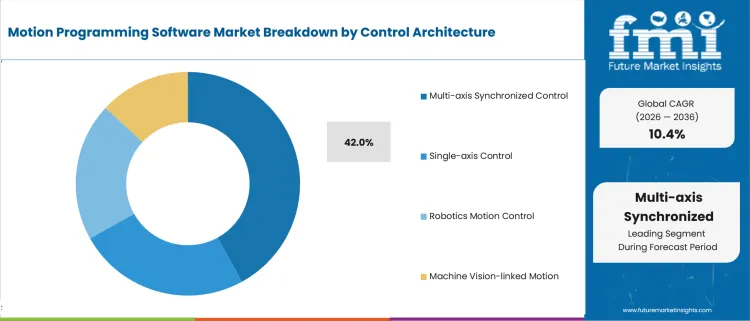
Multi-axis synchronized control is expected to guide account review as packaging machinery and electronics equipment need coordinated axis movement. Engineering teams examine path control and servo response before moving from trials to regular use. Beckhoff reported on September 2025, claiming its automation technology highlights axis synchronization and integrated motion needs for beverage and liquid food production, helping buyers compare synchronized control depth with application support.
- Multi-axis synchronized control is anticipated to capture 42.0% share of control architecture in 2026, led by machines needing coordinated motion and controller timing. Suppliers gain account approval once synchronization proof and application support stay consistent.
- Single-axis control and robotics motion control serve narrower use cases. Multi-axis synchronized control gains attention as machine complexity raises demand for coordinated servo behavior.
How does bundled with controller support sales model demand?
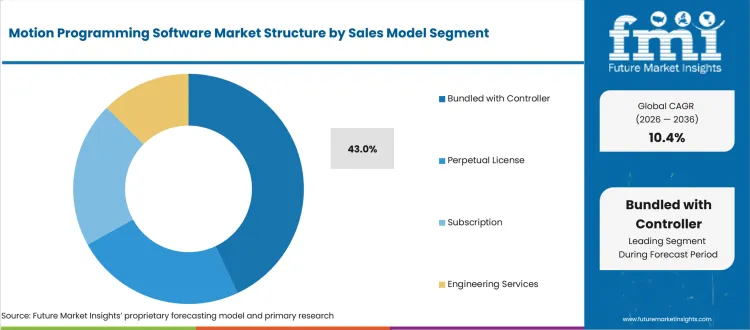
Bundled with controller sales are anticipated to promote platform continuity as automation buyers need software tools aligned with approved PLC drive and motion platforms. Channel teams prefer bundled software once licensing and support ownership affects machine delivery. Rockwell Automation stated in October 2025, announcing FactoryTalk Design Workbench Version 1 helps Micro 800 controllers and provides one workspace for programming configuration and troubleshooting, influencing supplier programs combining controller families with software access.
- In 2026, bundled with controller is projected to account for 43.0% share, aided by integrated licensing and supplier-owned support. Buyers prefer bundled software once controller selection and support records affect approval.
- Perpetual license and subscription models serve different account needs. Bundled with controller gains preference once machine teams need one support path from controller selection to commissioning.
What supports demand for PLC motion libraries within software type?
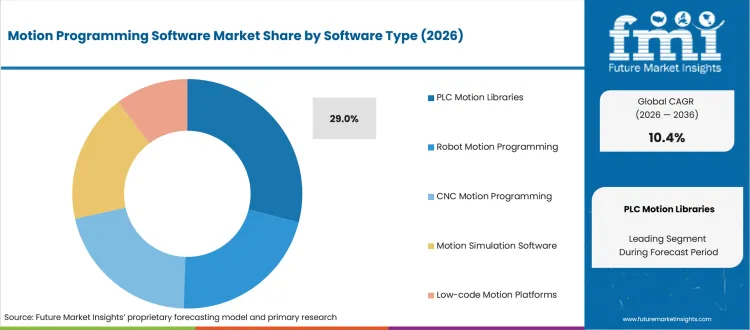
PLC motion libraries are anticipated to support specification control as machine builders need reusable function blocks and commissioning files before repeat orders. Engineering teams prefer library-based programming for shorter axis setup and reduced manual tuning work. Rockwell Automation release notes from May 2024 stated Studio 5000 Logix Designer version 36.00.02 aids discrete and safety applications, reinforcing buyer attention on reusable programming environments across controller families.
- PLC motion libraries are predicted to represent 29.0% share in 2026 due to repeat programming use and controller familiarity. Engineering teams require libraries after machine templates, and service records affect launch timing.
- Robot motion programming and CNC motion programming support different machine profiles. PLC motion libraries achieve preference after account teams need repeatable code structure and easier field troubleshooting.
How does packaging machinery influence end use demand?
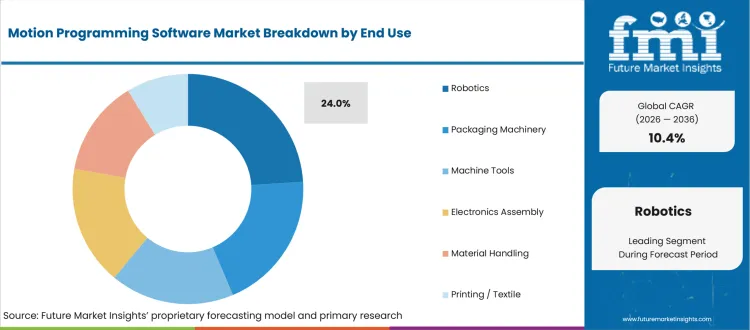
Packaging machinery applications are projected to support demand as inspection stations and servo drives need coordinated programming. Buyers are expected to need software linking recipe changes with repeatable motion control. Association for Advancing Automation reported in February 2026 stating North American companies ordered 36,766 robots in 2025, up 6.6% from 2024, strengthening motion software review across automated packaging and material-handling cells.
- Robotics and machine tools 24.0% share need different balances between programming flexibility and control depth. Packaging machinery gains account attention after software evidence reduces commissioning risk and protects delivery schedules.
- Packaging machinery is expected to garner, backed by servo-axis control and repeat line configuration needs. OEMs need tools combining motion setup and clear machine acceptance records.
What are the drivers, restraints, and opportunities in the motion programming software market?
Near-term purchases are shaped by programming speed and automation service needs outlined below.
- Driver: Machine builders are adopting motion programming tools designed to shorten commissioning and support repeatable servo setup across approved controller families.
- Restraint: Adoption slows if software tools fail compatibility checks across legacy drives controller stacks and plant security review.
- Opportunity: Suppliers offering AI-assisted engineering simulation and diagnostics support improve approval chances across automation accounts.
Factories increasingly rely on automated machines, fueling a massive need for reliable and repeatable programming tools. Industry data from September 2025 confirmed the upward trend, reflecting global robot installations exceeding 500,000 units for the fourth consecutive year in 2024. Companies are now focusing their energy on adopting software able to make running newly installed robots simple and efficient.
Putting new software tools to work is slowed down by strict security checks and compatibility disputes with older factory control systems. A June 2025 report reveals 49% of manufacturers planning to use artificial intelligence for security defenses, up from 40% the previous year. Heightened focus on protecting systems from cyber threats being made gets approval to connect new software to the main factory floor significantly harder.
Modern software helps engineers write code automatically and test machines on a computer screen before going live. Siemens showcased such progress by announcing an AI-powered smart assistant plugging directly into existing software packages like TIA Portal versions 19 and 20. Embedding smart, computer-assisted help into everyday work tools is clearly resulting in faster and easier factory setups.
What country CAGRs are profiled in the motion programming software market?
.webp "Top Country Growth Comparison Motion Programming Software Market Cagr (2026 2036)")
| Country | CAGR |
|---|---|
| India | 12.8% |
| China | 11.9% |
| Taiwan | 10.1% |
| South Korea | 9.9% |
| United States | 9.3% |
| Germany | 8.8% |
| Japan | 8.3% |
Source: Future Market Insights, 2026.
How do country-level CAGRs compare in the motion programming software market?
Country demand in motion programming software is expected to be guided by automation equipment depth and controller service access. India and China are likely to connect demand with manufacturing automation and local machine integration. Taiwan and South Korea are anticipated to connect adoption with electronics production and precision motion needs. United States Germany and Japan are projected to connect demand with documentation depth and supplier validation.
- India motion programming software sales are projected to grow at 12.8% CAGR through 2036, reflected by automation service needs and rising robot installation activity. International Federation of Robotics in September 2025, reported India to have reached 9,120 industrial robot installations in 2024, strengthening demand for motion libraries and engineering support.
- China motion programming software sector is likely to be influenced by industrial robot output and domestic controller integration. National Bureau of Statistics of China on June 2025, stated for China to have produced 287,182 industrial robots from January to May 2025, reinforcing software qualification across local equipment programs. Sales in China are forecast to expand at 11.9% CAGR from 2026 to 2036, driven by robot production scale and domestic controller integration.
- Taiwan buyers are expected to favor suppliers supporting electronics automation and precise multi-axis equipment. Adoption in Taiwan is predicted to rise at 10.1% CAGR by 2036, supported by electronics automation and precision equipment review. Ministry of Economic Affairs Taiwan reported on January 2026, noting industrial production index having increased 21.57% in December 2025 compared with December 2024, influencing demand for engineering tools used around advanced manufacturing equipment.
- South Korea buyers are anticipated to review motion programming tools through robotics density and electronics manufacturing needs. Demand in South Korea is expected to scale at 9.9% CAGR during the assessment period, guided by automation intensity and supplier support expectations. International Federation of Robotics reported in 2025 as South Korea having installed 30,600 industrial robots in 2024, keeping controller programming and servo tuning close to factory automation decisions.
- United States motion programming software purchasing is anticipated to be shaped by robot deployment recovery and automation service review. International Federation of Robotics reported on June 2026, stating industrial robot installations in the United States to have risen by 11% year on year to 38,000 units in 2025, keeping motion programming evidence important for OEM commissioning programs. Demand in the United States is expected to scale at 9.3% CAGR during the forecast period, enabled by robot deployment recovery and commissioning software demand.
- Germany is estimated to expand at 8.8% CAGR between 2026 and 2036, reinforced by disciplined technical review and controller documentation needs. International Federation of Robotics reported on September 2025, highlighting Germany to have recorded 26,982 industrial robot installations in 2024, influencing software review across machine building and plant modernization programs.
- Japan keeps motion programming software demand close to machine precision and long approval cycles. International Federation of Robotics reported on September 2025, claiming Japan to have installed 44,500 industrial robots in 2024, maintaining software selection aligned to established factory automation programs. Sector in Japan is projected to post 8.3% CAGR during the forecast period, shaped by qualification depth and controller platform continuity.
Who are the notable companies in the motion programming software market?
Siemens, Rockwell Automation, Beckhoff Automation, Mitsubishi Electric, Omron, Schneider Electric, ABB, Yaskawa, Bosch Rexroth, and B&R Industrial Automation are expected to shape this market.
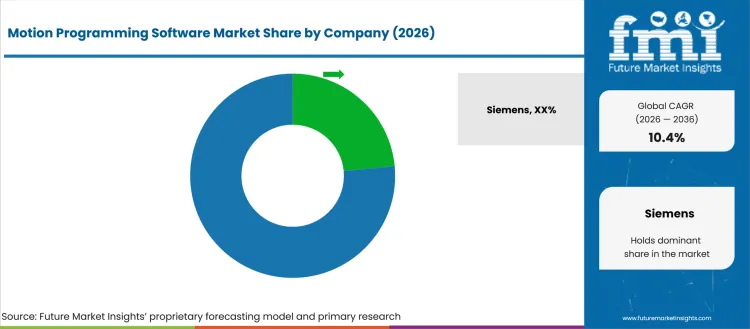
Competition in motion programming software is anticipated to center on controller software depth and regional engineering support. Account teams are likely to compare suppliers based on release reliability and ability to support repeat projects after initial approval. Siemens Rockwell Automation and Beckhoff Automation are expected to receive review attention due to automation software and motion platform depth. Mitsubishi Electric Omron and Schneider Electric are projected to compete driven by machine control platforms and application support.
- Siemens and Beckhoff Automation are expected to gain account attention based on engineering software depth and controller platform support. Automation software experience is likely to promote projects needing motion programming and release discipline.
- Mitsubishi Electric and Schneider Electric are anticipated to compete led by machine automation platforms. Their role is projected to improve as OEMs review controller integration and application support before approval.
- ABB, Yaskawa and B&R Industrial Automation are forecast to support demand depending on robotics and drive expertise. Their motion control experience is expected to help accounts compare software tools and servo compatibility.
- Service-led channel partners are estimated to gain review strength depending on local engineering support and troubleshooting response. Supplier access is likely to improve as plant teams need validated commissioning and software update control.
Competitive Benchmarking: Motion Programming Software Market
| Company | Portfolio Fit | Segment Relevance | Documentation Depth | Service Reach |
|---|---|---|---|---|
| Siemens | High | High | High | Global |
| Rockwell Automation | High | High | High | Global |
| Beckhoff Automation | High | High | High | Global |
| Mitsubishi Electric | High | High | High | Global |
| Omron | Medium | High | High | Global |
| Schneider Electric | Medium | High | High | Global |
| ABB | Medium | Medium | High | Regional/Global |
| Yaskawa | Medium | Medium | Medium | Regional/Global |
| Bosch Rexroth | Medium | Medium | Medium | Regional/Global |
| B&R Industrial Automation | Medium | Medium | Medium | Regional/Global |
Source: Future Market Insights competitive analysis, 2026.
Key Developments in the Motion Programming Software Market
- In March 2025, Omron Automation and NVIDIA Omniverse collaborated around Sysmac Studio and simulation-led manufacturing tools. Omron stated on March 2025 that its inspection machine and automation technologies connect to NVIDIA Omniverse, improving machine-design review and motion validation pathways for automation developers.
- In October 2025, Rockwell Automation launched FactoryTalk Design Workbench for Micro 800 controller programming. Rockwell Automation stated in October 2025, Version 1 supports Micro 800 controllers and provides one workspace for programming configuration and troubleshooting, supporting smaller automation projects needing faster setup and controller documentation.
- In November 2025, Siemens released TIA Portal V21 for automation engineering. Siemens stated on November 2025 claiming the release adds Git-based continuous-integration workflows and higher-availability SCADA architectures, improving software traceability and engineering coordination for automation teams.
Key Players in the Motion Programming Software Market
Automation software and drive suppliers
- Siemens
- Rockwell Automation
- Beckhoff Automation
- Mitsubishi Electric
Control platform and integration specialists
- Omron
- Schneider Electric
- ABB
Motion control and robotics technology groups
- Yaskawa
- Bosch Rexroth
- B&R Industrial Automation
Motion Programming Software Market - Report Scope
| Coverage field | Report scope |
|---|---|
| Market breakdown | The motion programming software market breakdown by software type, control architecture, deployment, end use, sales model, and region |
| Market Definition | Motion programming software refers to tools used to configure tune programs to diagnose or optimize motion-control systems in industrial automation and precision equipment. |
| Regions Covered | North America, Latin America, Europe, East Asia, South Asia, Oceania, and Middle East and Africa |
| Countries Covered | United States, China, India, Germany, Japan, South Korea, Taiwan, Canada, Brazil, Mexico, France, Italy, Spain, Thailand, Indonesia, Australia, New Zealand, GCC countries, South Africa, and Turkiye |
| Key Companies Profiled | Siemens, Rockwell Automation, Beckhoff Automation, Mitsubishi Electric, Omron, Schneider Electric, ABB, Yaskawa, Bosch Rexroth, and B&R Industrial Automation |
| Forecast Period | 2026 to 2036 |
| Approach | Hybrid bottom-up and top-down methodology using segment share, country CAGR, automation equipment installations, motion controller adoption, software license models, drive installed base, OEM integration cycles, and supplier portfolio depth |
Source: Future Market Insights analysis, 2026.
Motion Programming Software Market - Research Methodology
| Method | Approach |
|---|---|
| Primary Research | Primary interviews covered machine builders, automation engineers, OEMs, system integrators, plant maintenance teams, distributors, and channel accounts. Discussions focused on commissioning speed, servo tuning, controller interoperability, diagnostics, service ownership, acceptance files, and repeat-order readiness. |
| Desk Research | Desk research reviewed official robotics statistics, automation software releases, company portfolio pages, standards-body references, engineering software updates, and industry association datasets. |
| Market Sizing and Forecasting | Market sizing used a hybrid model across segment mix, country CAGR, robotics installations, controller platform adoption, software deployment models, installed drive base, and supplier coverage across motion programming software. |
| Data Validation | Data validation compares interview findings from manufacturers, distributors, telecom contractors, and utility crews against fiber deployment programs and channel availability. Analysts test country growth against route construction activity, conduit maintenance needs, and access to replacement parts. The forecast is then triangulated across new-route work, replacement purchases, and field repair cycles that influence repeat duct rodder demand. |
Source: Future Market Insights analysis, 2026.
Motion Programming Software Market by Segments
Motion Programming Software Market segmented by Software Type:
- PLC motion libraries
- Robot motion programming
- CNC motion programming
- Motion simulation software
- Low-code motion platforms
Motion Programming Software Market segmented by Control Architecture:
- Single-axis control
- Multi-axis synchronized control
- Robotics motion control
- Machine vision-linked motion
Motion Programming Software Market segmented by Deployment:
- Desktop engineering software
- Controller-embedded software
- Cloud collaboration/version control
Motion Programming Software Market segmented by End Use:
- Packaging machinery
- Robotics
- Machine tools
- Electronics assembly
- Material handling
- Printing/textile
Motion Programming Software Market segmented by Sales Model:
- Bundled with controller
- Perpetual license
- Subscription
- Engineering services
Motion Programming Software Market by Region:
- North America
- United States
- Canada
- Latin America
- Brazil
- Mexico
- Argentina
- Europe
- Germany
- United Kingdom
- France
- Italy
- Spain
- East Asia
- China
- Japan
- South Korea
- Taiwan
- South Asia
- India
- Thailand
- Indonesia
- Oceania
- Australia
- New Zealand
- Middle East and Africa
- GCC countries
- South Africa
- Turkiye
Research Sources and Bibliography
- Association for Advancing Automation. (2026, February 6). Robot orders grow 6.6% in 2025 as general industries drive broader automation adoption.
- Beckhoff Automation. (2025, September 15). drinktec 2025: Beckhoff automation technology for beverage and liquid food production.
- International Federation of Robotics. (2025, September 25). India rises to sixth in global factory robot installations.
- International Federation of Robotics. (2025, September 25). World Robotics 2025 report: Industrial robots.
- International Federation of Robotics. (2026, June 18). US robot industry returns to double digit growth.
- Ministry of Economic Affairs Taiwan. (2026, January 23). Industrial production index in December 2025.
- National Bureau of Statistics of China. (2025, June 20). Industrial production operation in May 2025.
- Omron Automation. (2025, March 18). Omron automation software Sysmac Studio and NVIDIA Omniverse collaborate to innovate simulation-twin manufacturing solutions.
- PLCopen. (2025). Motion control function blocks.
- Rockwell Automation. (2025, June 3). Ninety-five percent of manufacturers are investing in AI to navigate uncertainty and accelerate smart manufacturing.
- Rockwell Automation. (2025, October 28). FactoryTalk Design Workbench software announcement.
- Siemens. (2025, November 11). TIA Portal V21 combines engineering efficiency with higher plant availability.
- Siemens. (2025, November 25). Siemens showcases the future of autonomous production at SPS 2025.
- Rockwell Automation. (2024, May). Studio 5000 Logix Designer version 36.00.02 release notes.
- Association for Advancing Automation. (2026, February 6). Robot orders grow 6.6% in 2025 as general industries drive broader automation adoption.
- Bureau of Labor Statistics. (2025, August 28). Industrial machinery mechanics, machinery maintenance workers, and millwrights. In Occupational outlook handbook. USA Department of Labor.
This bibliography is provided for reader reference and is not exhaustive. The full report contains the complete reference list and detailed citations.
This Report Answers
- What segments shape demand across software type, control architecture, deployment, end use, and sales model?
- How do automation teams evaluate motion programming software before replacing established engineering platforms?
- How do country CAGRs differ across profiled accounts?
- What companies compete through automation software depth and controller platform support?
- How does FMI validate forecasts using a hybrid bottom-up and top-down approach?
- What factors should account teams address before larger account expansion?
- How do software release records and controller documentation affect supplier selection?
- What limits return on investment for account teams adding motion programming software to automation programs?
- How do technical files and field support records influence account approval?
- What supplier capabilities improve long-term account confidence?
Frequently Asked Questions
What is supporting demand in the motion programming software market?
Demand is likely to be supported by machine builders and automation engineers needing programming tools for repeatable motion setup across approved controller families. Accounts are expected to prefer software combining controller libraries and release documentation.
Who are the key players in the motion programming software market?
Key companies are anticipated to include Siemens, Rockwell Automation, Beckhoff Automation, Mitsubishi Electric, Omron, Schneider Electric, ABB, Yaskawa, Bosch Rexroth, and B&R Industrial Automation. Competition is likely to be based on controller software depth and regional engineering support.
What is a restraint in the motion programming software market?
A main restraint comes from software compatibility burden across controller stacks and plant security review processes. Accounts slow adoption if software lacks release clarity or service response needed for approval.
Why should executives track the motion programming software market?
Executives are expected to track this market as software selection affects commissioning time and machine acceptance. Factors such as release reliability and troubleshooting depth shape buyer reviews.
What business problem does the motion programming software market address?
Motion programming software addresses a practical engineering gap involving diagnostics and repeatable controller programming across industrial automation projects. Machine builders and plant teams need tools supporting predictable commissioning and documented acceptance.
What should account teams evaluate before selecting suppliers?
Account teams are likely to evaluate controller compatibility and release support before supplier approval. Field troubleshooting and documentation depth are expected to guide final supplier review.
What limits return on investment for purchasing teams?
Return on investment weakens if commissioning speed or account acceptance is not proven before launch. Software mismatch and delayed troubleshooting reduce expected project gains.
How do suppliers build long-term account confidence?
Suppliers build account confidence by providing consistent software releases and evidence specific to motion programming software. Controller files and responsive engineering support are expected to influence repeat-order trust.
Preview the report firsthand - request a free sample
Get SampleGet the brochure for pricing and purchase details.
Get PDFTable of Content
- Key Takeaways
- Market Size and CAGR
- Top Growth Driver
- Fastest Growing Segment
- Leading Region
- Key Companies
- Emerging Opportunities
- Executive Summary
- Global Market Outlook
- Demand-side Trends
- Supply-side Trends
- Technology Roadmap Analysis
- Analysis and Recommendations
- Analyst Perspective (What is happening? Why now? What should investors know?)
- Key Questions Answered
- How large is the market?
- What is the CAGR?
- What are key trends?
- Which region dominates?
- Who are the leaders?
- Market Overview
- Market Coverage / Taxonomy
- Market Definition / Scope / Limitations
- Research Methodology
- Chapter Orientation
- Analytical Lens and Working Hypotheses
- Market Structure, Signals, and Trend Drivers
- Benchmarking and Cross-market Comparability
- Market Sizing, Forecasting, and Opportunity Mapping
- Research Design and Evidence Framework
- Desk Research Programme (Secondary Evidence)
- Expert Input and Fieldwork (Primary Evidence)
- Tooling, Models, and Reference Databases
- Data Engineering and Model Build
- Quality Assurance and Audit Trail
- Market Background
- Market Dynamics (Drivers, Restraints, Opportunity, Trends)
- Scenario Forecast (Optimistic, Likely, Conservative)
- Impact Analysis
- AI Impact
- Sustainability Impact
- Regulatory Impact
- Technology Impact
- Consumer / Buyer Analysis
- Purchase Drivers
- Adoption Barriers
- Buyer Journey
- Opportunity Map Analysis
- Product Life Cycle Analysis
- Supply Chain Analysis
- Investment Feasibility Matrix
- Value Chain Analysis
- PESTLE and Porter's Analysis
- Regulatory Landscape
- Regional Parent Market Outlook
- Production and Consumption Statistics
- Import and Export Statistics
- Global Market Analysis and Forecast, 2021 to 2036
- Historical Market Size Value (USD Million) & Volume (Unit) Analysis, 2021 to 2025
- Current and Future Market Size Value (USD Million) & Volume (Unit) Projections, 2026 to 2036
- Y-o-Y Growth Trend Analysis
- Absolute $ Opportunity Analysis
- Global Market Pricing Analysis, 2021 to 2036
- Global Market Analysis and Forecast, By Software Type, 2021 to 2036
- Introduction / Key Findings
- Historical Market Size Value (USD Million) & Volume (Unit) Analysis By Software Type, 2021 to 2025
- Current and Future Market Size Value (USD Million) & Volume (Unit) Analysis and Forecast By Software Type, 2026 to 2036
- PLC Motion Libraries
- Robot Motion Programming
- CNC Motion Programming
- Motion Simulation Software
- Low-code Motion Platforms
- PLC Motion Libraries
- Y-o-Y Growth Trend Analysis By Software Type, 2021 to 2025
- Absolute $ Opportunity Analysis By Software Type, 2026 to 2036
- Global Market Analysis and Forecast, By Control Architecture, 2021 to 2036
- Introduction / Key Findings
- Historical Market Size Value (USD Million) & Volume (Unit) Analysis By Control Architecture, 2021 to 2025
- Current and Future Market Size Value (USD Million) & Volume (Unit) Analysis and Forecast By Control Architecture, 2026 to 2036
- Multi-axis Synchronized Control
- Single-axis Control
- Robotics Motion Control
- Machine Vision-linked Motion
- Multi-axis Synchronized Control
- Y-o-Y Growth Trend Analysis By Control Architecture, 2021 to 2025
- Absolute $ Opportunity Analysis By Control Architecture, 2026 to 2036
- Global Market Analysis and Forecast, By Deployment, 2021 to 2036
- Introduction / Key Findings
- Historical Market Size Value (USD Million) & Volume (Unit) Analysis By Deployment, 2021 to 2025
- Current and Future Market Size Value (USD Million) & Volume (Unit) Analysis and Forecast By Deployment, 2026 to 2036
- Desktop Engineering Software
- Controller-embedded Software
- Cloud Collaboration / Version Control
- Desktop Engineering Software
- Y-o-Y Growth Trend Analysis By Deployment, 2021 to 2025
- Absolute $ Opportunity Analysis By Deployment, 2026 to 2036
- Global Market Analysis and Forecast, By End Use, 2021 to 2036
- Introduction / Key Findings
- Historical Market Size Value (USD Million) & Volume (Unit) Analysis By End Use, 2021 to 2025
- Current and Future Market Size Value (USD Million) & Volume (Unit) Analysis and Forecast By End Use, 2026 to 2036
- Robotics
- Packaging Machinery
- Machine Tools
- Electronics Assembly
- Material Handling
- Printing / Textile
- Robotics
- Y-o-Y Growth Trend Analysis By End Use, 2021 to 2025
- Absolute $ Opportunity Analysis By End Use, 2026 to 2036
- Global Market Analysis and Forecast, By Sales Model, 2021 to 2036
- Introduction / Key Findings
- Historical Market Size Value (USD Million) & Volume (Unit) Analysis By Sales Model, 2021 to 2025
- Current and Future Market Size Value (USD Million) & Volume (Unit) Analysis and Forecast By Sales Model, 2026 to 2036
- Bundled with Controller
- Perpetual License
- Subscription
- Engineering Services
- Bundled with Controller
- Y-o-Y Growth Trend Analysis By Sales Model, 2021 to 2025
- Absolute $ Opportunity Analysis By Sales Model, 2026 to 2036
- Global Market Analysis and Forecast, By Region, 2021 to 2036
- Introduction
- Historical Market Size Value (USD Million) & Volume (Unit) Analysis By Region, 2021 to 2025
- Current Market Size Value (USD Million) & Volume (Unit) Analysis and Forecast By Region, 2026 to 2036
- North America
- Latin America
- Western Europe
- Eastern Europe
- East Asia
- South Asia and Pacific
- Middle East & Africa
- Market Attractiveness Analysis By Region
- North America Market Analysis and Forecast, By Country, 2021 to 2036
- Historical Market Size Value (USD Million) & Volume (Unit) Trend Analysis By Market Taxonomy, 2021 to 2025
- Market Size Value (USD Million) & Volume (Unit) Forecast By Market Taxonomy, 2026 to 2036
- By Country
- USA
- Canada
- By Software Type
- By Control Architecture
- By Deployment
- By End Use
- By Sales Model
- By Country
- Market Attractiveness Analysis
- By Country
- By Software Type
- By Control Architecture
- By Deployment
- By End Use
- By Sales Model
- Key Takeaways
- Latin America Market Analysis and Forecast, By Country
- Historical Market Size Value (USD Million) & Volume (Unit) Trend Analysis By Market Taxonomy, 2021 to 2025
- Market Size Value (USD Million) & Volume (Unit) Forecast By Market Taxonomy, 2026 to 2036
- By Country
- Brazil
- Mexico
- Chile
- Rest of Latin America
- By Software Type
- By Control Architecture
- By Deployment
- By End Use
- By Sales Model
- By Country
- Market Attractiveness Analysis
- By Country
- By Software Type
- By Control Architecture
- By Deployment
- By End Use
- By Sales Model
- Key Takeaways
- Western Europe Market Analysis and Forecast, By Country
- Historical Market Size Value (USD Million) & Volume (Unit) Trend Analysis By Market Taxonomy, 2021 to 2025
- Market Size Value (USD Million) & Volume (Unit) Forecast By Market Taxonomy, 2026 to 2036
- By Country
- Germany
- UK
- Italy
- Spain
- France
- Nordic
- BENELUX
- Rest of Western Europe
- By Software Type
- By Control Architecture
- By Deployment
- By End Use
- By Sales Model
- By Country
- Market Attractiveness Analysis
- By Country
- By Software Type
- By Control Architecture
- By Deployment
- By End Use
- By Sales Model
- Key Takeaways
- Eastern Europe Market Analysis and Forecast, By Country
- Historical Market Size Value (USD Million) & Volume (Unit) Trend Analysis By Market Taxonomy, 2021 to 2025
- Market Size Value (USD Million) & Volume (Unit) Forecast By Market Taxonomy, 2026 to 2036
- By Country
- Russia
- Poland
- Hungary
- Balkan & Baltic
- Rest of Eastern Europe
- By Software Type
- By Control Architecture
- By Deployment
- By End Use
- By Sales Model
- By Country
- Market Attractiveness Analysis
- By Country
- By Software Type
- By Control Architecture
- By Deployment
- By End Use
- By Sales Model
- Key Takeaways
- East Asia Market Analysis and Forecast, By Country
- Historical Market Size Value (USD Million) & Volume (Unit) Trend Analysis By Market Taxonomy, 2021 to 2025
- Market Size Value (USD Million) & Volume (Unit) Forecast By Market Taxonomy, 2026 to 2036
- By Country
- China
- Japan
- South Korea
- By Software Type
- By Control Architecture
- By Deployment
- By End Use
- By Sales Model
- By Country
- Market Attractiveness Analysis
- By Country
- By Software Type
- By Control Architecture
- By Deployment
- By End Use
- By Sales Model
- Key Takeaways
- South Asia and Pacific Market Analysis and Forecast, By Country
- Historical Market Size Value (USD Million) & Volume (Unit) Trend Analysis By Market Taxonomy, 2021 to 2025
- Market Size Value (USD Million) & Volume (Unit) Forecast By Market Taxonomy, 2026 to 2036
- By Country
- India
- ASEAN
- Australia & New Zealand
- Rest of South Asia and Pacific
- By Software Type
- By Control Architecture
- By Deployment
- By End Use
- By Sales Model
- By Country
- Market Attractiveness Analysis
- By Country
- By Software Type
- By Control Architecture
- By Deployment
- By End Use
- By Sales Model
- Key Takeaways
- Middle East & Africa Market Analysis and Forecast, By Country
- Historical Market Size Value (USD Million) & Volume (Unit) Trend Analysis By Market Taxonomy, 2021 to 2025
- Market Size Value (USD Million) & Volume (Unit) Forecast By Market Taxonomy, 2026 to 2036
- By Country
- Kingdom of Saudi Arabia
- Other GCC Countries
- Türkiye
- South Africa
- Other African Union
- Rest of Middle East & Africa
- By Software Type
- By Control Architecture
- By Deployment
- By End Use
- By Sales Model
- By Country
- Market Attractiveness Analysis
- By Country
- By Software Type
- By Control Architecture
- By Deployment
- By End Use
- By Sales Model
- Key Takeaways
- Key Countries Market Analysis
- USA
- Pricing Analysis
- Market Share Analysis, 2025
- By Software Type
- By Control Architecture
- By Deployment
- By End Use
- By Sales Model
- Canada
- Pricing Analysis
- Market Share Analysis, 2025
- By Software Type
- By Control Architecture
- By Deployment
- By End Use
- By Sales Model
- Mexico
- Pricing Analysis
- Market Share Analysis, 2025
- By Software Type
- By Control Architecture
- By Deployment
- By End Use
- By Sales Model
- Brazil
- Pricing Analysis
- Market Share Analysis, 2025
- By Software Type
- By Control Architecture
- By Deployment
- By End Use
- By Sales Model
- Chile
- Pricing Analysis
- Market Share Analysis, 2025
- By Software Type
- By Control Architecture
- By Deployment
- By End Use
- By Sales Model
- Germany
- Pricing Analysis
- Market Share Analysis, 2025
- By Software Type
- By Control Architecture
- By Deployment
- By End Use
- By Sales Model
- UK
- Pricing Analysis
- Market Share Analysis, 2025
- By Software Type
- By Control Architecture
- By Deployment
- By End Use
- By Sales Model
- Italy
- Pricing Analysis
- Market Share Analysis, 2025
- By Software Type
- By Control Architecture
- By Deployment
- By End Use
- By Sales Model
- Spain
- Pricing Analysis
- Market Share Analysis, 2025
- By Software Type
- By Control Architecture
- By Deployment
- By End Use
- By Sales Model
- France
- Pricing Analysis
- Market Share Analysis, 2025
- By Software Type
- By Control Architecture
- By Deployment
- By End Use
- By Sales Model
- India
- Pricing Analysis
- Market Share Analysis, 2025
- By Software Type
- By Control Architecture
- By Deployment
- By End Use
- By Sales Model
- ASEAN
- Pricing Analysis
- Market Share Analysis, 2025
- By Software Type
- By Control Architecture
- By Deployment
- By End Use
- By Sales Model
- Australia & New Zealand
- Pricing Analysis
- Market Share Analysis, 2025
- By Software Type
- By Control Architecture
- By Deployment
- By End Use
- By Sales Model
- China
- Pricing Analysis
- Market Share Analysis, 2025
- By Software Type
- By Control Architecture
- By Deployment
- By End Use
- By Sales Model
- Japan
- Pricing Analysis
- Market Share Analysis, 2025
- By Software Type
- By Control Architecture
- By Deployment
- By End Use
- By Sales Model
- South Korea
- Pricing Analysis
- Market Share Analysis, 2025
- By Software Type
- By Control Architecture
- By Deployment
- By End Use
- By Sales Model
- Russia
- Pricing Analysis
- Market Share Analysis, 2025
- By Software Type
- By Control Architecture
- By Deployment
- By End Use
- By Sales Model
- Poland
- Pricing Analysis
- Market Share Analysis, 2025
- By Software Type
- By Control Architecture
- By Deployment
- By End Use
- By Sales Model
- Hungary
- Pricing Analysis
- Market Share Analysis, 2025
- By Software Type
- By Control Architecture
- By Deployment
- By End Use
- By Sales Model
- Kingdom of Saudi Arabia
- Pricing Analysis
- Market Share Analysis, 2025
- By Software Type
- By Control Architecture
- By Deployment
- By End Use
- By Sales Model
- Türkiye
- Pricing Analysis
- Market Share Analysis, 2025
- By Software Type
- By Control Architecture
- By Deployment
- By End Use
- By Sales Model
- South Africa
- Pricing Analysis
- Market Share Analysis, 2025
- By Software Type
- By Control Architecture
- By Deployment
- By End Use
- By Sales Model
- USA
- Market Structure Analysis
- Competition Dashboard
- Competition Benchmarking
- Market Share Analysis of Top Players
- By Regional
- By Software Type
- By Control Architecture
- By Deployment
- By End Use
- By Sales Model
- Emerging Startups
- Innovation Benchmarking
- Competition Analysis
- Competition Deep Dive
- Siemens
- Overview
- Product Portfolio
- Profitability by Market Segments (Product/Region/Sales Channel)
- Sales Footprint
- Strategy Overview
- Marketing Strategy
- Product Strategy
- Channel Strategy
- Rockwell Automation
- Beckhoff Automation
- Mitsubishi Electric
- Omron
- Schneider Electric
- ABB
- Yaskawa
- Bosch Rexroth
- B&R Industrial Automation
- Siemens
- Case Studies
- Success Stories
- Recent Developments
- Competition Deep Dive
- Assumptions & Acronyms Used


