

- Market Size (2026)
- USD 860.7 Mn
- Forecast (2036)
- USD 2192.2 Mn
- CAGR (2026 to 2036)
- 9.8%
How big is the servo tuning software market size?
USD 860.7 million in 2026 and USD 2,192.2 million by 2036 at a 9.8% CAGR.
Sales of servo tuning software are estimated to rise at 9.8% CAGR through 2036, increasing valuation from USD 860.7 million in 2026 to USD 2,192.2 million by 2036. Verifying equipment performance requires specialized tuning tools for commissioning checks and motion response records across servo-driven machinery. Rising deployment numbers worldwide directly expand the necessity for advanced setup software. International Federation of Robotics reported in September 2025 stating industrial robot installations reached 542,000 units in 2024. Growing global expansion strengthens utilization of tuning software across robot cells and motion equipment.
Key players in India and China are centering engineering evaluations on local automation buildout alongside drive-software service access. Sourcing operations in Taiwan and South Korea test provider responsiveness across electronics production and machine tools. Adapting localized needs grows increasingly important since regional acquisition trends remain strong. Association for Advancing Automation reported on February 2026 stating North American robot orders reached 36,766 units in 2025. Such high order volumes ensure commissioning software remains a permanent priority in plant automation budgets globally.
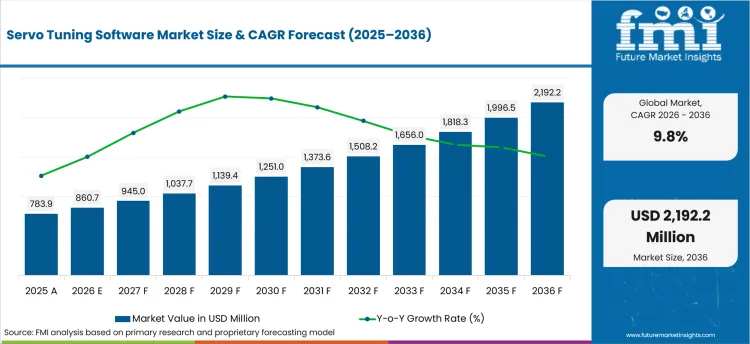
| Metric | Value |
|---|---|
| 2025 Market Size | USD 783.9 million |
| 2026 Market Size | USD 860.7 million |
| 2036 Market Size | USD 2,192.2 million |
| Forecast CAGR (2026-2036) | 9.8% |
| Revenue Model Focus | Bundled with Drive |
| Bundled with Drive Share (2026) | 61.0% |
| Drive Type Focus | AC Servo Drives |
| AC Servo Drives Share (2026) | 48.0% |
| Deployment Focus | Embedded Drive Software |
| Embedded Drive Software Share (2026) | 43.0% |
Summary of the Servo Tuning Software Market
| Market Signal | Commercial Impact |
|---|---|
| Demand and Growth Drivers | Demand for servo tuning software is expected to rise as manufacturers connect faster commissioning with stable motion control and documented acceptance. Account decisions are projected to reflect drive compatibility and service response across repeated machine programs.
|
| Product and Segment View | Segment demand is led by drive-side software compatibility and commissioning support. Specification work is expected to concentrate on servo platforms offering clear tuning records and application support.
|
| Geography and Growth Outlook | Country demand is anticipated to differ by automation buildout and qualification discipline. Supplier gains are likely to reflect local application support and proof-led buyer review.
|
| Competitive Landscape | Competition is likely to focus on drive portfolios and field service depth. Account progress is anticipated to favor suppliers with documented commissioning support and dependable channel coverage.
|
| Analyst Perspective | Servo tuning software is developing into an engineering-assurance segment aligned to machine acceptance and uptime review. Supplier progress is projected to improve through software evidence and field support aligned with automation and precision equipment requirements.
|
Source: Future Market Insights analysis, 2026.
How is the servo tuning software market segmented?
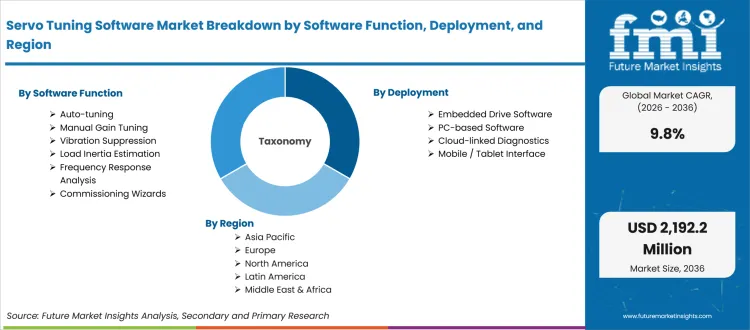
The servo tuning software market is segmented by revenue model, drive type, deployment, end use, software function, and region.
The servo tuning software industry coverage includes bundled with drive, licensed software, and subscription or analytics. Drive type coverage includes AC servo drives, multi-axis servo drives, and integrated servo motors. Deployment coverage includes embedded drive software, PC-based software, cloud-linked diagnostics, and mobile or tablet interface. End use coverage includes machine builders, robotics integrators, packaging OEMs, CNC and motion-control users, and maintenance teams. Software function coverage includes auto-tuning, manual gain tuning, vibration suppression, load inertia estimation, frequency response analysis, and commissioning wizards.
How does bundled with drive support revenue model selection?
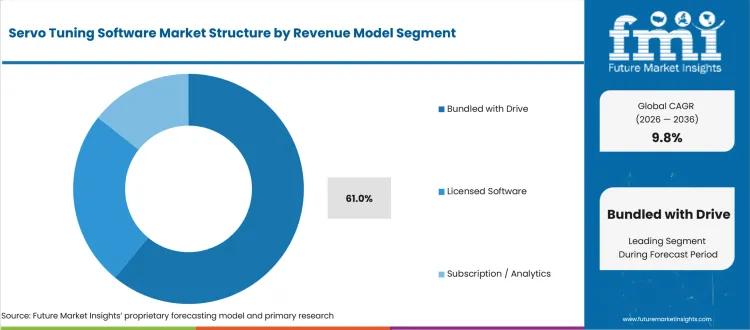
Bundled with drive models are projected to support revenue model as buyers prefer software access linked to approved servo platforms. Drive suppliers use bundled software to simplify installation support and training. Technical accountability improves during commissioning. Yaskawa Electric announced on January 2025, 3 Advanced Safety Module types and 3 functional-safety servo motor models for the Sigma-X series. Combined products support SIL3 or PLe systems and strengthen demand for coordinated drive packages under one engineering environment.
- By revenue model selection, bundled with drive is likely to secure 61.0% share in 2026 owing to tool access aligned with approved drive platforms. Buyer teams require integrated software access on drive approval, and tuning workflows share one supplier relationship.
- Licensed software and subscription analytics support advanced diagnostics and multi-site review. Bundled models gain preference once machine builders need predictable tool availability across repeated installations.
How do AC servo drives shape drive type purchasing?
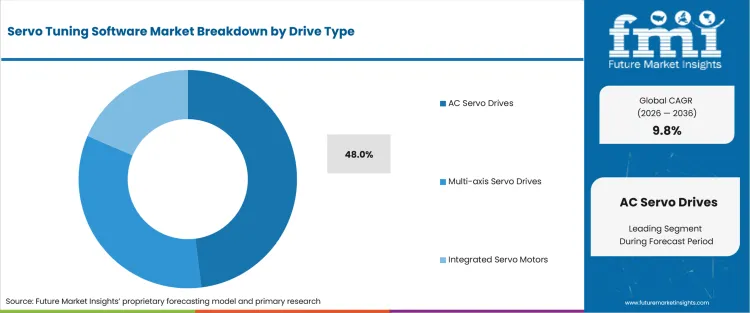
AC servo drives are expected to guide drive type purchasing as machine builders need tuning software aligned with common drive architectures and repeated installation work. Engineering teams screen tuning tools against axis response and vibration behavior. Compatibility evidence receives review before movement from test cells to regular machine programs. Yaskawa Electric reported on May 2025, stating for Sigma-X 400 V input models to have entered its AC servo motor and SERVOPACK portfolio. Expanded voltage coverage supports software qualification across large machines built for European and Asian manufacturing sites.
- In 2026, AC servo drives are projected to account for 48.0% share since it has recurring use across industrial automation and precision motion systems. Suppliers achieve account approval after software tools support clear tuning steps and repeated drive setup.
- Multi-axis servo drives and integrated servo motors serve different equipment profiles. AC servo drive demand gains preference once buyers need familiar tuning workflows across packaging machines and robotics cells. CNC equipment users also need stable workflows.
How is embedded drive software positioned within deployment?
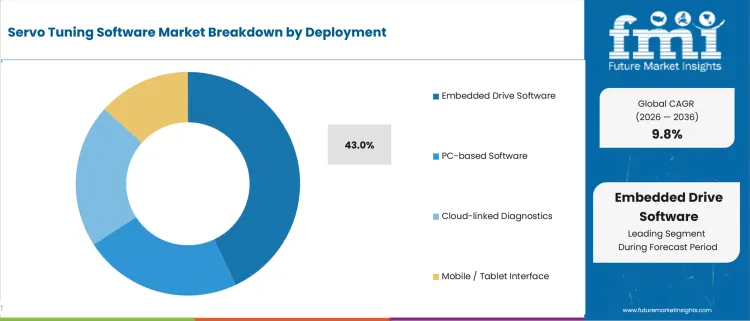
Embedded drive software is anticipated to support deployment as operators prefer tuning access close to drive parameters and diagnostic records. Automation teams use embedded tools to reduce handoffs between commissioning and troubleshooting. Maintenance review also uses embedded records. Siemens reported on December 2025, announcing SINAMICS Startdrive V21 in Basic and Advanced variants. Basic software includes essential commissioning and diagnostic functions and reinforces buyer interest in integrated drive engineering.
- Embedded drive software is expected to hold 43.0% share of deployment in 2026, guided by direct parameter access and drive-level diagnostic control. Account teams require embedded workflows tuning records supporting site acceptance and service follow-up.
- PC-based software and cloud-linked diagnostics support specialized review needs. Embedded drive software gains selection preference once buyers need lower setup burden and fewer tool-transfer gaps during machine commissioning.
How do machine builders influence end use demand?
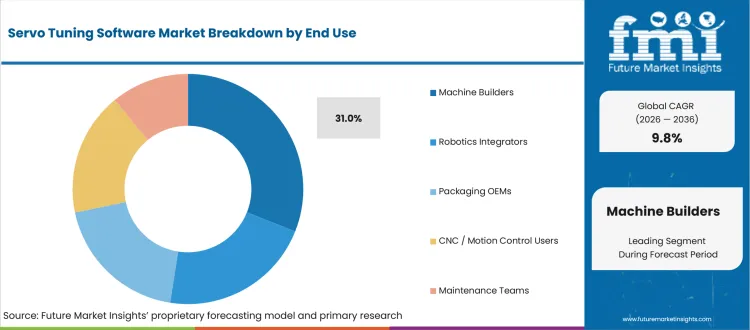
Machine builders are expected to shape end use as servo tuning software affects commissioning schedules and acceptance checks. Repeated machine quality also improves. Builder teams examine software evidence before selecting platforms for packaging machines and robotics equipment. CNC systems and production-line modules also require review. Omron reported on January 2025, stating its Sysmac platform controls 32 axes at a 250 microsecond cycle time. High-axis control capacity raises demand for repeatable tuning records across complex machines and coordinated motion programs.
- Based on end use, machine builders are forecast to capture 31.0% share in 2026 as repeated equipment builds and customer acceptance drive requirements. Supplier selection is likely to favor tools reducing commissioning rework and field-service escalation.
- Robotics integrators and maintenance teams require different support levels. Machine-builder demand receives attention once software tools connect engineering setup with reliable handover records.
What are the drivers, restraints, and opportunities in the servo tuning software market?
Near-term purchases are shaped by commissioning pressure and service-led adoption paths outlined below.
- Driver: Manufacturers are replacing manual trial-heavy setup with software-guided tuning workflows designed to reduce engineering rework and improve motion acceptance.
- Restraint: Adoption slows if software lacks compatibility evidence across drive families or site cybersecurity review.
- Opportunity: Suppliers offering guided commissioning and application support improve approval chances across automation accounts.
Expanding robotic systems across modern factories creates a considerable need for software handling equipment setups and keeps detailed diagnostic records. World Robotics 2025 reported global operational robot stock of 4,664,000 units in 2024. Extensive volumes of active hardware directly fuel software adoption as engineering teams are expected to maintain stable machine responses across all their programs.
Compatibility reviews become much stricter as machinery platforms introduce highly precise tracking features and larger regional power options. Yaskawa Electric Corporation reported on May 2025, a 26-bit encoder in its Σ-X Series 400 V input models. Advanced hardware specifications raise the need for clear parameter control proof, forcing buyers to demand field acceptance before approving any new software workflows.
Modern factories deploy cooperative machines requiring simpler tuning and basic troubleshooting help leading to new growth paths. Association for Advancing Automation reported on February 2026, collaborative robot orders of 7,212 units in 2025. Rising cooperative machine orders create an ideal environment for software tools designed to ensure safer setups and repeated motion reviews.
What country CAGRs are profiled in the servo tuning software market?
.webp "Top Country Growth Comparison Servo Tuning Software Market Cagr (2026 2036)")
| Country | CAGR |
|---|---|
| India | 12.1% |
| China | 11.2% |
| Taiwan | 9.5% |
| South Korea | 9.3% |
| United States | 8.7% |
| Germany | 8.1% |
| Japan | 7.8% |
Source: Future Market Insights, 2026.
How do country-level CAGRs compare in the servo tuning software market?
Country demand in servo tuning software is expected to be guided by automation buildout and supplier qualification discipline. India and China are likely to connect demand with local factory expansion and drive integration. Taiwan and South Korea are anticipated to connect adoption with electronics and precision equipment programs. United States and Japan are projected to connect demand with documentation depth and service accountability.
- India servo tuning software sector is likely to be shaped by machine-builder expansion and field-service needs. The market in India is projected to grow at 12.1% CAGR between 2026 and 2036, reflected by local equipment programs and rising acceptance-check discipline. International Federation of Robotics reported in September 2025 India reaching 9,120 industrial robot installations in 2024, reinforcing demand for tuning workflows reducing commissioning variation. Local suppliers are estimated to gain account attention through shorter training cycles and dependable application support.
- National Bureau of Statistics of China reported on March 2025, industrial robot output of 91,088 sets during January-February 2025, promoting drive-software trials as machine builders check axis response inside production cells. China servo tuning software industry is projected to be influenced by robot output and local servo-drive integration. Sales in China are anticipated to expand at 11.2% CAGR from 2026 to 2036, backed by automation scale and supplier proximity. Domestic vendors are expected to receive review strength once documentation and on-site support meet account requirements.
- The market in Taiwan is forecast to scale at 9.5% CAGR by 2036, guided by electronics manufacturing and precision equipment replacement cycles. Ministry of Economic Affairs reported on August 26, 2025, an industrial production index increase of 18.11% in July 2025, giving servo tuning software suppliers a deeper base of equipment users needing stable motion control and diagnostics. Purchasing teams are likely to test software through controller compatibility and local engineering response before repeating deployment. Supplier gains are anticipated to favor groups supporting semiconductor and machine-tool programs. Electronics assembly users.
- South Korea buyers are expected to favor servo tuning software suppliers supporting troubleshooting and consistent documentation. Demand in South Korea is likely to rise at 9.3% CAGR through 2036, reinforced by concentrated manufacturing networks and automation service expectations. International Federation of Robotics reported in September 2025 South Korea reaching 30,600 industrial robot installations in 2024, keeping tuning evidence close to plant acceptance and maintenance review. Suppliers are projected to compete through technical files and channel support. Field response across electronics and automotive accounts.
- United States servo tuning software purchasing is estimated to be guided by automation refresh cycles and plant-level uptime review. Association for Advancing Automation reported on February 2026, North American companies ordering 36,766 robots in 2025, supporting account focus on commissioning tools and servo diagnostics across manufacturing projects. Industry in the United States is anticipated to increase at 8.7% CAGR over the forecast period, helped by replacement automation and safety-focused engineering review. Supplier progress is likely to improve through training support and clear troubleshooting responsibility.
- Germany servo tuning software industry is anticipated to reflect strict engineering review and machine-build quality discipline. International Federation of Robotics reported in September 2025 Germany reaching 26,982 industrial robot installations in 2024, keeping servo tuning software under review for acceptance testing and line commissioning. The market in Germany is projected to progress at 8.1% CAGR through 2036, influenced by machinery exports and plant automation. Suppliers are expected to gain confidence once software records support repeated setup across machine builders and factory users.
- International Federation of Robotics reported in September 2025 Japan reaching 44,500 industrial robot installations in 2024, reinforcing demand for software tools supporting precision motion and diagnostic review. Japan account teams are likely to assess servo tuning software through quality assurance and compact equipment needs. Sector in Japan is forecast to expand at 7.8% CAGR from 2026 to 2036, aided by automation replacement and high-specification machine programs. Suppliers are anticipated to progress through documented compatibility and training depth.
Who are the notable companies in the servo tuning software market?
Yaskawa Electric Corporation, Siemens AG, Mitsubishi Electric Corporation, Rockwell Automation Inc., Omron Corporation, Schneider Electric SE, ABB Ltd, Bosch Rexroth AG, Delta Electronics Inc., and Kollmorgen Corporation are notable companies shaping servo tuning software demand.
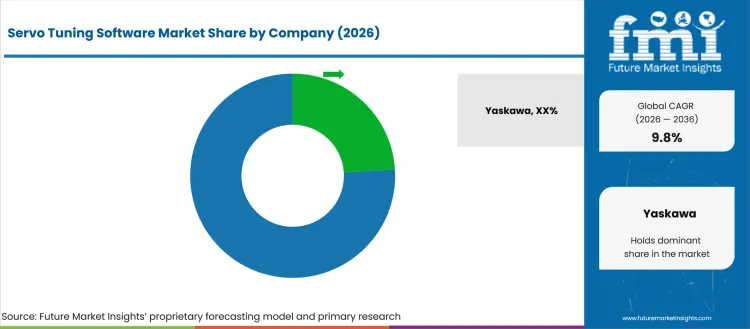
Competition is moderately fragmented across drive suppliers and motion-control specialists. Concentration is controlled by product qualification history and software compatibility along with gaining access to engineering support. Multinational suppliers hold wider portfolios and documentation systems. Focused specialists compete in applications requiring customization or service proximity.
- Automation software and drive suppliers such as Yaskawa Electric Corporation and Rockwell Automation Inc. gain account strength from drive availability and approval support. It is also contributed by Siemens AG and Mitsubishi Electric Corporation.
- Control platform and integration groups such as Omron Corporation and ABB Ltd are compared on software connection and specification review support. Schneider Electric SE also competes based on the same.
- Regional software and service partners such as Bosch Rexroth AG and Kollmorgen Corporation need more than price. Delta Electronics Inc. contribute led by service proximity and field support shaping repeat-account consideration.
- Application data and local support help vendors stay inside repeat-account reviews. Sourcing teams favor groups reducing handoffs between product selection and specification files.
Competitive Benchmarking: Servo Tuning Software Market
| Company | Portfolio Match | Segment Presence | Documentation Depth | Service Reach |
|---|---|---|---|---|
| Yaskawa Electric Corporation | High | High | High | Global |
| Siemens AG | High | High | High | Global |
| Mitsubishi Electric Corporation | High | High | High | Global |
| Rockwell Automation, Inc. | High | High | High | Global |
| Omron Corporation | Medium | High | High | Global |
| Schneider Electric SE | Medium | High | High | Global |
| ABB Ltd | Medium | Medium | High | Regional/Global |
| Bosch Rexroth AG | Medium | Medium | Medium | Regional/Global |
| Delta Electronics, Inc. | Medium | Medium | Medium | Regional |
| Kollmorgen Corporation | Medium | Medium | Medium | Regional |
Source: Future Market Insights competitive analysis, 2026.
Key Developments in the Servo Tuning Software Market
- In June 2025, Mitsubishi Electric announced the launch of its MELSERVO-JET series servo drive systems. According to official company releases, the series is engineered to democratize advanced automation by pairing hardware compactness with automated commissioning and tuning software capabilities.
- In September 2025, ABB Robotics added a generative AI assistant to RobotStudio Suite. ABB Robotics stated on September 2025 RobotStudio AI Assistant provides step-by-step programming guidance. Added guidance improves commissioning support for users reviewing robot motion and automation setup.
- In November 2025, Siemens AG listed DriveSim Engineer for SINAMICS S210 and G220 drives. Siemens AG stated in November 2025 the software provides a dynamic twin for virtual commissioning. Earlier drive-behavior review reduces physical testing effort before servo system deployment.
Key Players in the Servo Tuning Software Market
Automation software and drive suppliers
- Yaskawa Electric Corporation
- Siemens AG
- Mitsubishi Electric Corporation
- Rockwell Automation, Inc.
Control platform and integration specialists
- Omron Corporation
- Schneider Electric SE
- ABB Ltd
Regional software and service partners
- Bosch Rexroth AG
- Delta Electronics, Inc.
- Kollmorgen Corporation
Servo Tuning Software Market - Report Scope
| Coverage field | Report scope |
|---|---|
| Market breakdown | Servo tuning software breakdown by revenue model, drive type, deployment, end use, software function, and region |
| Market Definition | Servo tuning software refers to tools used to configure, tune, program, diagnose, or optimize motion-control systems in industrial automation and precision equipment. |
| Regions Covered | North America, Latin America, Europe, East Asia, South Asia, Oceania, Middle East and Africa |
| Countries Covered | United States, China, Germany, Japan, India, South Korea, Taiwan, additional profiled countries |
| Key Companies Profiled | Yaskawa Electric Corporation, Siemens AG, Mitsubishi Electric Corporation, Rockwell Automation, Inc., Omron Corporation, Schneider Electric SE, ABB Ltd, Bosch Rexroth AG, Delta Electronics, Inc., Kollmorgen Corporation |
| Forecast Period | 2026 to 2036 |
| Approach | Hybrid bottom-up and top-down methodology using automation equipment installations, drive installed base, segment share, country CAGR, software deployment model, channel path. |
Source: Future Market Insights analysis, 2026.
Servo Tuning Software Market - Research Methodology
| Method | Approach |
|---|---|
| Primary Research | Primary interviews covered machine builders, automation engineers, OEMs, system integrators, robotics integrators, packaging equipment suppliers, CNC users, plant maintenance teams, distributors, and channel accounts. Discussions focused on commissioning speed, drive compatibility, tuning evidence, diagnostic usability, controller integration, service ownership, and repeat-order readiness. |
| Desk Research | Desk research reviewed official robotics datasets, automation association releases, company product updates, standards-body references, and drive-software materials. Adjacent FMI context included linked pages inside the report scope table. |
| Market Sizing and Forecasting | Market sizing used a hybrid model across segment mix, country CAGR, automation equipment base, drive software adoption, revenue model, software deployment path, and supplier coverage across servo tuning software. |
| Data Validation | Data validation compares interview findings from automation engineers, motion control distributors, machinery builders, and factory maintenance teams against software adoption programs and channel availability. Analysts test country-level growth against new equipment installations, drive modernization needs, and verified vendor portfolios to exclude unrelated automation tools. The forecast is then triangulated across new machine deployments, controller upgrades, and recurring factory optimization cycles that influence repeat servo tuning software demand. |
Source: Future Market Insights analysis, 2026.
Servo Tuning Software Market by Segments
Servo Tuning Software Market segmented by Revenue Model:
- Bundled with Drive
- Licensed Software
- Subscription - Analytics
Servo Tuning Software Market segmented by Drive Type:
- AC Servo Drives
- Multi-axis Servo Drives
- Integrated Servo Motors
Servo Tuning Software Market segmented by Deployment:
- Embedded Drive Software
- PC-based Software
- Cloud-linked Diagnostics
- Mobile - Tablet Interface
Servo Tuning Software Market segmented by End Use:
- Machine Builders
- Robotics Integrators
- Packaging OEMs
- CNC - Motion Control Users
- Maintenance Teams
Servo Tuning Software Market segmented by Software Function:
- Auto-tuning
- Manual Gain Tuning
- Vibration Suppression
- Load Inertia Estimation
- Frequency Response Analysis
- Commissioning Wizards
Servo Tuning Software Market by Region:
- North America
- United States
- Canada
- Latin America
- Brazil
- Mexico
- Argentina
- Europe
- Germany
- United Kingdom
- France
- Italy
- Spain
- East Asia
- China
- Japan
- South Korea
- Taiwan
- South Asia
- India
- Thailand
- Indonesia
- Oceania
- Australia
- New Zealand
- Middle East and Africa
- GCC countries
- South Africa
- Turkey
Research Sources and Bibliography
- ABB Robotics. (2025, September 25). ABB Robotics adds generative AI assistant to RobotStudio.
- Association for Advancing Automation. (2026, February 6). A3 robotics statistics.
- International Federation of Robotics. (2025, September 25). World Robotics 2025 report - Industrial robots.
- Ministry of Economic Affairs. (2025, August 26). Industrial Production Index in July 2025.
- National Bureau of Statistics of China. (2025, March 18). Industrial Production Operation from January to February 2025.
- Siemens AG. (2025, November 19). DriveSim Engineer.
- Yaskawa Electric Corporation. (2025, May 19). Yaskawa to start sales of AC Servo Drive Sigma-X Series 400 V input models.
- Omron Corporation. (2025, February 21). Development of tuning technology for servo driver parameter based on stability analysis and simulation.
- Omron Corporation. (2025, January 8). Sysmac: A fully integrated platform.
- Siemens AG. (2025, December 4). Sales and delivery release for SINAMICS Startdrive V21.
- Yaskawa Electric Corporation. (2025, January 23). Yaskawa to start sales for functional safety-compliant products for AC servo drives Sigma-X series.
- Yaskawa Electric Corporation. (2025, May 19). Yaskawa to start sales of AC servo drive Sigma-X series 400 V input models.
This bibliography is provided for reader reference and is not exhaustive. The full report contains the complete reference list and detailed citations.
This Report Answers
- What value is forecast for the servo tuning software market in 2026 and by 2036?
- What CAGR is forecast for the servo tuning software market from 2026 to 2036?
- What segments shape demand across revenue model, drive type, deployment, end use, and software function?
- How do automation buyers evaluate servo tuning software before adding it to approved equipment programs?
- How do country CAGRs differ across profiled markets?
- What companies compete through drive portfolios and service reach?
- How does FMI validate forecasts using a hybrid bottom-up and top-down approach?
- What factors should account teams address before larger account expansion?
- How do technical files and commissioning records influence supplier selection?
- What supplier capabilities improve long-term account confidence?
Frequently Asked Questions
What is supporting demand in the servo tuning software market?
Demand is likely to be supported by machine builders and automation teams needing documented motion performance and dependable acceptance records across servo-driven equipment programs. Accounts are expected to prefer software tools combining tuning guidance and drive compatibility evidence.
Who are the notable suppliers in the servo tuning software market?
Notable companies are anticipated to include Yaskawa Electric Corporation, Siemens AG, Mitsubishi Electric Corporation, Rockwell Automation Inc., Omron Corporation, Schneider Electric SE, ABB Ltd, Bosch Rexroth AG, Delta Electronics Inc., and Kollmorgen Corporation. Competition is likely to be based on servo-drive portfolios and field support.
What is a restraint in the servo tuning software market?
A main restraint comes from proof burden across cybersecurity review and service responsibility during account approval cycles. Accounts slow adoption if compatibility records are incomplete or field ownership remains unclear after commissioning.
Why should executives track the servo tuning software market?
Executives are expected to track the market as tuning software affects commissioning time and uptime discipline. Factors such as rework exposure and plant handover quality shape buyer reviews.
What business problem does the servo tuning software market address?
Servo tuning software addresses setup variation and motion instability. Diagnostic delay and acceptance-record gaps across automation projects using servo-driven equipment. Machine builders and plant teams need software tools to configure and tune. Software teams also diagnose and optimize servo motion across repeated projects.
What should account teams evaluate before selecting suppliers?
Account teams are likely to evaluate drive compatibility and diagnostic depth before supplier approval. Documentation files and field-service response are expected to guide final supplier review.
What limits return on investment for purchasing teams?
Return on investment weakens if software does not shorten commissioning or reduce field troubleshooting. Compatibility failures and delayed acceptance checks reduce expected margin gains.
How do suppliers build long-term account confidence?
Suppliers build account confidence by providing repeatable tuning evidence and clear technical files specific to servo tuning software. Application guidance and responsive troubleshooting are expected to influence repeat-order trust.
Preview the report firsthand - request a free sample
Get SampleGet the brochure for pricing and purchase details.
Get PDFTable of Content
- Key Takeaways
- Market Size and CAGR
- Top Growth Driver
- Fastest Growing Segment
- Leading Region
- Key Companies
- Emerging Opportunities
- Executive Summary
- Global Market Outlook
- Demand-side Trends
- Supply-side Trends
- Technology Roadmap Analysis
- Analysis and Recommendations
- Analyst Perspective (What is happening? Why now? What should investors know?)
- Key Questions Answered
- How large is the market?
- What is the CAGR?
- What are key trends?
- Which region dominates?
- Who are the leaders?
- Market Overview
- Market Coverage / Taxonomy
- Market Definition / Scope / Limitations
- Research Methodology
- Chapter Orientation
- Analytical Lens and Working Hypotheses
- Market Structure, Signals, and Trend Drivers
- Benchmarking and Cross-market Comparability
- Market Sizing, Forecasting, and Opportunity Mapping
- Research Design and Evidence Framework
- Desk Research Programme (Secondary Evidence)
- Expert Input and Fieldwork (Primary Evidence)
- Tooling, Models, and Reference Databases
- Data Engineering and Model Build
- Quality Assurance and Audit Trail
- Market Background
- Market Dynamics (Drivers, Restraints, Opportunity, Trends)
- Scenario Forecast (Optimistic, Likely, Conservative)
- Impact Analysis
- AI Impact
- Sustainability Impact
- Regulatory Impact
- Technology Impact
- Consumer / Buyer Analysis
- Purchase Drivers
- Adoption Barriers
- Buyer Journey
- Opportunity Map Analysis
- Product Life Cycle Analysis
- Supply Chain Analysis
- Investment Feasibility Matrix
- Value Chain Analysis
- PESTLE and Porter's Analysis
- Regulatory Landscape
- Regional Parent Market Outlook
- Production and Consumption Statistics
- Import and Export Statistics
- Global Market Analysis and Forecast, 2021 to 2036
- Historical Market Size Value (USD Million) & Volume (Unit) Analysis, 2021 to 2025
- Current and Future Market Size Value (USD Million) & Volume (Unit) Projections, 2026 to 2036
- Y-o-Y Growth Trend Analysis
- Absolute $ Opportunity Analysis
- Global Market Pricing Analysis, 2021 to 2036
- Global Market Analysis and Forecast, By Software Function, 2021 to 2036
- Introduction / Key Findings
- Historical Market Size Value (USD Million) & Volume (Unit) Analysis By Software Function, 2021 to 2025
- Current and Future Market Size Value (USD Million) & Volume (Unit) Analysis and Forecast By Software Function, 2026 to 2036
- Auto-tuning
- Manual Gain Tuning
- Vibration Suppression
- Load Inertia Estimation
- Frequency Response Analysis
- Commissioning Wizards
- Auto-tuning
- Y-o-Y Growth Trend Analysis By Software Function, 2021 to 2025
- Absolute $ Opportunity Analysis By Software Function, 2026 to 2036
- Global Market Analysis and Forecast, By Deployment, 2021 to 2036
- Introduction / Key Findings
- Historical Market Size Value (USD Million) & Volume (Unit) Analysis By Deployment, 2021 to 2025
- Current and Future Market Size Value (USD Million) & Volume (Unit) Analysis and Forecast By Deployment, 2026 to 2036
- Embedded Drive Software
- PC-based Software
- Cloud-linked Diagnostics
- Mobile / Tablet Interface
- Embedded Drive Software
- Y-o-Y Growth Trend Analysis By Deployment, 2021 to 2025
- Absolute $ Opportunity Analysis By Deployment, 2026 to 2036
- Global Market Analysis and Forecast, By Drive Type, 2021 to 2036
- Introduction / Key Findings
- Historical Market Size Value (USD Million) & Volume (Unit) Analysis By Drive Type, 2021 to 2025
- Current and Future Market Size Value (USD Million) & Volume (Unit) Analysis and Forecast By Drive Type, 2026 to 2036
- AC Servo Drives
- Multi-axis Servo Drives
- Integrated Servo Motors
- AC Servo Drives
- Y-o-Y Growth Trend Analysis By Drive Type, 2021 to 2025
- Absolute $ Opportunity Analysis By Drive Type, 2026 to 2036
- Global Market Analysis and Forecast, By End Use, 2021 to 2036
- Introduction / Key Findings
- Historical Market Size Value (USD Million) & Volume (Unit) Analysis By End Use, 2021 to 2025
- Current and Future Market Size Value (USD Million) & Volume (Unit) Analysis and Forecast By End Use, 2026 to 2036
- Machine Builders
- Robotics Integrators
- Packaging OEMs
- CNC / Motion Control Users
- Maintenance Teams
- Machine Builders
- Y-o-Y Growth Trend Analysis By End Use, 2021 to 2025
- Absolute $ Opportunity Analysis By End Use, 2026 to 2036
- Global Market Analysis and Forecast, By Revenue Model, 2021 to 2036
- Introduction / Key Findings
- Historical Market Size Value (USD Million) & Volume (Unit) Analysis By Revenue Model, 2021 to 2025
- Current and Future Market Size Value (USD Million) & Volume (Unit) Analysis and Forecast By Revenue Model, 2026 to 2036
- Bundled with Drive
- Licensed Software
- Subscription / Analytics
- Bundled with Drive
- Y-o-Y Growth Trend Analysis By Revenue Model, 2021 to 2025
- Absolute $ Opportunity Analysis By Revenue Model, 2026 to 2036
- Global Market Analysis and Forecast, By Region, 2021 to 2036
- Introduction
- Historical Market Size Value (USD Million) & Volume (Unit) Analysis By Region, 2021 to 2025
- Current Market Size Value (USD Million) & Volume (Unit) Analysis and Forecast By Region, 2026 to 2036
- North America
- Latin America
- Western Europe
- Eastern Europe
- East Asia
- South Asia and Pacific
- Middle East & Africa
- Market Attractiveness Analysis By Region
- North America Market Analysis and Forecast, By Country, 2021 to 2036
- Historical Market Size Value (USD Million) & Volume (Unit) Trend Analysis By Market Taxonomy, 2021 to 2025
- Market Size Value (USD Million) & Volume (Unit) Forecast By Market Taxonomy, 2026 to 2036
- By Country
- USA
- Canada
- By Software Function
- By Deployment
- By Drive Type
- By End Use
- By Revenue Model
- By Country
- Market Attractiveness Analysis
- By Country
- By Software Function
- By Deployment
- By Drive Type
- By End Use
- By Revenue Model
- Key Takeaways
- Latin America Market Analysis and Forecast, By Country
- Historical Market Size Value (USD Million) & Volume (Unit) Trend Analysis By Market Taxonomy, 2021 to 2025
- Market Size Value (USD Million) & Volume (Unit) Forecast By Market Taxonomy, 2026 to 2036
- By Country
- Brazil
- Mexico
- Chile
- Rest of Latin America
- By Software Function
- By Deployment
- By Drive Type
- By End Use
- By Revenue Model
- By Country
- Market Attractiveness Analysis
- By Country
- By Software Function
- By Deployment
- By Drive Type
- By End Use
- By Revenue Model
- Key Takeaways
- Western Europe Market Analysis and Forecast, By Country
- Historical Market Size Value (USD Million) & Volume (Unit) Trend Analysis By Market Taxonomy, 2021 to 2025
- Market Size Value (USD Million) & Volume (Unit) Forecast By Market Taxonomy, 2026 to 2036
- By Country
- Germany
- UK
- Italy
- Spain
- France
- Nordic
- BENELUX
- Rest of Western Europe
- By Software Function
- By Deployment
- By Drive Type
- By End Use
- By Revenue Model
- By Country
- Market Attractiveness Analysis
- By Country
- By Software Function
- By Deployment
- By Drive Type
- By End Use
- By Revenue Model
- Key Takeaways
- Eastern Europe Market Analysis and Forecast, By Country
- Historical Market Size Value (USD Million) & Volume (Unit) Trend Analysis By Market Taxonomy, 2021 to 2025
- Market Size Value (USD Million) & Volume (Unit) Forecast By Market Taxonomy, 2026 to 2036
- By Country
- Russia
- Poland
- Hungary
- Balkan & Baltic
- Rest of Eastern Europe
- By Software Function
- By Deployment
- By Drive Type
- By End Use
- By Revenue Model
- By Country
- Market Attractiveness Analysis
- By Country
- By Software Function
- By Deployment
- By Drive Type
- By End Use
- By Revenue Model
- Key Takeaways
- East Asia Market Analysis and Forecast, By Country
- Historical Market Size Value (USD Million) & Volume (Unit) Trend Analysis By Market Taxonomy, 2021 to 2025
- Market Size Value (USD Million) & Volume (Unit) Forecast By Market Taxonomy, 2026 to 2036
- By Country
- China
- Japan
- South Korea
- By Software Function
- By Deployment
- By Drive Type
- By End Use
- By Revenue Model
- By Country
- Market Attractiveness Analysis
- By Country
- By Software Function
- By Deployment
- By Drive Type
- By End Use
- By Revenue Model
- Key Takeaways
- South Asia and Pacific Market Analysis and Forecast, By Country
- Historical Market Size Value (USD Million) & Volume (Unit) Trend Analysis By Market Taxonomy, 2021 to 2025
- Market Size Value (USD Million) & Volume (Unit) Forecast By Market Taxonomy, 2026 to 2036
- By Country
- India
- ASEAN
- Australia & New Zealand
- Rest of South Asia and Pacific
- By Software Function
- By Deployment
- By Drive Type
- By End Use
- By Revenue Model
- By Country
- Market Attractiveness Analysis
- By Country
- By Software Function
- By Deployment
- By Drive Type
- By End Use
- By Revenue Model
- Key Takeaways
- Middle East & Africa Market Analysis and Forecast, By Country
- Historical Market Size Value (USD Million) & Volume (Unit) Trend Analysis By Market Taxonomy, 2021 to 2025
- Market Size Value (USD Million) & Volume (Unit) Forecast By Market Taxonomy, 2026 to 2036
- By Country
- Kingdom of Saudi Arabia
- Other GCC Countries
- Türkiye
- South Africa
- Other African Union
- Rest of Middle East & Africa
- By Software Function
- By Deployment
- By Drive Type
- By End Use
- By Revenue Model
- By Country
- Market Attractiveness Analysis
- By Country
- By Software Function
- By Deployment
- By Drive Type
- By End Use
- By Revenue Model
- Key Takeaways
- Key Countries Market Analysis
- USA
- Pricing Analysis
- Market Share Analysis, 2025
- By Software Function
- By Deployment
- By Drive Type
- By End Use
- By Revenue Model
- Canada
- Pricing Analysis
- Market Share Analysis, 2025
- By Software Function
- By Deployment
- By Drive Type
- By End Use
- By Revenue Model
- Mexico
- Pricing Analysis
- Market Share Analysis, 2025
- By Software Function
- By Deployment
- By Drive Type
- By End Use
- By Revenue Model
- Brazil
- Pricing Analysis
- Market Share Analysis, 2025
- By Software Function
- By Deployment
- By Drive Type
- By End Use
- By Revenue Model
- Chile
- Pricing Analysis
- Market Share Analysis, 2025
- By Software Function
- By Deployment
- By Drive Type
- By End Use
- By Revenue Model
- Germany
- Pricing Analysis
- Market Share Analysis, 2025
- By Software Function
- By Deployment
- By Drive Type
- By End Use
- By Revenue Model
- UK
- Pricing Analysis
- Market Share Analysis, 2025
- By Software Function
- By Deployment
- By Drive Type
- By End Use
- By Revenue Model
- Italy
- Pricing Analysis
- Market Share Analysis, 2025
- By Software Function
- By Deployment
- By Drive Type
- By End Use
- By Revenue Model
- Spain
- Pricing Analysis
- Market Share Analysis, 2025
- By Software Function
- By Deployment
- By Drive Type
- By End Use
- By Revenue Model
- France
- Pricing Analysis
- Market Share Analysis, 2025
- By Software Function
- By Deployment
- By Drive Type
- By End Use
- By Revenue Model
- India
- Pricing Analysis
- Market Share Analysis, 2025
- By Software Function
- By Deployment
- By Drive Type
- By End Use
- By Revenue Model
- ASEAN
- Pricing Analysis
- Market Share Analysis, 2025
- By Software Function
- By Deployment
- By Drive Type
- By End Use
- By Revenue Model
- Australia & New Zealand
- Pricing Analysis
- Market Share Analysis, 2025
- By Software Function
- By Deployment
- By Drive Type
- By End Use
- By Revenue Model
- China
- Pricing Analysis
- Market Share Analysis, 2025
- By Software Function
- By Deployment
- By Drive Type
- By End Use
- By Revenue Model
- Japan
- Pricing Analysis
- Market Share Analysis, 2025
- By Software Function
- By Deployment
- By Drive Type
- By End Use
- By Revenue Model
- South Korea
- Pricing Analysis
- Market Share Analysis, 2025
- By Software Function
- By Deployment
- By Drive Type
- By End Use
- By Revenue Model
- Russia
- Pricing Analysis
- Market Share Analysis, 2025
- By Software Function
- By Deployment
- By Drive Type
- By End Use
- By Revenue Model
- Poland
- Pricing Analysis
- Market Share Analysis, 2025
- By Software Function
- By Deployment
- By Drive Type
- By End Use
- By Revenue Model
- Hungary
- Pricing Analysis
- Market Share Analysis, 2025
- By Software Function
- By Deployment
- By Drive Type
- By End Use
- By Revenue Model
- Kingdom of Saudi Arabia
- Pricing Analysis
- Market Share Analysis, 2025
- By Software Function
- By Deployment
- By Drive Type
- By End Use
- By Revenue Model
- Türkiye
- Pricing Analysis
- Market Share Analysis, 2025
- By Software Function
- By Deployment
- By Drive Type
- By End Use
- By Revenue Model
- South Africa
- Pricing Analysis
- Market Share Analysis, 2025
- By Software Function
- By Deployment
- By Drive Type
- By End Use
- By Revenue Model
- USA
- Market Structure Analysis
- Competition Dashboard
- Competition Benchmarking
- Market Share Analysis of Top Players
- By Regional
- By Software Function
- By Deployment
- By Drive Type
- By End Use
- By Revenue Model
- Emerging Startups
- Innovation Benchmarking
- Competition Analysis
- Competition Deep Dive
- Yaskawa
- Overview
- Product Portfolio
- Profitability by Market Segments (Product/Region/Sales Channel)
- Sales Footprint
- Strategy Overview
- Marketing Strategy
- Product Strategy
- Channel Strategy
- Siemens
- Mitsubishi Electric
- Rockwell Automation
- Omron
- Schneider Electric
- ABB
- Bosch Rexroth
- Delta Electronics
- Kollmorgen
- Yaskawa
- Case Studies
- Success Stories
- Recent Developments
- Competition Deep Dive
- Assumptions & Acronyms Used


