

- Market Size (2026)
- USD 560.6 Mn
- Forecast (2036)
- USD 975.9 Mn
- CAGR (2026 to 2036)
- 5.7%
How big is the motor adapter plates market size?
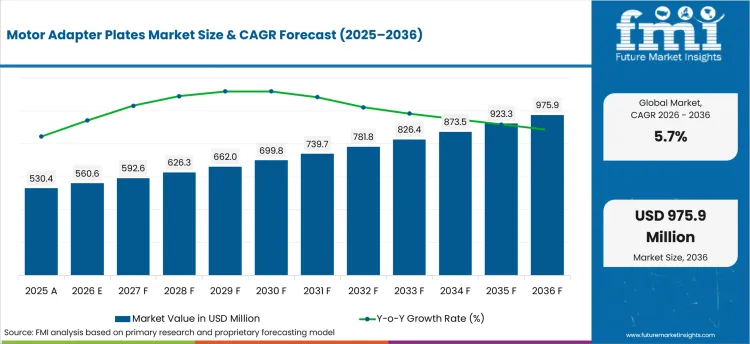
USD 560.6 million in 2026 and USD 975.9 million by 2036 at a 5.7% CAGR.
Demand for motor adapter plates is projected to expand at 5.7% CAGR between 2026 and 2036, increasing valuation from USD 560.6 million in 2026 to USD 975.9 million by 2036. Upgrading factory equipment and scaling industrial automation require dependable motor adapter plates connecting servo motors and retrofit kits without altering existing mounting geometry. The need for standardized and repeatable mounting hardware is directly driven by the significant scale of active industrial machinery. According to a September 2025 release from the International Federation of Robotics, the global operational stock of industrial robots reached 4,664,000 units in 2024. This substantial base of operating equipment reinforces the demand for reliable transition components across modern automation programs and facility upgrades.
Succeeding in global markets requires understanding specific regional sourcing behaviors. Purchasing teams in India and China favor local machining access combined with faster engineering responses for automation initiatives. Enterprises in Mexico and the United States carefully review supply continuity and assembly support before approving changes to vendor lists. To meet such high-volume demands, digital supply networks have evolved to streamline component sourcing. As stated by MISUMI Group in November 2025 regarding its D-JIT service, platforms now provide real-time inventory data from more than 700 global suppliers. This instant availability visibility supports larger-volume equipment builds and ensures seamless component integration for industrial procurement teams worldwide.
| Metric | Value |
|---|---|
| 2025 Market Size | USD 530.4 million |
| 2026 Market Size | USD 560.6 million |
| 2036 Market Size | USD 975.9 million |
| Forecast CAGR (2026-2036) | 5.7% |
| Material Focus | Aluminum (52.0% share in 2026) |
| Sales Channel Focus | Direct OEM supply (38.4% share in 2026) |
| Standard Focus | NEMA (34.0% share in 2026) |
Summary of the Motor Adapter Plates Market
| Market Signal | Commercial Impact |
|---|---|
| Demand and Growth Drivers | Demand for motor adapter plates is expected to rise as automation teams connect mounting accuracy with commissioning speed and repeat equipment performance. Account decisions are anticipated to reflect fit evidence and supplier response in recurring orders.
|
| Product and Segment View | Segment demand is led by aluminum materials and NEMA standard formats requiring documented compatibility. Specification work is projected to concentrate on supplier-controlled plate programs designed to protect machine accuracy without delaying installation review.
|
| Geography and Growth Outlook | Country demand is expected to be stronger in automation markets with robot installations and active machine tool use. Supplier gains are likely to reflect local machining access and service-led account review.
|
| Competition View | Competition is likely to focus on plate accuracy and replenishment speed. Account gains are expected to favor suppliers with clear tolerance records and dependable technical support.
|
| Analyst Perspective | Motor adapter plates are developing into a specification-led accessory segment associated with automation uptime and machine retrofit needs. Supplier progress is projected to improve through drawing support and localized service aligned with machine builders and maintenance teams.
|
Source: Future Market Insights analysis, 2026.
How is the motor adapter plates market segmented?
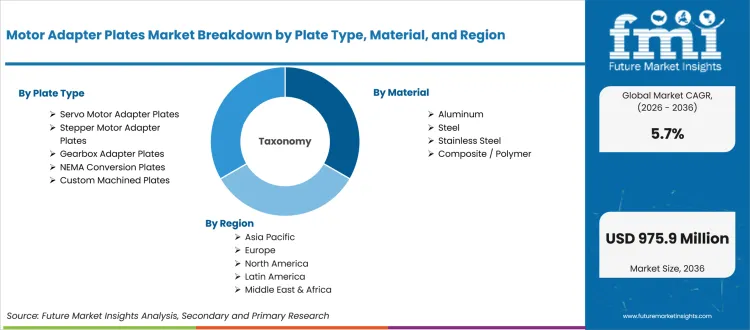
The motor adapter plates industry is segmented by plate type, material, standard, application, sales channel, and region.
The motor adapter plates market is segmented by plate type, material, standard, application, sales channel, and region. Plate type coverage includes servo motor adapter plates, stepper motor adapter plates, gearbox adapter plates, NEMA conversion plates, and custom machined plates. Material coverage includes aluminum, steel, stainless steel, composite / polymer, and coated alloy. Standard coverage includes NEMA, IEC, JIS, proprietary OEM, and hybrid frame standards. Application coverage includes motor-gearbox coupling, machine retrofitting, robotics, test benches, and compact automation modules. Sales channel coverage includes direct OEM supply, component distributors, online industrial platforms, machine builders, and MRO supply partners. Regional coverage includes North America, Latin America, Europe, East Asia, South Asia, Oceania, and Middle East and Africa.
What supports demand for servo motor adapter plates within plate type?
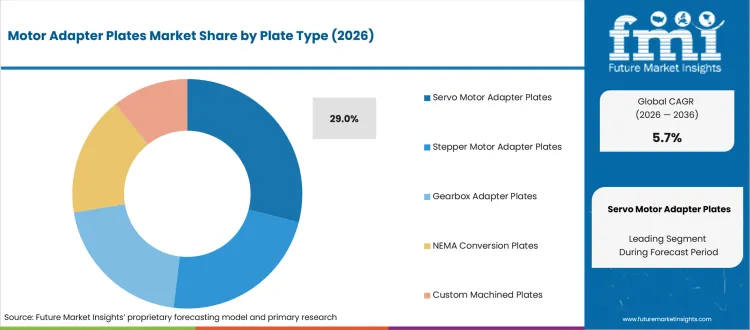
Servo motor adapter plates are expected to support equipment builds requiring accurate motor-to-load alignment. Machine builders use servo plate formats to reduce commissioning rework and maintain frame compatibility in repeat programs. Association for Advancing Automation reported on February 2026 stating North American robot orders having grown 6.6% in 2025. Order expansion adds factory automation demand for motor mounting interfaces and motion accessories.
- Servo motor adapter plates are predicted to represent 29.0% share of plate type in 2026, reflected by recurring motion-control builds and retrofit use. Review strength is achieved with plate drawings matching motor and gearbox interfaces, profiting the suppliers.
- Stepper motor adapter plates and gearbox adapter plates serve different equipment profiles. Servo motor adapter plates receive buyer attention once accuracy and commissioning time guide machine builder review.
How is aluminum positioned within material?
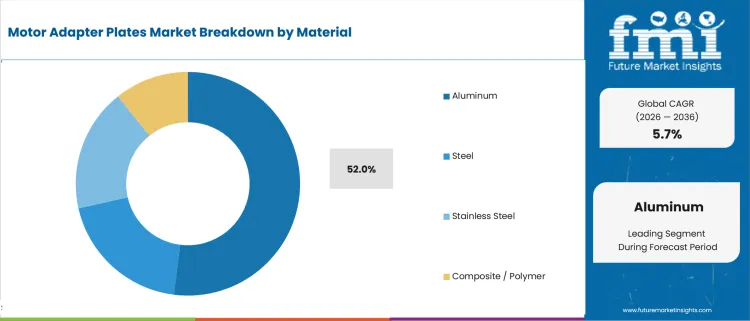
International Federation of Robotics reported on September 2025 announcing metal and machinery robot installations reaching 88,777 units in 2024. Machinery-linked automation demand signals stronger plate review in motor-interface programs. Aluminum is expected to lead material selection as machine builders balance machinability and plate stiffness. Equipment teams prefer aluminum during compact automation projects requiring quicker machining and repeatable finish quality.
- By material, aluminum is estimated to account for 52.0% share in 2026, led by machining speed and lighter equipment designs. Suppliers gain account approval on tolerance records and finish consistency promoting repeat equipment builds.
- Steel and stainless steel remain useful for rugged or washdown settings. Aluminum gains selection preference once buyers need faster machining and lower installed weight in factory automation and industrial controls programs.
What drives NEMA demand within standard?
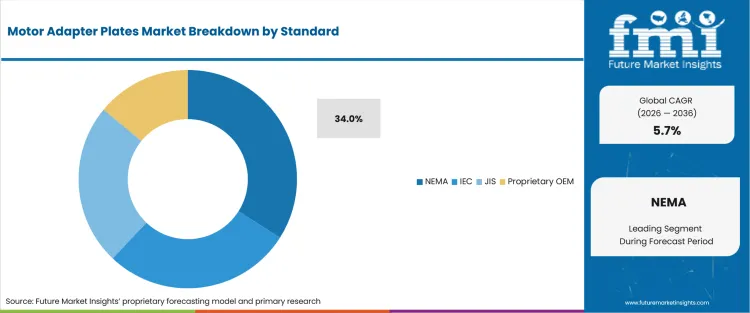
NEMA standards are projected to guide purchasing as buyers need familiar mounting references for gearboxes and automation modules. Specification teams use NEMA conversion plates to protect frame continuity during equipment updates and replacement cycles. AutomationDirect listed a SureMotion motor adapter for NEMA 34 actuators in 2026. Active catalog support reinforces standard motor-frame interface demand.
- Based on standard, NEMA is forecast to capture 34.0% share in 2026 owing to common frame references and easier design comparison. Buyers prefer NEMA-linked plates once retrofit work needs familiar interface dimensions.
- IEC and proprietary OEM formats serve different regional and equipment needs. NEMA demand improves once adapter plates reduce redesign work for replacement motors and machine upgrades.
Why does machine retrofitting influence application demand?
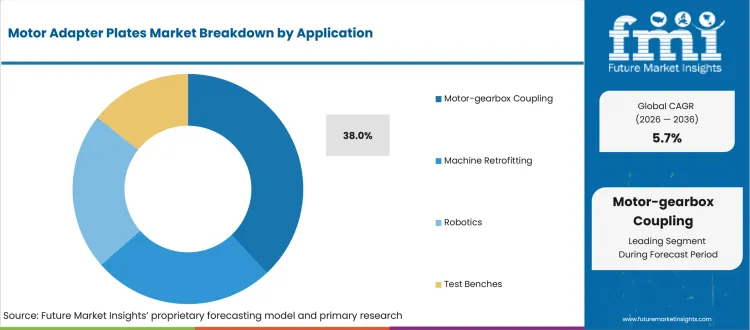
Machine retrofitting is anticipated to support demand as maintenance teams add drives or update automation modules without full equipment redesign. Retrofit projects need adapter plates aligning new motor frames with existing machine bases and gearbox inputs. Office for National Statistics reported on April 2026 for UK machinery and equipment output having risen 3.9% in February 2026. Active machine production supports replacement component review.
- In 2026, machine retrofitting is set to garner 31.8% share since it influences equipment life extension and installation flexibility. Plates reducing field rework and drawing changes help suppliers acquire account attention.
- Robotics and test benches require tighter motion tolerances. Retrofitting gains account priority once buyer teams compare replacement cost with equipment downtime and service complexity.
How does direct OEM supply support sales channel demand?
Direct OEM supply is projected to support purchasing as equipment builders need bolt-hole references and technical follow-up before regular plate orders. OEM engineers prefer supplier contact shortening changes to material grade and motor-frame compatibility. MISUMI Group stated on April 2025 for Fictiv reaching approximately 250 manufacturing partners worldwide. Custom mechanical component access supports engineering teams needing machined parts.
- Direct OEM supply is projected to represent 38.4% share in 2026, backed by account-specific design review and engineering file control. Machine builders prefer direct support once mounting geometry affects launch timelines.
- Component distributors and online industrial platforms remain useful for replacement orders. Direct OEM supply gains preference once account teams need coordinated plate design and recurring specification control.
What are the drivers, restraints, and opportunities in the motor adapter plates market?
Near-term purchases are shaped by qualification control and installation reliability outlined below.
- Driver: Machine builders are replacing improvised mounting work with validated plate formats designed to reduce alignment risk and protect repeatability in automated equipment.
- Restraint: Adoption slows if torque-transfer notes or installation drawings remain unclear during trial builds.
- Opportunity: Suppliers offering application guidance and stocked plate options improve approval chances across retrofit and machine builder accounts.
Factories setting up new automated machinery rely heavily on consistent parts, integrating together without causing installation delays. Industry data from September 2025 confirmed a high volume of hardware adoption, highlighting global industrial robot installations reaching 542,076 units in 2024. High installation numbers keep engineers closely focused on ensuring plates and motor mounts align perfectly during the early design stages of new machines.
Buying catalog parts creates issues with standard components failing to match the actual performance needed on the factory floor. An International Federation of Robotics executive summary from 2025 reported for robot installations in the United States having dropped by 10% to 50,077 units in 2024. Slower regional growth is making buyers more careful, forcing them to thoroughly inspect every motor component before approving new suppliers.
Online sourcing platforms are making it significantly easier for factories to find and order essential machine parts quickly. MISUMI Group highlighted the popularity of such digital tools in November 2025, announcing over 90,000 companies actively using its D-JIT delivery platform. Wider platform adoption connects manufacturers with large volumes of ready-to-use parts for both factory equipment and automated warehouses.
What country CAGRs are profiled in the motor adapter plates market?
.webp "Top Country Growth Comparison Motor Adapter Plates Market Cagr (2026 2036)")
| Country | CAGR |
|---|---|
| India | 7.6% |
| China | 6.8% |
| Mexico | 5.5% |
| United Kingdom | 5.0% |
| United States | 4.8% |
| Germany | 4.4% |
| Japan | 4.1% |
Source: Future Market Insights, 2026.
How do country-level CAGRs compare in the motor adapter plates market?
Country demand in motor adapter plates is expected to be guided by automation depth and local machine-building access. India and China are likely to connect demand with factory automation expansion and local machining capacity. Mexico and the United Kingdom are anticipated to connect adoption with equipment assembly needs and distributor response. United States and Japan are projected to connect demand with documentation discipline and supplier validation.
- India motor adapter plate market is likely to be shaped by factory automation adoption and price-sensitive plate qualification. Demand in India is projected to grow at 7.6% CAGR through 2036 as local robot adoption strengthens machine hardware needs. International Federation of Robotics reported in its September 2025 release announcing India to have installed 9,120 industrial robots in 2024. Installation depth keeps plate approval close to motor-interface accuracy and retrofit response. Local suppliers are estimated to gain account attention through short sampling cycles and consistent plate availability.
- China motor adapter plate sector is projected to be influenced by robot deployment scale and domestic machining capacity. International Federation of Robotics reported in its September 2025 executive summary stating China having installed 295,045 industrial robots in 2024. Sales in China are forecast to expand at 6.8% CAGR from 2026 to 2036 due to equipment production and faster converter response propelling demand. High factory automation volume makes plate qualification important since minor hole-pattern errors may affect recurring machine builds quickly. Domestic suppliers are expected to receive review strength once drawing support and replenishment discipline match equipment launch calendars.
- Industry in Mexico is anticipated to scale at 5.5% CAGR over forecast years, backed by nearshoring-linked equipment investment influencing distributor-led access. Mexico adapter plate purchasing is estimated to be guided by assembly-line upgrades and North American component availability. International Federation of Robotics 2025 executive summary reported Mexico reaching 5,594 industrial robots installations in 2024. Installation activity keeps motor-mounting evidence important for plants managing downtime and replacement hardware. Supplier progress is likely to improve through catalog availability and clear tolerance files.
- United Kingdom buyers are expected to favor suppliers supporting verified drawings and controlled replacement orders. Office for National Statistics reported in its April 2026 release showcasing production output having increased 1.2% in the three months to February 2026. Factory output recovery reinforces demand for machine components linked to repairs and replacement orders. Adoption in the United Kingdom is predicted to rise at 5.0% CAGR by 2036, driven by repair activity and careful supplier review. Plate suppliers are likely to gain acceptance through low rework exposure and dependable motor-frame proof.
- United States motor adapter plate purchasing is anticipated to be shaped by automotive automation and approved supplier programs. Demand in United States is predicted to scale at 4.8% CAGR during assessment period, reflected by automation investment and cautious supplier changes guide buyer review. International Federation of Robotics reported on May 2025 claiming automotive robot installations in the United States having reached 10.7% to 13,700 units in 2024. Automotive line activity keeps motor-interface accuracy important for motion assemblies and replacement equipment. Suppliers with application support are projected to gain account access once documentation matches plant acceptance checks.
- Germany motor adapter plate demand is projected to reflect machine acceptance testing and documentation-heavy purchasing. Federal Statistical Office of Germany reported in its July 2026 release stating industrial production having increased 0.9% month on month in May 2026. Sales in Germany are expected to grow at 4.4% CAGR during the study period since technical component review and precision machinery needs support orders. German accounts are anticipated to favor suppliers offering drawing traceability and tolerance consistency. Machined plate suppliers are estimated to gain preference once verification files reduce approval delays.
- The market in Japan is expected to reflect compact machinery design and extended qualification cycles. Sector in Japan is projected to expand at 4.1% CAGR during the forecast period, shaped by precision equipment replacement promoting servo mounting needs. Ministry of Economy Trade and Industry reported on June 2026 for Japan's production index being stood at 103.0 in May 2026. Measured factory output keeps replacement hardware qualification focused on accuracy and documentation. Suppliers are likely to progress once motor-interface records match buyer acceptance standards.
Who are the notable companies in the motor adapter plates market?
GAM Enterprises, MISUMI, Thomson Industries, Ruland Manufacturing, Ondrives.US, Stock Drive Products / Sterling Instrument, Stafford Manufacturing, AutomationDirect, Neugart, and WITTENSTEIN alpha are expected to shape demand.
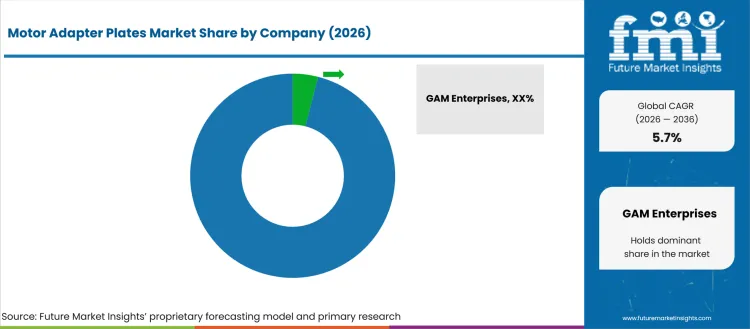
Competition in motor adapter plates is anticipated to center on plate accuracy and replenishment speed. GAM Enterprises and Thomson Industries are expected to receive review attention due to motion component portfolios and motor mounting support. Ruland Manufacturing, Ondrives.US and Stafford Manufacturing are projected to compete led by machined component and precision accessory depth. AutomationDirect and WITTENSTEIN alpha are estimated to support account demand led by channel access and equipment maintenance needs.
- GAM Enterprises and Thomson Industries are expected to gain account attention based on motion component depth and engineering support. MISUMI is set to contribute due to its plate programs benefitting suppliers to connect product proof with delivery certainty.
- Ruland Manufacturing and Stafford Manufacturing are anticipated to compete based on precision accessory knowledge. Ondrives.US and Stock Drive Products / Sterling Instrument compete through coupling and shaft-mounting depth improving buyer confidence during motor-interface review.
- AutomationDirect and Neugart are forecast to support demand led by automation component access and catalog availability. Buyer teams use stocked part options during repair and retrofit cycles.
- WITTENSTEIN alpha is estimated to gain review strength depending on servo gearbox and motion accessory depth. Application support improves once machine builders need consistent replacement hardware.
Competitive Benchmarking: Motor Adapter Plates Market
| Company | Portfolio Depth | Plate Format Match | Application Support | Service Reach |
|---|---|---|---|---|
| GAM Enterprises | High | High | High | Regional/Global |
| MISUMI | High | High | High | Global |
| Thomson Industries | High | Medium | High | Global |
| Ruland Manufacturing | High | Medium | High | Regional/Global |
| Ondrives.US | Medium | High | High | Regional/Global |
| Stock Drive Products / Sterling Instrument | Medium | High | High | Global |
| Stafford Manufacturing | Medium | Medium | High | Regional |
| AutomationDirect | Medium | High | Medium | Regional |
| Neugart | High | High | High | Global |
| WITTENSTEIN alpha | High | High | High | Global |
Source: Future Market Insights competitive analysis, 2026.
Key Developments in the Motor Adapter Plates Market
- In April 2025, MISUMI Group signed an agreement to acquire Fictiv for US$ 350 million. MISUMI stated in April 2025 that Fictiv provides on-demand custom mechanical component services. Sourcing options improve engineering teams needing machined parts and mounting interfaces.
- In May 2025, Ruland Manufacturing acquired RoCom Couplings Corp. RoCom stated in May 2025, reporting Ruland added a custom machined springs and beam couplings business. Motion component coverage improves near motor adapter plates in servo assemblies.
- In December 2025, Union Park Capital's completed acquisition of GAM Enterprises and launch of a precision motion control platform. GAM stated in December 2025 that its portfolio covers high-precision gear reducers alongside couplings and custom motion control solutions. Supplier depth improves automation of customers using motor mounting interfaces.
Key Companies in the Motor Adapter Plates Market
Motion component and equipment suppliers
- GAM Enterprises
- MISUMI
- Thomson Industries
- Neugart
Precision engineering and accessory specialists
- Ruland Manufacturing
- Ondrives.US
- Stock Drive Products / Sterling Instrument
- Stafford Manufacturing
Distribution and application support partners
- AutomationDirect
- WITTENSTEIN alpha
Motor Adapter Plates Market - Report Scope
| Coverage field | Report scope |
|---|---|
| Market breakdown | The motor adapter plates market breakdown by plate type, material, standard, application, sales channel, and region |
| Market Definition | Motor adapter plates are machined or fabricated interface plates designed to connect motors with gearboxes, machine frames, test systems, robotics modules, and retrofit assemblies and preserve alignment and mounting compatibility. |
| Regions Covered | North America, Latin America, Europe, East Asia, South Asia, Oceania, and Middle East and Africa |
| Countries Covered | United States, China, Germany, Japan, India, Mexico, United Kingdom, and 25+ countries |
| Key Companies Profiled | GAM Enterprises, MISUMI, Thomson Industries, Ruland Manufacturing, Ondrives.US, Stock Drive Products / Sterling Instrument, Stafford Manufacturing, AutomationDirect, Neugart, and WITTENSTEIN alpha |
| Forecast Period | 2026 to 2036 |
| Approach | Hybrid bottom-up and top-down methodology using automation component demand, machine builder sourcing, retrofit activity, segment share, country CAGR, direct OEM supply, and country-level industrial equipment indicators. |
Source: Future Market Insights analysis, 2026.
Motor Adapter Plates Market - Research Methodology
| Method | Approach |
|---|---|
| Primary Research | FMI analysts reviewed inputs from machine builders, automation OEMs, maintenance teams, component distributors, and precision equipment manufacturers. Interviews focused on demand triggers, application fit, approval barriers, service ownership, replacement behavior, and limits of supplier switching. |
| Desk Research | Desk research covered company product pages, association references, official industrial statistics, and standards-linked sources. Product fit was checked against automation uptime, machine accuracy, retrofit compatibility, drive protection, and shorter equipment commissioning cycles in motion control programs. |
| Market Sizing and Forecasting | Market sizing used a hybrid top-down and bottom-up model. Inputs included the 2025 backcast and 2026 base value with the 2036 forecast value. Segment-share mix and country CAGRs also informed the model alongside sales channel structure and parent market adjacency. |
| Data Validation | Data validation compares interview findings from motor manufacturers, machinery distributors, automation engineers, and assembly crews against factory automation programs and component availability. Analysts test country-level growth against machine build activity, plate alignment needs, and verified supplier portfolios to exclude unrelated accessory makers. The forecast is then triangulated across new equipment setups, component replacements, and machinery redesign cycles that influence repeat motor adapter plate demand. |
Source: Future Market Insights analysis, 2026.
Motor Adapter Plates Market by Segments
Motor Adapter Plates Market segmented by Plate Type:
- Servo Motor Adapter Plates
- Stepper Motor Adapter Plates
- Gearbox Adapter Plates
- NEMA Conversion Plates
- Custom Machined Plates
Motor Adapter Plates Market segmented by Material:
- Aluminum
- Steel
- Stainless Steel
- Composite / Polymer
- Coated Alloy
Motor Adapter Plates Market segmented by Standard:
- NEMA
- IEC
- JIS
- Proprietary OEM
- Hybrid Frame Standards
Motor Adapter Plates Market segmented by Application:
- Motor-gearbox Coupling
- Machine Retrofitting
- Robotics
- Test Benches
- Compact Automation Modules
Motor Adapter Plates Market segmented by Sales Channel:
- Direct OEM Supply
- Component Distributors
- Online Industrial Platforms
- Machine Builders
- MRO Supply Partners
Motor Adapter Plates Market by Region:
- North America
- United States
- Canada
- Latin America
- Brazil
- Mexico
- Argentina
- Europe
- Germany
- United Kingdom
- France
- Italy
- Spain
- East Asia
- China
- Japan
- South Korea
- South Asia
- India
- Thailand
- Indonesia
- Oceania
- Australia
- New Zealand
- Middle East and Africa
- GCC countries
- South Africa
- Türkiye
Research Sources and Bibliography
- Association for Advancing Automation. (2026, February 6). Robot orders grow 6.6% in 2025 as general industries support automation adoption.
- AutomationDirect. (2026). LARSACC-016 SureMotion motor adapter, NEMA 34 frame.
- Federal Statistical Office of Germany. (2026, July 7). Production in May 2026: +0.9% on the previous month.
- GAM Enterprises. (2025, December 12). Union Park Capital acquires GAM Enterprises.
- International Federation of Robotics. (2025, May 8). Robot installations in US auto industry up 10.7%.
- International Federation of Robotics. (2025, September 25). World Robotics 2025: Industrial robots executive summary.
- International Federation of Robotics. (2025, September 25). India rises to sixth in global factory robot installations.
- Ministry of Economy, Trade and Industry. (2026, June 30). Preliminary report for May 2026: Indices of industrial production.
- MISUMI Group Inc. (2025, April 17). Notice regarding the acquisition of Fictiv Inc.
- MISUMI Group Inc. (2025, November 4). D-JIT: High-volume parts purchasing in the USA and Mexico now available.
- Office for National Statistics. (2026, April 16). Index of production, UK: February 2026.
- RoCom Couplings Corp. (2025, May 2). Ruland Manufacturing acquires RoCom Couplings Corp.
This bibliography is provided for reader reference and is not exhaustive. The full report contains the complete reference list and detailed citations.
This Report Answers
- What segments shape demand across plate type, material, standard, application, and sales channel?
- How do machine builders evaluate motor adapter plates before replacing approved mounting formats?
- How do country CAGRs differ across profiled markets?
- What companies compete based on plate accuracy and motion component support?
- How does FMI validate forecasts using a hybrid bottom-up and top-down approach?
- What factors should account teams address before larger account expansion?
- How do drawing files and tolerance records affect supplier selection?
- What limits return on investment for buyers adding motor adapter plates to equipment programs?
- How do material selection and standard compatibility influence account approval?
- What supplier capabilities improve long-term account confidence?
Frequently Asked Questions
What is supporting demand in the motor adapter plates market?
Demand is likely to be supported by machine builders needing mounting formats to protect alignment during automation builds and retrofit work. Accounts are expected to prefer plates combining drawing accuracy and repeatable installation support.
Who are the notable companies in the motor adapter plates market?
Notable companies are anticipated to include GAM Enterprises, MISUMI, Thomson Industries, Ruland Manufacturing, Ondrives.US, and Neugart. Competition is likely to be based on portfolio depth and application support.
What is a restraint in the motor adapter plates market?
Supplier qualification slows once dimensional evidence or installation documentation falls short of pilot-build expectations across machine builder accounts. Approval delays increase once plate geometry affects motor alignment and service ownership.
Why should executives track the motor adapter plates market?
Executives are expected to track the market as small mounting parts affect machine uptime and commissioning risk. Supplier selection shapes service continuity and repeat equipment delivery.
What business problem does the motor adapter plates market address?
Motor adapter plates address the equipment interface gap between motor frames and driven assemblies during machine upgrades and new automation builds. Machine builders and maintenance teams need adapter plates connecting motors and frames without redesigning complete assemblies.
What should account teams evaluate before selecting suppliers?
Account teams are likely to evaluate tolerance consistency and drawing support before supplier approval. Material finish and channel continuity are expected to guide final supplier review.
What limits return on investment for purchasing teams?
Return on investment weakens if plate geometry or documentation fails before installation. Rework and repeat supplier changes reduce expected sourcing gains.
How do suppliers build long-term account confidence?
Suppliers build account confidence by providing consistent machining quality and fit evidence specific to motor adapter plates. CAD files and responsive application support are expected to influence repeat-order trust.
Preview the report firsthand - request a free sample
Get SampleGet the brochure for pricing and purchase details.
Get PDFTable of Content
- Key Takeaways
- Market Size and CAGR
- Top Growth Driver
- Fastest Growing Segment
- Leading Region
- Key Companies
- Emerging Opportunities
- Executive Summary
- Global Market Outlook
- Demand-side Trends
- Supply-side Trends
- Technology Roadmap Analysis
- Analysis and Recommendations
- Analyst Perspective (What is happening? Why now? What should investors know?)
- Key Questions Answered
- How large is the market?
- What is the CAGR?
- What are key trends?
- Which region dominates?
- Who are the leaders?
- Market Overview
- Market Coverage / Taxonomy
- Market Definition / Scope / Limitations
- Research Methodology
- Chapter Orientation
- Analytical Lens and Working Hypotheses
- Market Structure, Signals, and Trend Drivers
- Benchmarking and Cross-market Comparability
- Market Sizing, Forecasting, and Opportunity Mapping
- Research Design and Evidence Framework
- Desk Research Programme (Secondary Evidence)
- Expert Input and Fieldwork (Primary Evidence)
- Tooling, Models, and Reference Databases
- Data Engineering and Model Build
- Quality Assurance and Audit Trail
- Market Background
- Market Dynamics (Drivers, Restraints, Opportunity, Trends)
- Scenario Forecast (Optimistic, Likely, Conservative)
- Impact Analysis
- AI Impact
- Sustainability Impact
- Regulatory Impact
- Technology Impact
- Consumer / Buyer Analysis
- Purchase Drivers
- Adoption Barriers
- Buyer Journey
- Opportunity Map Analysis
- Product Life Cycle Analysis
- Supply Chain Analysis
- Investment Feasibility Matrix
- Value Chain Analysis
- PESTLE and Porter's Analysis
- Regulatory Landscape
- Regional Parent Market Outlook
- Production and Consumption Statistics
- Import and Export Statistics
- Global Market Analysis and Forecast, 2021 to 2036
- Historical Market Size Value (USD Million) & Volume (Unit) Analysis, 2021 to 2025
- Current and Future Market Size Value (USD Million) & Volume (Unit) Projections, 2026 to 2036
- Y-o-Y Growth Trend Analysis
- Absolute $ Opportunity Analysis
- Global Market Pricing Analysis, 2021 to 2036
- Global Market Analysis and Forecast, By Plate Type, 2021 to 2036
- Introduction / Key Findings
- Historical Market Size Value (USD Million) & Volume (Unit) Analysis By Plate Type, 2021 to 2025
- Current and Future Market Size Value (USD Million) & Volume (Unit) Analysis and Forecast By Plate Type, 2026 to 2036
- Servo Motor Adapter Plates
- Stepper Motor Adapter Plates
- Gearbox Adapter Plates
- NEMA Conversion Plates
- Custom Machined Plates
- Servo Motor Adapter Plates
- Y-o-Y Growth Trend Analysis By Plate Type, 2021 to 2025
- Absolute $ Opportunity Analysis By Plate Type, 2026 to 2036
- Global Market Analysis and Forecast, By Material, 2021 to 2036
- Introduction / Key Findings
- Historical Market Size Value (USD Million) & Volume (Unit) Analysis By Material, 2021 to 2025
- Current and Future Market Size Value (USD Million) & Volume (Unit) Analysis and Forecast By Material, 2026 to 2036
- Aluminum
- Steel
- Stainless Steel
- Composite / Polymer
- Aluminum
- Y-o-Y Growth Trend Analysis By Material, 2021 to 2025
- Absolute $ Opportunity Analysis By Material, 2026 to 2036
- Global Market Analysis and Forecast, By Standard, 2021 to 2036
- Introduction / Key Findings
- Historical Market Size Value (USD Million) & Volume (Unit) Analysis By Standard, 2021 to 2025
- Current and Future Market Size Value (USD Million) & Volume (Unit) Analysis and Forecast By Standard, 2026 to 2036
- NEMA
- IEC
- JIS
- Proprietary OEM
- NEMA
- Y-o-Y Growth Trend Analysis By Standard, 2021 to 2025
- Absolute $ Opportunity Analysis By Standard, 2026 to 2036
- Global Market Analysis and Forecast, By Application, 2021 to 2036
- Introduction / Key Findings
- Historical Market Size Value (USD Million) & Volume (Unit) Analysis By Application, 2021 to 2025
- Current and Future Market Size Value (USD Million) & Volume (Unit) Analysis and Forecast By Application, 2026 to 2036
- Motor-gearbox Coupling
- Machine Retrofitting
- Robotics
- Test Benches
- Motor-gearbox Coupling
- Y-o-Y Growth Trend Analysis By Application, 2021 to 2025
- Absolute $ Opportunity Analysis By Application, 2026 to 2036
- Global Market Analysis and Forecast, By Region, 2021 to 2036
- Introduction
- Historical Market Size Value (USD Million) & Volume (Unit) Analysis By Region, 2021 to 2025
- Current Market Size Value (USD Million) & Volume (Unit) Analysis and Forecast By Region, 2026 to 2036
- North America
- Latin America
- Western Europe
- Eastern Europe
- East Asia
- South Asia and Pacific
- Middle East & Africa
- Market Attractiveness Analysis By Region
- North America Market Analysis and Forecast, By Country, 2021 to 2036
- Historical Market Size Value (USD Million) & Volume (Unit) Trend Analysis By Market Taxonomy, 2021 to 2025
- Market Size Value (USD Million) & Volume (Unit) Forecast By Market Taxonomy, 2026 to 2036
- By Country
- USA
- Canada
- By Plate Type
- By Material
- By Standard
- By Application
- By Country
- Market Attractiveness Analysis
- By Country
- By Plate Type
- By Material
- By Standard
- By Application
- Key Takeaways
- Latin America Market Analysis and Forecast, By Country
- Historical Market Size Value (USD Million) & Volume (Unit) Trend Analysis By Market Taxonomy, 2021 to 2025
- Market Size Value (USD Million) & Volume (Unit) Forecast By Market Taxonomy, 2026 to 2036
- By Country
- Brazil
- Mexico
- Chile
- Rest of Latin America
- By Plate Type
- By Material
- By Standard
- By Application
- By Country
- Market Attractiveness Analysis
- By Country
- By Plate Type
- By Material
- By Standard
- By Application
- Key Takeaways
- Western Europe Market Analysis and Forecast, By Country
- Historical Market Size Value (USD Million) & Volume (Unit) Trend Analysis By Market Taxonomy, 2021 to 2025
- Market Size Value (USD Million) & Volume (Unit) Forecast By Market Taxonomy, 2026 to 2036
- By Country
- Germany
- UK
- Italy
- Spain
- France
- Nordic
- BENELUX
- Rest of Western Europe
- By Plate Type
- By Material
- By Standard
- By Application
- By Country
- Market Attractiveness Analysis
- By Country
- By Plate Type
- By Material
- By Standard
- By Application
- Key Takeaways
- Eastern Europe Market Analysis and Forecast, By Country
- Historical Market Size Value (USD Million) & Volume (Unit) Trend Analysis By Market Taxonomy, 2021 to 2025
- Market Size Value (USD Million) & Volume (Unit) Forecast By Market Taxonomy, 2026 to 2036
- By Country
- Russia
- Poland
- Hungary
- Balkan & Baltic
- Rest of Eastern Europe
- By Plate Type
- By Material
- By Standard
- By Application
- By Country
- Market Attractiveness Analysis
- By Country
- By Plate Type
- By Material
- By Standard
- By Application
- Key Takeaways
- East Asia Market Analysis and Forecast, By Country
- Historical Market Size Value (USD Million) & Volume (Unit) Trend Analysis By Market Taxonomy, 2021 to 2025
- Market Size Value (USD Million) & Volume (Unit) Forecast By Market Taxonomy, 2026 to 2036
- By Country
- China
- Japan
- South Korea
- By Plate Type
- By Material
- By Standard
- By Application
- By Country
- Market Attractiveness Analysis
- By Country
- By Plate Type
- By Material
- By Standard
- By Application
- Key Takeaways
- South Asia and Pacific Market Analysis and Forecast, By Country
- Historical Market Size Value (USD Million) & Volume (Unit) Trend Analysis By Market Taxonomy, 2021 to 2025
- Market Size Value (USD Million) & Volume (Unit) Forecast By Market Taxonomy, 2026 to 2036
- By Country
- India
- ASEAN
- Australia & New Zealand
- Rest of South Asia and Pacific
- By Plate Type
- By Material
- By Standard
- By Application
- By Country
- Market Attractiveness Analysis
- By Country
- By Plate Type
- By Material
- By Standard
- By Application
- Key Takeaways
- Middle East & Africa Market Analysis and Forecast, By Country
- Historical Market Size Value (USD Million) & Volume (Unit) Trend Analysis By Market Taxonomy, 2021 to 2025
- Market Size Value (USD Million) & Volume (Unit) Forecast By Market Taxonomy, 2026 to 2036
- By Country
- Kingdom of Saudi Arabia
- Other GCC Countries
- Türkiye
- South Africa
- Other African Union
- Rest of Middle East & Africa
- By Plate Type
- By Material
- By Standard
- By Application
- By Country
- Market Attractiveness Analysis
- By Country
- By Plate Type
- By Material
- By Standard
- By Application
- Key Takeaways
- Key Countries Market Analysis
- USA
- Pricing Analysis
- Market Share Analysis, 2025
- By Plate Type
- By Material
- By Standard
- By Application
- Canada
- Pricing Analysis
- Market Share Analysis, 2025
- By Plate Type
- By Material
- By Standard
- By Application
- Mexico
- Pricing Analysis
- Market Share Analysis, 2025
- By Plate Type
- By Material
- By Standard
- By Application
- Brazil
- Pricing Analysis
- Market Share Analysis, 2025
- By Plate Type
- By Material
- By Standard
- By Application
- Chile
- Pricing Analysis
- Market Share Analysis, 2025
- By Plate Type
- By Material
- By Standard
- By Application
- Germany
- Pricing Analysis
- Market Share Analysis, 2025
- By Plate Type
- By Material
- By Standard
- By Application
- UK
- Pricing Analysis
- Market Share Analysis, 2025
- By Plate Type
- By Material
- By Standard
- By Application
- Italy
- Pricing Analysis
- Market Share Analysis, 2025
- By Plate Type
- By Material
- By Standard
- By Application
- Spain
- Pricing Analysis
- Market Share Analysis, 2025
- By Plate Type
- By Material
- By Standard
- By Application
- France
- Pricing Analysis
- Market Share Analysis, 2025
- By Plate Type
- By Material
- By Standard
- By Application
- India
- Pricing Analysis
- Market Share Analysis, 2025
- By Plate Type
- By Material
- By Standard
- By Application
- ASEAN
- Pricing Analysis
- Market Share Analysis, 2025
- By Plate Type
- By Material
- By Standard
- By Application
- Australia & New Zealand
- Pricing Analysis
- Market Share Analysis, 2025
- By Plate Type
- By Material
- By Standard
- By Application
- China
- Pricing Analysis
- Market Share Analysis, 2025
- By Plate Type
- By Material
- By Standard
- By Application
- Japan
- Pricing Analysis
- Market Share Analysis, 2025
- By Plate Type
- By Material
- By Standard
- By Application
- South Korea
- Pricing Analysis
- Market Share Analysis, 2025
- By Plate Type
- By Material
- By Standard
- By Application
- Russia
- Pricing Analysis
- Market Share Analysis, 2025
- By Plate Type
- By Material
- By Standard
- By Application
- Poland
- Pricing Analysis
- Market Share Analysis, 2025
- By Plate Type
- By Material
- By Standard
- By Application
- Hungary
- Pricing Analysis
- Market Share Analysis, 2025
- By Plate Type
- By Material
- By Standard
- By Application
- Kingdom of Saudi Arabia
- Pricing Analysis
- Market Share Analysis, 2025
- By Plate Type
- By Material
- By Standard
- By Application
- Türkiye
- Pricing Analysis
- Market Share Analysis, 2025
- By Plate Type
- By Material
- By Standard
- By Application
- South Africa
- Pricing Analysis
- Market Share Analysis, 2025
- By Plate Type
- By Material
- By Standard
- By Application
- USA
- Market Structure Analysis
- Competition Dashboard
- Competition Benchmarking
- Market Share Analysis of Top Players
- By Regional
- By Plate Type
- By Material
- By Standard
- By Application
- Emerging Startups
- Innovation Benchmarking
- Competition Analysis
- Competition Deep Dive
- GAM Enterprises
- Overview
- Product Portfolio
- Profitability by Market Segments (Product/Region/Sales Channel)
- Sales Footprint
- Strategy Overview
- Marketing Strategy
- Product Strategy
- Channel Strategy
- Thomson Industries
- MISUMI
- Ruland Manufacturing
- Ondrives.US
- Stock Drive Products / Sterling Instrument
- Stafford Manufacturing
- AutomationDirect
- B&B Manufacturing
- KHK Gears
- GAM Enterprises
- Case Studies
- Success Stories
- Recent Developments
- Competition Deep Dive
- Assumptions & Acronyms Used


