
- Market Size (2026)
- USD 1,526.0 Mn
- Forecast (2036)
- USD 3,294.5 Mn
- CAGR (2026 to 2036)
- 8.0%
How big is the Multi-Lane Free-Flow Tolling Market in 2026?
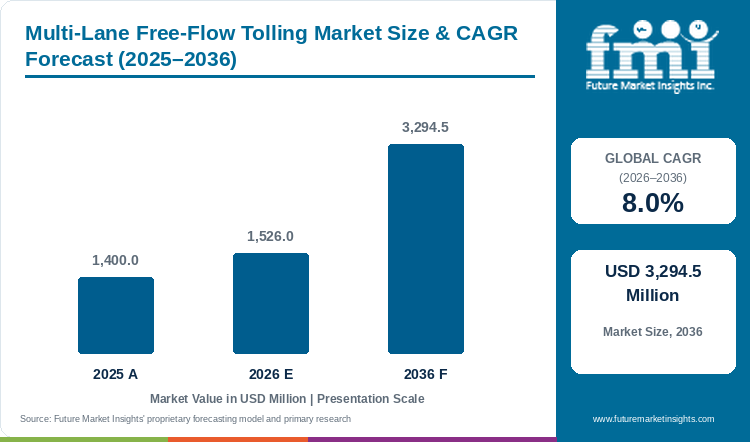
The global multi-lane free-flow tolling market should reach USD 3,294.5 million by 2036 at a 8.0% CAGR across 2026 to 2036. The market was valued at USD 1,400.0 million in 2025, and FMI estimates USD 1,526.0 million for 2026.
Multi-Lane Free-Flow Tolling Market Size and Forecast
Table 1: Multi-Lane Free-Flow Tolling Market Size and Forecast
| Market size and forecast | Value |
|---|---|
| Market size in 2025 | USD 1,400.0 million |
| Estimated market size in 2026 | USD 1,526.0 million |
| Projected market size by 2036 | USD 3,294.5 million |
| CAGR from 2026 to 2036 | 8.0% |
Source: Future Market Insights analysis of the Multi-Lane Free-Flow tolling market, 2026.
Collection continuity is driving a substantial part of the spending. Road authorities need to replace toll plazas while keeping the existing payment relationships intact. India's transport ministry reported in July 2026 that its barrierless programme combined FASTag with number-plate recognition. Seventeen plazas had been awarded and five were live at that point. GPS-based collection remained under further deliberation.
Established operators are also converting functioning roads. TransCore announced completion of the 44-mile Atlantic City Expressway conversion in January 2026. Its assignment includes operation and maintenance after installation. Conduent's October 2025 Richmond award covers image transactions, invoicing and collection through a service model. These contracts support FMI's view that suppliers compete on the revenue collected after commissioning as well as the hardware installed. The broader electronic toll collection market provides wider context.
Key Market Trends & Insights
- Payment accessibility is part of collection design. France gives drivers without a suitable automatic-payment arrangement 72 hours to pay a free-flow toll, and the ministry identifies online and retail payment routes.
- Road network changes require updates to charging records and customer information as well as roadside coverage. Poland's official e-TOLL network map incorporates charged sections effective from February 2026.
- Exception handling is becoming a defined operating feature. Hungary's operator introduced a three-hour alert for suspected unauthorised road use in December 2025.
Regional Highlights
- Share of global revenue grows for India and Saudi Arabia. Projected 2036 shares are India 18.0% (from 12.0%) and Saudi Arabia 4.1% (from 3.0%).
- Global share declines for France, Germany and the United States even as revenue grows. Projected 2036 shares are France 6.3% (from 8.0%), Germany 5.5% (from 7.0%) and the United States 21.0% (from 22.0%).
Analyst Perspective
“The strongest free-flow proposals connect an identifiable vehicle passage to a collectible charge without transferring an unreasonable exception burden to the road operator. Camera performance matters, but so do account matching and the treatment of disputed journeys. Suppliers with credible migration plans and clearly priced continuing service have a stronger basis for recurring business than a low equipment price alone suggests.”
- Sudip Saha, Co-founder, FMI
How is the Multi-Lane Free-Flow Tolling Market segmented?
- By component: Roadside equipment. Back-office software and systems. Operations and maintenance services.
- By technology: Tag-based (RFID and DSRC). Video and number-plate recognition. Satellite and GNSS-based.
- By application setting: Highways and Expressways, Urban Roads, Bridges and Tunnels, and National Truck-Charging Networks.
- By region: North America. Latin America. Western Europe. Eastern Europe. South Asia and Pacific. Middle East and Africa. Rest of world.
Why does the Roadside equipment segment lead by Component in the Multi-Lane Free-Flow Tolling Market in 2026?
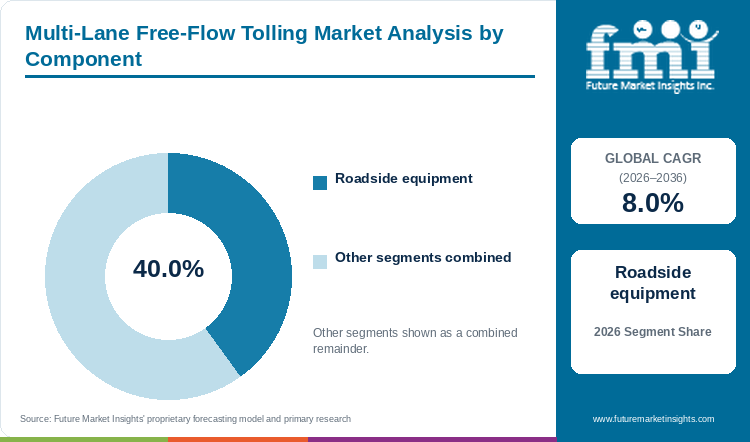
The Roadside equipment segment holds 40.0% of the Multi-Lane Free-Flow Tolling Market by component in 2026.
Conversion projects require a physical collection point that captures a usable record across freely moving lanes. This initial deployment supports equipment's lead. TransCore's August 2026 Selmon Expressway award concerns lifecycle replacement across an 18-mile corridor with 17 toll zones. The announced work includes new roadside equipment on added lanes. A mature road can therefore generate equipment demand through replacement and expansion without adding a new concession.
Equipment suppliers face a changing competitive balance after that initial order. FMI projects a 6.3% CAGR for roadside equipment from 2026 to 2036, below the 9.2% rate for operations and maintenance services. The equipment share consequently declines even though revenue reaches USD 1,119.3 million in 2036.
The commercial opening is to reduce intervention at live collection points. Replacement designs that fit the road's maintenance arrangements and preserve the existing transaction interfaces have value beyond their purchase cost. Conversely, an equipment offer that requires extensive changes to the operator's billing process can lengthen acceptance. Suppliers should distinguish what their installation contract delivers from what will be supported throughout the operating term.
Back-office software and systems and Operations and maintenance services together hold the remaining 60.0% by component.
Table 2: Component, 2026 Share
| Leading Share | 2026 market share |
|---|---|
| Roadside equipment | 40.0% |
| All Other Segments Combined Share | 60.0% |
Source: Future Market Insights analysis of the Multi-Lane Free-Flow tolling market, 2026.
Why does the Video and number-plate recognition segment lead by Technology in the Multi-Lane Free-Flow Tolling Market in 2026?
The Video and number-plate recognition segment holds 42.0% of the Multi-Lane Free-Flow Tolling Market by technology in 2026.
Video collection addresses journeys where the motorist does not present a recognised tag. It also supports systems designed around plate identification. France's ministry describes free-flow gantries that read number plates while retaining automatic payment for correctly mounted compatible tags. Video and tags therefore coexist in an operating system even though this market presents separate revenue classifications.
FMI forecasts video and number-plate recognition revenue to increase from USD 640.9 million to USD 1,535.2 million at a 9.1% CAGR. Tag-based systems remain substantial at USD 959.0 million in 2036. Satellite and GNSS-based systems grow faster at 10.1%, reaching USD 800.3 million.
For video suppliers, the important commercial question is the proportion of passages that proceed to an accepted bill with manageable review effort. A readable image is only one part of that outcome. Plate-to-account matching and payment support connect imaging to collection. The adjacent automated number plate recognition and detection sensors market covers a wider set of applications. Tolling-specific contracts must carry the burden of transaction evidence and dispute support.
Tag-based (RFID and DSRC) and Satellite and GNSS-based together hold the remaining 58.0% by technology.
Table 3: Technology, 2026 Share
| Leading Share | 2026 market share |
|---|---|
| Video and number-plate recognition | 42.0% |
| All Other Segments Combined Share | 58.0% |
Source: Future Market Insights analysis of the Multi-Lane Free-Flow tolling market, 2026.
Why does the Highways and Expressways segment lead by Application Setting in the Multi-Lane Free-Flow Tolling Market in 2026?
The Highways and Expressways segment holds 56.0% of the Multi-Lane Free-Flow Tolling Market by application setting in 2026.
Highways and expressways lead because these corridors already carry the tariff structure, customer accounts and traffic volume that a free-flow conversion can build on. Conversion adds equipment, operation and maintenance to a road that already produces toll revenue.
Urban roads, bridges and tunnels are different projects. They tend to be shorter, add enforcement and access rules specific to a city, and depend on a local authority's charging policy. National truck-charging networks follow a third pattern: a satellite system integrating positioning, mobile communication and enforcement communication does not copy the civil design of a traditional toll plaza. That supports software and service work that moves independently of gantry purchases.
FMI's 2026 assessment values Highways and Expressways at USD 854.6 million. Truck-charging networks would gain share as more countries adopt distance-based charging, since each network needs back-office capacity as well as roadside units. Suppliers should bid corridor conversions and national networks as separate commercial propositions.
Urban Roads, Bridges and Tunnels and National Truck-Charging Networks together hold the remaining 44.0% by application setting.
Table 4: Application Setting, 2026 Share
| Leading Share | 2026 market share |
|---|---|
| Highways and Expressways | 56.0% |
| All Other Segments Combined Share | 44.0% |
Source: Future Market Insights analysis of the Multi-Lane Free-Flow tolling market, 2026.
What are the key drivers restraints and opportunities?
Conversion of functioning toll roads supports deployment, while collection exceptions and migration complexity constrain acceptance. Continuing operating contracts provide a growing opportunity after commissioning.
Driver
Road operators replace barrier collection while retaining chargeable traffic and established customer accounts.
Restraint
A missed or disputed transaction can remain unresolved after a technically successful vehicle detection.
Opportunity
Suppliers can contract for transaction processing and operating support across the life of the system.
How do purchasing rules and qualification affect Multi-Lane Free-Flow tolling market demand?
The conversion of an existing road produces a different order from a new-road installation. The operator already has tariffs and customers. Revenue must continue during the change. The Atlantic City Expressway announcement combines system integration with subsequent maintenance. The value is therefore tied to bringing a working road through conversion with a supportable result. FMI expects this replacement cycle to remain relevant alongside new projects.
National truck-charging networks add another source of demand. CzechToll describes a satellite system integrating positioning, mobile communication and enforcement communication. In such systems, the chargeable road map and operating arrangements can change without copying the civil design of a traditional toll plaza. This supports software and service work that does not move in step with gantry purchases. Suppliers selling through the broader intelligent transportation system market still need a separate case for the tolling revenue they expect to capture. Roadside units that communicate with vehicles are covered in FMI's smart road side unit market.
What limits reliable Multi-Lane Free-Flow tolling market supply and quality?
The principal commercial risk is a mismatch between passage capture and enforceable payment. The World Road Association explains that barrierless collection needs supporting legal and enforcement arrangements. It also distinguishes the extra processing associated with video transactions. A procurement based only on an imaging benchmark can therefore overlook the expense of unidentified or disputed journeys.
Migration adds a second risk. Equipment, road records and commercial accounts do not necessarily change at the same time. Acceptance criteria must address the transfer of chargeable journeys into the new process. A supplier that offers several components under one contract has coordination advantages, but the buyer still needs clear responsibility for failed handoffs. Data access and the ability to maintain transaction records after a supplier change affect the long-term cost of replacement.
Where can suppliers win additional business in the Multi-Lane Free-Flow tolling market?
Operating support is the most visible recurring revenue opening. FMI projects back-office software and systems at USD 882.3 million in 2036, compared with USD 381.5 million in 2026. Operations and maintenance is larger still. Together these categories reward capabilities that keep collection functioning after the public launch.
This opportunity includes genuine separation of roles. SICE distinguishes its operational back office from the commercial back office that handles billing and customer management. Buyers can consequently assess where a proposed supplier assumes responsibility and where an existing contractor remains involved. Independent interface design also creates space for specialist image-processing and account-service firms. The opportunity is strongest when the service solves a defined collection problem instead of merely adding another software layer.
Multi-Lane Free-Flow Tolling Market by Country (2026 to 2036)
Table 5: Multi-Lane Free-Flow Tolling Market Country Growth Forecast
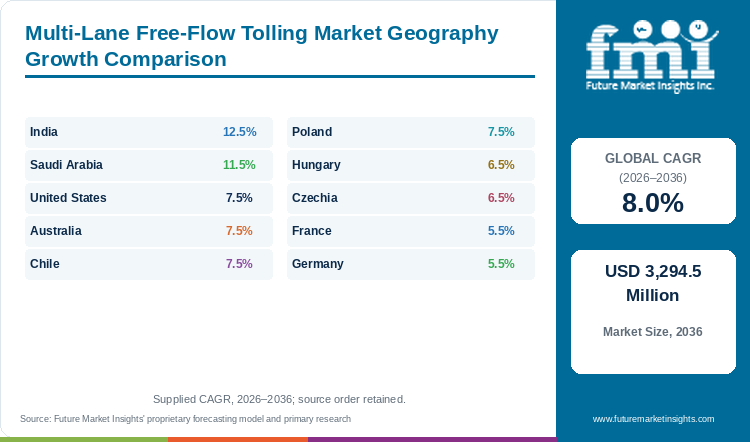
| Country | CAGR, 2026 to 2036 |
|---|---|
| India | 12.5% |
| Saudi Arabia | 11.5% |
| United States | 7.5% |
| Australia | 7.5% |
| Chile | 7.5% |
| Poland | 7.5% |
| Hungary | 6.5% |
| Czechia | 6.5% |
| France | 5.5% |
| Germany | 5.5% |
Source: Future Market Insights analysis of the Multi-Lane Free-Flow tolling market, 2026.
India
India's current programme is being built around the payment infrastructure already in use. The transport ministry's July 2026 statement identifies ANPR with FASTag as the selected barrierless route while GPS-based tolling remained under deliberation. It also distinguishes awarded plazas, live sites and further tenders.
FMI forecasts an increase from USD 183.1 million in 2026 to USD 592.5 million in 2036. India's 12.5% CAGR for 2026 to 2036 is the highest among the individually covered countries. Its revenue share rises from 12.0% to 18.0%, making execution of conversions an important part of the global outlook. India contributes USD 409.4 million of new revenue, first of ten.
The immediate supplier requirement is integration with existing accounts and clearing arrangements. Systems must connect roadside identification to an accepted payment record. This creates work for banks and transaction processors alongside equipment integrators. It also means a camera-only proposition cannot be evaluated as the complete collection solution.
Programme growth will depend on acceptance at successive sites. Local installation support and the handling of unsuccessful charges affect whether one conversion becomes a repeatable contract. Suppliers should price commissioning and the operating period with the same care as equipment. India's opportunity is large, but it is tied to delivered plaza conversions and subsequent collection performance instead of an assumed replacement date for all existing payment technology.
Saudi Arabia
Saudi Arabia requires a different reading from countries with a clearly documented national truck toll or an established free-flow concession network. In July 2025, the Roads General Authority and the National Center for Privatization announced an expression-of-interest process for roadside service stations under a long-term partnership model. This is evidence of private participation in road services.
FMI's Saudi outlook rises from USD 45.8 million in 2026 to USD 135.5 million in 2036. The projected 11.5% CAGR for 2026 to 2036 is a forward market assessment. Its realisation depends on identifiable tolling procurements and implementation decisions, instead of on treating general road investment as equivalent demand. Global revenue attributed to Saudi Arabia is 3.0% in 2026 and 4.1% in 2036. Saudi Arabia contributes USD 89.7 million of new revenue, fourth of ten.
For suppliers, the first commercial task is to establish the charging arrangement a project actually requires. A road delivered through private participation may use a payment structure that does not involve a motorist toll. Equipment demand must therefore be linked to the project's approved charging scope.
Where tolling is specified, local integration and the operating contract will determine the addressable package. Suppliers can prepare partnerships and support capability ahead of tendering, but should avoid counting preparatory discussions as awarded work. FMI sees the country as a potential expansion market with a more conditional project base than the mature tolling countries covered here.
United States
Replacement of established collection infrastructure gives the United States a substantial market before any new road opens. FMI values the country's demand at USD 335.7 million in 2026 and projects USD 690.8 million by 2036. The resulting 7.5% CAGR from 2026 to 2036 reflects continuing system and service spending across an established tolling environment.
The Selmon Expressway award demonstrates the character of this demand. In August 2026, one integrator was selected for a roadside lifecycle replacement covering existing toll zones and equipment on additional lanes. That type of work gives established integrators an advantage when they understand a live road's interfaces. It also allows specialists to compete for defined equipment and processing packages where the authority separates the scope.
The service market is equally relevant. Conduent's Richmond announcement covers image-based processing through collection, with wider implementation planned across additional roads. The purchasing decision is consequently broader than which device detects a car. The authority must decide who holds responsibility for turning a journey into money received and for managing motorists who contest a charge.
FMI sees scope for both incumbent renewals and selective replacement. The constraint for a new entrant is the cost of proving continuity across an existing operation. A low hardware quotation may be insufficient if it shifts integration work to the authority. A practical entry point is a bounded package with an observable collection outcome and a credible transition plan.
Australia
Australia combines continuing operation of established electronic toll roads with additions to existing urban networks. Transurban's FY2026 report records the opening of Melbourne's West Gate Tunnel in December 2025 and the M7 to M12 integration project in June 2026.
The Australian outlook reaches USD 188.4 million in 2036 from USD 91.6 million in 2026. FMI's projected CAGR is 7.5% across 2026 to 2036. New connections and road upgrades support installations while established networks sustain processing and maintenance work. Australia's 7.5% CAGR sits 0.5 points below the global 8.0%.
Integration between a new road and existing customer relationships is a significant commercial issue. An additional route changes journey combinations and the information presented to a motorist. The operator must preserve an intelligible account experience as its network grows. This supports back-office and testing assignments alongside roadside systems.
For a supplier, local operating capability matters over the full term. Maintenance access and the ability to replace components without disrupting collection affect the attractiveness of a technical design. FMI also sees scope for specialist software that fits an operator's existing architecture. A complete replacement is not necessary for every improvement in account management or transaction handling. The purchasing case needs to identify whether the contract concerns a new road, a network interface or continuing support. Each has a different revenue profile and different acceptance obligations.
Chile
The Acceso Sur conversion illustrates Chile's continuing work on existing access routes. The Ministry of Public Works reported inauguration of the new free-flow system in March 2026, following works launched in February 2025 to replace toll booths. The commercial point is the removal of a remaining physical collection interruption within an already functioning road system.
FMI expects Chilean revenue to grow from USD 76.3 million in 2026 to USD 157.0 million in 2036. The 7.5% CAGR from 2026 to 2036 represents technology and service demand. Revenue in Chile climbs by USD 80.7 million, sixth among the ten.
An established tag environment changes the supplier's task. The operator needs a new collection point to work with existing customer arrangements and trip records. This favours bids that address conversion sequencing and continuing support together. It also provides specialist firms with opportunities where a concessionaire buys components or operating functions separately.
FMI's view is that local delivery experience has commercial value when collection points are altered on an operating route. Installing a gantry is not the whole conversion. The transition includes road-user information and the treatment of chargeable passages before and after the change. Suppliers should show how these responsibilities are divided with the concession operator. Chile's growth opportunity is consequently grounded in incremental network conversion and replacement, with service work continuing after the initial construction programme ends.
Poland
Poland's e-TOLL authority identifies approximately 5,870 kilometres in its toll-road network and publishes a map reflecting charged sections effective from February 2026. Network coverage is commercially important because a charged road must be represented consistently in collection, route information and account records. A road-map change is therefore more than an infrastructure announcement for a system provider.
FMI forecasts Polish demand to increase at a 7.5% CAGR over 2026 to 2036. Revenue moves from USD 61.0 million to USD 125.6 million. The market covers the relevant barrierless system and service activity instead of the full value of road construction or the tolls received by the state.
The potential work is distributed across functions. Roadside enforcement equipment supports compliance, while charging software and fleet interfaces reflect the road sections in use. These components need coordination even where a supplier does not deliver the complete system. A firm with a specialist product must show how it exchanges usable records with the other operating parties.
Poland also makes continuing updates commercially relevant. A system designed for the original road map must remain serviceable when the network changes. FMI expects that requirement to favour maintainable interfaces and dependable local support. Suppliers should separate network-extension work from routine operation when presenting their revenue opportunity. The same national programme can generate both kinds of contract, but each carries different delivery and acceptance risks for the vendor.
Hungary
Operating changes create demand in Hungary even when a collection route is already established. In its notice on 2026 toll changes, HU-GO describes distance-based charging for vehicles above 3.5 tonnes and an updated route calculator. The same notice introduced a three-hour warning service for suspected unauthorised road use from December 2025. The warning function is a concrete example of customer support entering the collection process.
Hungarian market revenue is projected at USD 61.0 million in 2026 and USD 114.5 million in 2036. FMI forecasts a 6.5% CAGR for 2026 to 2036. This outlook is compatible with a market where software upkeep and account services can grow alongside selective equipment renewal. From 2026 to 2036, revenue in Hungary rises 1.9 times and global revenue 2.2 times.
The commercial opportunity differs from a wholesale first-time plaza conversion. Carriers need charging information that is consistent with the current road map and vehicle treatment. An error in the information delivered to a fleet can generate support work even when every roadside device is functioning. Suppliers that connect tariff administration with customer-facing tools can address this source of operating cost.
FMI sees demand for systems that make changes auditable and easier to administer. A new tariff should be applied to the correct period without disrupting transaction history. The buyer also needs to retain the ability to explain a charge after rates or rules change. These requirements support continuing service contracts.
Czechia
Czechia offers a clear example of a national toll system that uses satellite positioning within a wider operating arrangement. CzechToll describes hybrid on-board units combining satellite positioning, mobile communications and DSRC for enforcement. Its system was commissioned in December 2019 while the previous system continued operating. The example establishes that free-flow delivery can involve national system migration instead of the construction of individual barrierless plazas.
The Czech market is forecast to grow at a 6.5% CAGR between 2026 and 2036. FMI estimates revenue at USD 61.0 million in 2026 and USD 114.5 million in 2036. The outlook includes relevant technology and services, not the total value of collected road charges.
The supplier implications follow from that architecture. A positioning device alone is not the national charging service. Vehicles must be registered and their journey records must connect to collection and compliance functions. Suppliers that offer one part of the system need a clear relationship with the organisation responsible for overall operation.
FMI expects subsequent spending to focus on continuity as the road network and operating requirements evolve. Replacing an existing service requires preparation that differs from adding one new collection point. The purchasing authority needs confidence that account and journey information will remain usable through the transition. This creates room for specialist support and integration work, but makes unsupported claims of quick national replacement commercially unconvincing.
France
France exposes the commercial consequences of removing a familiar payment barrier. The transport ministry identifies A79 and the A13 to A14 route as free-flow roads. Drivers can use an appropriate toll tag or pay through other channels, including participating retail outlets. The public guidance gives motorists 72 hours to settle a charge. Payment communication is therefore part of the operation instead of an optional marketing expense.
The French market is forecast to expand at a 5.5% CAGR between 2026 and 2036. Revenue increases from USD 122.1 million to USD 208.4 million. This is a measured growth outlook within a concession market where the commercial process must work for occasional drivers as well as frequent account holders. France adds USD 86.3 million, ranking fifth for increase.
For suppliers, that customer mix supports differentiated work in account services and exception management. A toll record must reach someone who can pay it within the required period. The operator's cost also depends on how many transactions require intervention.
FMI expects French procurement to put weight on the total collection process. A supplier that understands how image records enter the commercial account system can compete beyond a camera replacement. Conversely, a road authority has reason to resist an apparently inexpensive conversion if it creates a higher continuing customer-service burden. The relevant market opening is reliable conversion and support under the concession's own payment arrangements.
Germany
Germany's supplier opportunity is shaped by an established truck-charging framework. Toll Collect's current guidance defines relevant domestic and foreign goods vehicles above 3.5 tonnes as subject to toll, with specified legal conditions and exemptions. This gives system providers a rule-driven operating environment. Changes to vehicle eligibility must be reflected correctly in collection and customer records.
FMI projects a 5.5% CAGR for the German market during 2026 to 2036. Revenue advances from USD 106.8 million to USD 182.3 million. The forecast concerns technology and services within the free-flow scope, not the value of the truck toll collected or all spending on Germany's roads. Germany's share of global revenue eases from 7.0% to 5.5%.
The commercial issue is maintaining correct treatment of a diverse vehicle population. A tariff or eligibility change can generate software and account-support work even where the physical collection infrastructure remains in place. This separates Germany's demand pattern from a market whose main task is installing its first barrierless plaza.
Supplier access is also affected by the existing operating arrangements. New equipment must fit within a functioning charge and enforcement process. Components with a short installation cycle may still face a long acceptance process if their outputs influence vehicle classification. FMI therefore sees the opportunity in compatible replacement, software adaptation and dependable support. Providers that demonstrate a narrow product advantage need a clear route into the larger operating system.
Who are the notable companies in the Multi-Lane Free-Flow Tolling Market?
Notable companies in the Multi-Lane Free-Flow Tolling Market include Kapsch TrafficCom, Conduent, TransCore, Indra Sistemas and Q-Free.
Kapsch TrafficCom, TransCore, Indra Sistemas and SICE offer documented tolling integration capabilities. Kapsch describes projects that connect roadside collection with central systems. Indra's portfolio includes free-flow and managed-lane applications. SICE separates roadside, operational and commercial back-office functions. These are useful distinctions for a buyer deciding whether to procure one system contract or several connected packages.
Conduent has a substantial collection-service role. Its pending tolling-business sale to Quarterhill also creates a contract-transition issue that buyers should follow. On 5 November 2026, Conduent still expected the sale to complete by year-end. The sale remained pending as of that update. TransCore is an ST Engineering subsidiary, as identified in its current project announcement.
Q-Free and Neology bring specialised products as well as back-office functions. Egis combines engineering and operational services with free-flow expertise. The European Commission's 2015 electronic-tolling study records Thales as an industry participant. That historical role is distinct from the current MLFF products and projects documented for other firms. Historical participation does not establish an equivalent current system offer. Company scale alone is not a substitute for the particular capabilities and contractual responsibilities offered on a road project.
Key Developments in the Multi-Lane Free-Flow Tolling Market
- In August 2026, TransCore announced its selection for lifecycle replacement on the Selmon Expressway. The work covers existing collection locations and new roadside equipment on added lanes.
- In June 2026, Quarterhill signed an agreement to acquire substantially all assets of Conduent's tolling business. Conduent's November update continued to describe completion as expected by year-end, so the acquisition remains pending in this assessment.
Key Players in the Multi-Lane Free-Flow Tolling Market
- Kapsch TrafficCom
- Conduent
- TransCore
- Indra Sistemas
- Q-Free
- SICE
- Egis
- Thales
- Neology
Multi-Lane Free-Flow Tolling Market Report Scope
Table 6: Multi-Lane Free-Flow Tolling Market Report Scope
| Coverage field | Report scope |
|---|---|
| Market definition | Systems charging vehicles at highway speed without barriers |
| Included products and services | Roadside gantries, sensors, cameras, back-office systems and tolling operations services |
| Exclusions | Toll receipts, general road construction and unrelated traffic or parking systems |
| Quantitative Units | USD million |
| Component coverage | Roadside equipment. Back-office software and systems. Operations and maintenance services |
| Technology coverage | Tag-based (RFID and DSRC). Video and number-plate recognition. Satellite and GNSS-based |
| Application Setting coverage | Highways and Expressways, Urban Roads, Bridges and Tunnels, National Truck-Charging Networks. |
| Country coverage | United States, India, France, Germany, Australia, Chile, Hungary, Poland, Czechia and Saudi Arabia |
| Company coverage | Kapsch TrafficCom, Conduent, TransCore, Indra Sistemas, Q-Free, SICE, Egis, Thales and Neology, with current and former roles distinguished |
Source: Future Market Insights analysis of the Multi-Lane Free-Flow tolling market, 2026.
Multi-Lane Free-Flow Tolling Market Research Methodology
This assessment combines FMI's numerical outlook with secondary review of road-authority publications, operator reporting and original supplier disclosures. The analysis separates system and service revenue from toll receipts, keeps the component, technology and application-setting classifications separate and distinguishes ten country forecasts from the Rest of world aggregate. Competitive statements describe documented roles and the status of announced activity, with historical participation kept separate from current offers.
Multi-Lane Free-Flow Tolling Market by Segments
Multi-Lane Free-Flow Tolling Market segmented by Component:
- Roadside equipment
- Back-office software and systems
- Operations and maintenance services
Multi-Lane Free-Flow Tolling Market segmented by Technology:
- Tag-based (RFID and DSRC)
- Video and number-plate recognition
- Satellite and GNSS-based
Multi-Lane Free-Flow Tolling Market segmented by Application Setting:
- Highways and Expressways
- Urban Roads, Bridges and Tunnels
- National Truck-Charging Networks
Multi-Lane Free-Flow Tolling Market by Region
- North America
- United States
- Latin America
- Chile
- Western Europe
- France
- Germany
- Eastern Europe
- Hungary
- Poland
- Czechia
- South Asia and Pacific
- India
- Australia
- Middle East and Africa
- Saudi Arabia
- Rest of world
Research Sources and Bibliography
- Conduent. (2025, October 7). Richmond Metropolitan Transportation Authority Selects Conduent to Launch Pay-by-Plate Toll System. https://investor.conduent.com/news-releases/news-release-details/richmond-metropolitan-transportation-authority-selects-conduent/
- Conduent. (2026, November 5). Conduent Reports Third Quarter 2026 Results; Reaffirms 2026 Outlook, Bolsters Liquidity Position and Completes Transit Sale. https://investor.conduent.com/news-releases/news-release-details/conduent-reports-third-quarter-2026-results-reaffirms-2026
- CzechToll. (Accessed 2026, November 9). Electronic Toll System. https://www.czechtoll.cz/en/sem/
- Egis. (Accessed 2026, November 9). Smart mobility. https://www.egis-group.com/how-we-help/smart-mobility
- European Commission, Directorate-General for Mobility and Transport. (2015, October). Study on State of the Art of Electronic Road Tolling, MOVE/D3/2014-259. Historical industry-participation reference. https://transport.ec.europa.eu/system/files/2016-09/study-electronic-road-tolling.pdf
- French Ministry responsible for Transport. (2025, October 20 update). Péage en flux libre: pour des trajets plus fluides, plus sereins et plus écologiques. https://www.ecologie.gouv.fr/peage-flux-libre
- HU-GO. (2025, December; accessed 2026, November 9). Toll charge to increase in two stages from 2026. https://www.hu-go.hu/articles/article/toll-charge-to-increase-in-two-stages-from-2026-8
- Indra Group. (Accessed 2026, November 9). Toll systems. https://mobility.indragroup.com/en/solutions-services/toll-systems
- Kapsch TrafficCom. (Accessed 2026, November 9). Tolling: selected tolling and managed-lane projects. https://www.kapsch.net/en/tolling
- Ministerio de Obras Públicas, Chile. (2026, March 9). MOP inaugura puesta en marcha de nuevo sistema Free Flow en Acceso Sur. https://www.mop.gob.cl/mop-inaugura-puesta-en-marcha-de-nuevo-sistema-free-flow-en-acceso-sur-eliminando-barreras-de-peaje-en-entradas-y-salidas-a-la-region-metropolitana/
- Ministry of Road Transport and Highways, India. (2026, July 22). FASTag Based Toll Collection and Digital Tolling System. Press Information Bureau. https://www.pib.gov.in/PressReleasePage.aspx?PRID=2287760
- National Revenue Administration, Poland. (Accessed 2026, November 9). Toll road network, including sections effective from 1 February 2026. https://etoll.gov.pl/en/e-toll-system/toll-road-network/
- Neology. (Accessed 2026, November 9). Tolling System Products and Hardware. https://neology.com/solutions/electronic-toll-collection/tolling-system-products-and-hardware/
- Q-Free. (Accessed 2026, November 9). Product portfolio, including MLFF and Intrada Operational Back Office. https://www.q-free.com/product/
- Quarterhill. (2026, June 30). Quarterhill to Acquire Conduent Tolling Solutions Business. https://ir.quarterhill.com/news/news-details/2026/Quarterhill-to-Acquire-Conduent-Tolling-Solutions-Business/default.aspx
- Saudi Press Agency, reporting Roads General Authority and National Center for Privatization. (2025, July 8). Roads Authority and NCP Launch EOI for One-Stop Station Public-Private Partnership Project. https://www.spa.gov.sa/en/N2354043
- SICE. (Accessed 2026, November 9). Free-Flow Toll. https://www.sice.com/en/free-flow-toll/
- Toll Collect. (Accessed 2026, November 9). Vehicles subject to toll. https://www.toll-collect.de/en/toll_collect/rund_um_die_maut/mautpflichtige_fahrzeuge/mautpflichtige_fahrzeuge.html
- TransCore. (2026, January 20). TransCore and South Jersey Transportation Authority Complete All-Electronic Tolling Conversion on the Atlantic City Expressway. https://transcore.com/transcore-and-south-jersey-transportation-authority-complete-all-electronic-tolling-conversion-on-the-atlantic-city-expressway.html
- TransCore. (2026, August 25). TransCore Selected to Modernize Roadside Toll Collection System for Tampa-Hillsborough Expressway Authority. https://transcore.com/transcore-selected-to-modernize-roadside-toll-collection-system-for-tampa-hillsborough-expressway-authority.html
- Transurban. (2026). Corporate Report 2026, year ended 30 June 2026. https://www.transurban.com/content/dam/investor-centre/04/2026-Corporate-Report.pdf
- World Road Association, PIARC. (Accessed 2026, November 9). Toll Collection. Road Network Operations and Intelligent Transport Systems. https://rno-its.piarc.org/en/user-services-electronic-payment-payment-applications/toll-collection
Table of Content
- Key Takeaways
- Market Size and CAGR
- Top Growth Driver
- Fastest Growing Segment
- Leading Region
- Key Companies
- Emerging Opportunities
- Executive Summary
- Global Market Outlook
- Demand-side Trends
- Supply-side Trends
- Technology Roadmap Analysis
- Analysis and Recommendations
- Analyst Perspective (What is happening? Why now? What should investors know?)
- Key Questions Answered
- How large is the market?
- What is the CAGR?
- What are key trends?
- Which region dominates?
- Who are the leaders?
Read More...
- Market Overview
- Market Coverage / Taxonomy
- Market Definition / Scope / Limitations
- Research Methodology
- Chapter Orientation
- Analytical Lens and Working Hypotheses
- Market Structure, Signals, and Trend Drivers
- Benchmarking and Cross-market Comparability
- Market Sizing, Forecasting, and Opportunity Mapping
- Research Design and Evidence Framework
- Desk Research Programme (Secondary Evidence)
- Expert Input and Fieldwork (Primary Evidence)
- Tooling, Models, and Reference Databases
- Data Engineering and Model Build
- Quality Assurance and Audit Trail
- Market Background
- Market Dynamics (Drivers, Restraints, Opportunity, Trends)
- Scenario Forecast (Optimistic, Likely, Conservative)
- Impact Analysis
- AI Impact
- Sustainability Impact
- Regulatory Impact
- Technology Impact
- Consumer / Buyer Analysis
- Purchase Drivers
- Adoption Barriers
- Buyer Journey
- Opportunity Map Analysis
- Product Life Cycle Analysis
- Supply Chain Analysis
- Investment Feasibility Matrix
- Value Chain Analysis
- PESTLE and Porter's Analysis
- Regulatory Landscape
- Regional Parent Market Outlook
- Production and Consumption Statistics
- Import and Export Statistics
- Global Market Analysis and Forecast, 2021 to 2036
- Historical Market Size Value (USD Million) Analysis, 2021 to 2025
- Current and Future Market Size Value (USD Million) Projections, 2026 to 2036
- Y-o-Y Growth Trend Analysis
- Absolute $ Opportunity Analysis
- Global Market Pricing Analysis, 2021 to 2036
- Global Market Analysis and Forecast, By Component, 2021 to 2036
- Introduction / Key Findings
- Historical Market Size Value (USD Million) Analysis By Component, 2021 to 2025
- Current and Future Market Size Value (USD Million) Analysis and Forecast By Component, 2026 to 2036
- Roadside equipment
- Back-office software and systems
- Operations and maintenance services
- Y-o-Y Growth Trend Analysis By Component, 2021 to 2025
- Absolute $ Opportunity Analysis By Component, 2026 to 2036
- Global Market Analysis and Forecast, By Technology, 2021 to 2036
- Introduction / Key Findings
- Historical Market Size Value (USD Million) Analysis By Technology, 2021 to 2025
- Current and Future Market Size Value (USD Million) Analysis and Forecast By Technology, 2026 to 2036
- Tag-based (RFID and DSRC)
- Video and number-plate recognition
- Satellite and GNSS-based
- Y-o-Y Growth Trend Analysis By Technology, 2021 to 2025
- Absolute $ Opportunity Analysis By Technology, 2026 to 2036
- Global Market Analysis and Forecast, By Application Setting, 2021 to 2036
- Introduction / Key Findings
- Historical Market Size Value (USD Million) Analysis By Application Setting, 2021 to 2025
- Current and Future Market Size Value (USD Million) Analysis and Forecast By Application Setting, 2026 to 2036
- Highways and Expressways
- Urban Roads, Bridges and Tunnels
- National Truck-Charging Networks
- Y-o-Y Growth Trend Analysis By Application Setting, 2021 to 2025
- Absolute $ Opportunity Analysis By Application Setting, 2026 to 2036
- Global Market Analysis and Forecast, By Region, 2021 to 2036
- Introduction
- Historical Market Size Value (USD Million) Analysis By Region, 2021 to 2025
- Current Market Size Value (USD Million) Analysis and Forecast By Region, 2026 to 2036
- North America
- Latin America
- Western Europe
- Eastern Europe
- South Asia and Pacific
- Middle East and Africa
- Market Attractiveness Analysis By Region
- North America Market Analysis and Forecast, By Country, 2021 to 2036
- Historical Market Size Value (USD Million) Trend Analysis By Market Taxonomy, 2021 to 2025
- Market Size Value (USD Million) Forecast By Market Taxonomy, 2026 to 2036
- By Country
- United States
- By Component
- By Technology
- By Application Setting
- By Country
- Market Attractiveness Analysis
- By Country
- By Component
- By Technology
- By Application Setting
- Key Takeaways
- Latin America Market Analysis and Forecast, By Country
- Historical Market Size Value (USD Million) Trend Analysis By Market Taxonomy, 2021 to 2025
- Market Size Value (USD Million) Forecast By Market Taxonomy, 2026 to 2036
- By Country
- Chile
- By Component
- By Technology
- By Application Setting
- By Country
- Market Attractiveness Analysis
- By Country
- By Component
- By Technology
- By Application Setting
- Key Takeaways
- Western Europe Market Analysis and Forecast, By Country
- Historical Market Size Value (USD Million) Trend Analysis By Market Taxonomy, 2021 to 2025
- Market Size Value (USD Million) Forecast By Market Taxonomy, 2026 to 2036
- By Country
- France
- Germany
- By Component
- By Technology
- By Application Setting
- By Country
- Market Attractiveness Analysis
- By Country
- By Component
- By Technology
- By Application Setting
- Key Takeaways
- Eastern Europe Market Analysis and Forecast, By Country
- Historical Market Size Value (USD Million) Trend Analysis By Market Taxonomy, 2021 to 2025
- Market Size Value (USD Million) Forecast By Market Taxonomy, 2026 to 2036
- By Country
- Hungary
- Poland
- Czechia
- By Component
- By Technology
- By Application Setting
- By Country
- Market Attractiveness Analysis
- By Country
- By Component
- By Technology
- By Application Setting
- Key Takeaways
- South Asia and Pacific Market Analysis and Forecast, By Country
- Historical Market Size Value (USD Million) Trend Analysis By Market Taxonomy, 2021 to 2025
- Market Size Value (USD Million) Forecast By Market Taxonomy, 2026 to 2036
- By Country
- India
- Australia
- By Component
- By Technology
- By Application Setting
- By Country
- Market Attractiveness Analysis
- By Country
- By Component
- By Technology
- By Application Setting
- Key Takeaways
- Middle East and Africa Market Analysis and Forecast, By Country
- Historical Market Size Value (USD Million) Trend Analysis By Market Taxonomy, 2021 to 2025
- Market Size Value (USD Million) Forecast By Market Taxonomy, 2026 to 2036
- By Country
- Saudi Arabia
- Rest of world
- By Component
- By Technology
- By Application Setting
- By Country
- Market Attractiveness Analysis
- By Country
- By Component
- By Technology
- By Application Setting
- Key Takeaways
- Key Countries Market Analysis
- United States
- Pricing Analysis
- Market Share Analysis, 2025
- By Component
- By Technology
- By Application Setting
- Chile
- Pricing Analysis
- Market Share Analysis, 2025
- By Component
- By Technology
- By Application Setting
- Germany
- Pricing Analysis
- Market Share Analysis, 2025
- By Component
- By Technology
- By Application Setting
- France
- Pricing Analysis
- Market Share Analysis, 2025
- By Component
- By Technology
- By Application Setting
- India
- Pricing Analysis
- Market Share Analysis, 2025
- By Component
- By Technology
- By Application Setting
- Poland
- Pricing Analysis
- Market Share Analysis, 2025
- By Component
- By Technology
- By Application Setting
- Hungary
- Pricing Analysis
- Market Share Analysis, 2025
- By Component
- By Technology
- By Application Setting
- Saudi Arabia
- Pricing Analysis
- Market Share Analysis, 2025
- By Component
- By Technology
- By Application Setting
- Australia
- Pricing Analysis
- Market Share Analysis, 2025
- By Component
- By Technology
- By Application Setting
- Czechia
- Pricing Analysis
- Market Share Analysis, 2025
- By Component
- By Technology
- By Application Setting
- United States
- Market Structure Analysis
- Competition Dashboard
- Competition Benchmarking
- Market Share Analysis of Top Players
- By Regional
- By Component
- By Technology
- By Application Setting
- Emerging Startups
- Innovation Benchmarking
- Competition Analysis
- Competition Deep Dive
- Kapsch TrafficCom
- Overview
- Product Portfolio
- Profitability by Market Segments
- Sales Footprint
- Strategy Overview
- Marketing Strategy
- Product Strategy
- Channel Strategy
- Conduent
- TransCore
- Indra Sistemas
- Q-Free
- SICE
- Egis
- Thales
- Neology
- Kapsch TrafficCom
- Case Studies
- Success Stories
- Recent Developments
- Competition Deep Dive
- Assumptions & Acronyms Used
List of Tables
- Table 1: Global Market Value (USD Million) Forecast by Region, 2021 to 2036
- Table 2: Global Market Value (USD Million) Forecast by Component, 2021 to 2036
- Table 3: Global Market Value (USD Million) Forecast by Technology, 2021 to 2036
- Table 4: Global Market Value (USD Million) Forecast by Application Setting, 2021 to 2036
- Table 5: North America Market Value (USD Million) Forecast by Country, 2021 to 2036
- Table 6: North America Market Value (USD Million) Forecast by Component, 2021 to 2036
- Table 7: North America Market Value (USD Million) Forecast by Technology, 2021 to 2036
- Table 8: North America Market Value (USD Million) Forecast by Application Setting, 2021 to 2036
- Table 9: Latin America Market Value (USD Million) Forecast by Country, 2021 to 2036
- Table 10: Latin America Market Value (USD Million) Forecast by Component, 2021 to 2036
- Table 11: Latin America Market Value (USD Million) Forecast by Technology, 2021 to 2036
- Table 12: Latin America Market Value (USD Million) Forecast by Application Setting, 2021 to 2036
- Table 13: Western Europe Market Value (USD Million) Forecast by Country, 2021 to 2036
- Table 14: Western Europe Market Value (USD Million) Forecast by Component, 2021 to 2036
- Table 15: Western Europe Market Value (USD Million) Forecast by Technology, 2021 to 2036
- Table 16: Western Europe Market Value (USD Million) Forecast by Application Setting, 2021 to 2036
- Table 17: Eastern Europe Market Value (USD Million) Forecast by Country, 2021 to 2036
- Table 18: Eastern Europe Market Value (USD Million) Forecast by Component, 2021 to 2036
- Table 19: Eastern Europe Market Value (USD Million) Forecast by Technology, 2021 to 2036
- Table 20: Eastern Europe Market Value (USD Million) Forecast by Application Setting, 2021 to 2036
- Table 21: South Asia and Pacific Market Value (USD Million) Forecast by Country, 2021 to 2036
- Table 22: South Asia and Pacific Market Value (USD Million) Forecast by Component, 2021 to 2036
- Table 23: South Asia and Pacific Market Value (USD Million) Forecast by Technology, 2021 to 2036
- Table 24: South Asia and Pacific Market Value (USD Million) Forecast by Application Setting, 2021 to 2036
- Table 25: Middle East and Africa Market Value (USD Million) Forecast by Country, 2021 to 2036
- Table 26: Middle East and Africa Market Value (USD Million) Forecast by Component, 2021 to 2036
- Table 27: Middle East and Africa Market Value (USD Million) Forecast by Technology, 2021 to 2036
- Table 28: Middle East and Africa Market Value (USD Million) Forecast by Application Setting, 2021 to 2036
List of Figures
- Figure 1: Global Market Pricing Analysis
- Figure 2: Global Market Value (USD Million) Forecast 2021-2036
- Figure 3: Global Market Value Share and BPS Analysis by Component, 2026 and 2036
- Figure 4: Global Market Y-o-Y Growth Comparison by Component, 2026-2036
- Figure 5: Global Market Attractiveness Analysis by Component
- Figure 6: Global Market Value Share and BPS Analysis by Technology, 2026 and 2036
- Figure 7: Global Market Y-o-Y Growth Comparison by Technology, 2026-2036
- Figure 8: Global Market Attractiveness Analysis by Technology
- Figure 9: Global Market Value Share and BPS Analysis by Application Setting, 2026 and 2036
- Figure 10: Global Market Y-o-Y Growth Comparison by Application Setting, 2026-2036
- Figure 11: Global Market Attractiveness Analysis by Application Setting
- Figure 12: Global Market Value (USD Million) Share and BPS Analysis by Region, 2026 and 2036
- Figure 13: Global Market Y-o-Y Growth Comparison by Region, 2026-2036
- Figure 14: Global Market Attractiveness Analysis by Region
- Figure 15: North America Market Incremental Dollar Opportunity, 2026-2036
- Figure 16: Latin America Market Incremental Dollar Opportunity, 2026-2036
- Figure 17: Western Europe Market Incremental Dollar Opportunity, 2026-2036
- Figure 18: Eastern Europe Market Incremental Dollar Opportunity, 2026-2036
- Figure 19: South Asia and Pacific Market Incremental Dollar Opportunity, 2026-2036
- Figure 20: Middle East and Africa Market Incremental Dollar Opportunity, 2026-2036
- Figure 21: North America Market Value Share and BPS Analysis by Country, 2026 and 2036
- Figure 22: North America Market Value Share and BPS Analysis by Component, 2026 and 2036
- Figure 23: North America Market Y-o-Y Growth Comparison by Component, 2026-2036
- Figure 24: North America Market Attractiveness Analysis by Component
- Figure 25: North America Market Value Share and BPS Analysis by Technology, 2026 and 2036
- Figure 26: North America Market Y-o-Y Growth Comparison by Technology, 2026-2036
- Figure 27: North America Market Attractiveness Analysis by Technology
- Figure 28: North America Market Value Share and BPS Analysis by Application Setting, 2026 and 2036
- Figure 29: North America Market Y-o-Y Growth Comparison by Application Setting, 2026-2036
- Figure 30: North America Market Attractiveness Analysis by Application Setting
- Figure 31: Latin America Market Value Share and BPS Analysis by Country, 2026 and 2036
- Figure 32: Latin America Market Value Share and BPS Analysis by Component, 2026 and 2036
- Figure 33: Latin America Market Y-o-Y Growth Comparison by Component, 2026-2036
- Figure 34: Latin America Market Attractiveness Analysis by Component
- Figure 35: Latin America Market Value Share and BPS Analysis by Technology, 2026 and 2036
- Figure 36: Latin America Market Y-o-Y Growth Comparison by Technology, 2026-2036
- Figure 37: Latin America Market Attractiveness Analysis by Technology
- Figure 38: Latin America Market Value Share and BPS Analysis by Application Setting, 2026 and 2036
- Figure 39: Latin America Market Y-o-Y Growth Comparison by Application Setting, 2026-2036
- Figure 40: Latin America Market Attractiveness Analysis by Application Setting
- Figure 41: Western Europe Market Value Share and BPS Analysis by Country, 2026 and 2036
- Figure 42: Western Europe Market Value Share and BPS Analysis by Component, 2026 and 2036
- Figure 43: Western Europe Market Y-o-Y Growth Comparison by Component, 2026-2036
- Figure 44: Western Europe Market Attractiveness Analysis by Component
- Figure 45: Western Europe Market Value Share and BPS Analysis by Technology, 2026 and 2036
- Figure 46: Western Europe Market Y-o-Y Growth Comparison by Technology, 2026-2036
- Figure 47: Western Europe Market Attractiveness Analysis by Technology
- Figure 48: Western Europe Market Value Share and BPS Analysis by Application Setting, 2026 and 2036
- Figure 49: Western Europe Market Y-o-Y Growth Comparison by Application Setting, 2026-2036
- Figure 50: Western Europe Market Attractiveness Analysis by Application Setting
- Figure 51: Eastern Europe Market Value Share and BPS Analysis by Country, 2026 and 2036
- Figure 52: Eastern Europe Market Value Share and BPS Analysis by Component, 2026 and 2036
- Figure 53: Eastern Europe Market Y-o-Y Growth Comparison by Component, 2026-2036
- Figure 54: Eastern Europe Market Attractiveness Analysis by Component
- Figure 55: Eastern Europe Market Value Share and BPS Analysis by Technology, 2026 and 2036
- Figure 56: Eastern Europe Market Y-o-Y Growth Comparison by Technology, 2026-2036
- Figure 57: Eastern Europe Market Attractiveness Analysis by Technology
- Figure 58: Eastern Europe Market Value Share and BPS Analysis by Application Setting, 2026 and 2036
- Figure 59: Eastern Europe Market Y-o-Y Growth Comparison by Application Setting, 2026-2036
- Figure 60: Eastern Europe Market Attractiveness Analysis by Application Setting
- Figure 61: South Asia and Pacific Market Value Share and BPS Analysis by Country, 2026 and 2036
- Figure 62: South Asia and Pacific Market Value Share and BPS Analysis by Component, 2026 and 2036
- Figure 63: South Asia and Pacific Market Y-o-Y Growth Comparison by Component, 2026-2036
- Figure 64: South Asia and Pacific Market Attractiveness Analysis by Component
- Figure 65: South Asia and Pacific Market Value Share and BPS Analysis by Technology, 2026 and 2036
- Figure 66: South Asia and Pacific Market Y-o-Y Growth Comparison by Technology, 2026-2036
- Figure 67: South Asia and Pacific Market Attractiveness Analysis by Technology
- Figure 68: South Asia and Pacific Market Value Share and BPS Analysis by Application Setting, 2026 and 2036
- Figure 69: South Asia and Pacific Market Y-o-Y Growth Comparison by Application Setting, 2026-2036
- Figure 70: South Asia and Pacific Market Attractiveness Analysis by Application Setting
- Figure 71: Middle East and Africa Market Value Share and BPS Analysis by Country, 2026 and 2036
- Figure 72: Middle East and Africa Market Value Share and BPS Analysis by Component, 2026 and 2036
- Figure 73: Middle East and Africa Market Y-o-Y Growth Comparison by Component, 2026-2036
- Figure 74: Middle East and Africa Market Attractiveness Analysis by Component
- Figure 75: Middle East and Africa Market Value Share and BPS Analysis by Technology, 2026 and 2036
- Figure 76: Middle East and Africa Market Y-o-Y Growth Comparison by Technology, 2026-2036
- Figure 77: Middle East and Africa Market Attractiveness Analysis by Technology
- Figure 78: Middle East and Africa Market Value Share and BPS Analysis by Application Setting, 2026 and 2036
- Figure 79: Middle East and Africa Market Y-o-Y Growth Comparison by Application Setting, 2026-2036
- Figure 80: Middle East and Africa Market Attractiveness Analysis by Application Setting
- Figure 81: Global Market - Tier Structure Analysis
- Figure 82: Global Market - Company Share Analysis
Frequently Asked Questions
How big is the Multi-Lane Free-Flow tolling market in 2026?
FMI estimates the market at USD 1,526.0 million in 2026, up from USD 1,400.0 million in 2025. It is forecast to reach USD 3,294.5 million by 2036 at a 8.0% CAGR.
Which component leads the Multi-Lane Free-Flow tolling market in 2026?
Roadside equipment leads by component with 40.0% in 2026. All other segments together hold 60.0%.
Which technology and application setting lead in 2026?
Video and number-plate recognition holds 42.0% by technology and Highways and Expressways holds 56.0% by application setting in FMI's 2026 assessment.
Which market is forecast to grow fastest through 2036?
India has the highest forecast CAGR at 12.5% during 2026 to 2036, followed by Saudi Arabia at 11.5%.
Does market value include the tolls paid by motorists?
No. It covers relevant systems, equipment, software and operating services. Toll receipts and general road-construction value are outside the assessment.
Preview the report firsthand - request a free sample
Get SampleGet the brochure for pricing and purchase details.
Get PDF
