The demand for hydrocarbon accounting solutions in the USA is projected to grow from USD 215.1 million in 2025 to USD 357.9 million by 2035, reflecting a CAGR of 5.2%. Hydrocarbon accounting solutions are essential in industries like oil and gas, energy, and utilities, where they enable organizations to track, report, and manage the production, transportation, and consumption of hydrocarbons. The growth of this market is driven by the increasing complexity of the global energy landscape, the rise of digital transformation in the energy sector, and the need for regulatory compliance and financial transparency in hydrocarbon transactions.
The demand for advanced accounting solutions is being driven by the need for real-time data, accurate reporting, and seamless integration of financial, operational, and regulatory requirements in energy companies. The increasing adoption of cloud-based solutions, AI-driven analytics, and automation in energy management will continue to boost the market. Additionally, the growing focus on environmental impact and sustainability is pushing the need for more precise monitoring and accounting of energy resources in the hydrocarbon sector.
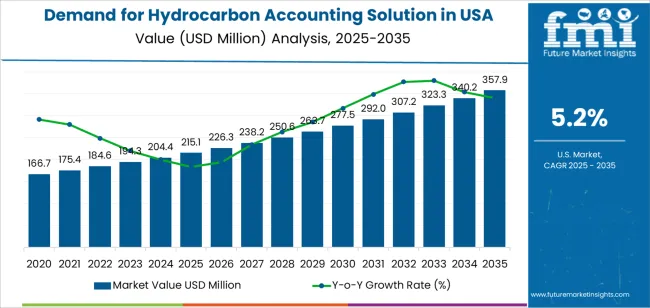
The Growth Rate Volatility Index (GRVI) for hydrocarbon accounting solutions in the USA reveals a moderate volatility in growth patterns over the 2025 to 2035 period, reflecting the cyclical nature of the energy sector, regulatory changes, and technological advancements.
From 2025 to 2030, the market will grow from USD 215.1 million to USD 277.5 million, contributing USD 62.4 million in value. This initial phase shows relatively stable growth, driven by the increasing need for regulatory compliance and financial transparency within the oil and gas sector. However, volatility in this phase may stem from changes in government policies, market demand fluctuations, and the evolving regulatory landscape. The early phase will see moderate volatility as companies adapt to new technologies and adjust to shifts in regulatory requirements.
From 2030 to 2035, the market will grow from USD 277.5 million to USD 357.9 million, adding USD 80.4 million in value. This later period will experience higher stability in growth but still may face periods of fluctuation due to global energy shifts, economic cycles, and advancements in digital technologies. The continued rise in cloud-based accounting solutions and AI-enhanced analytics will provide strong support to the market, reducing volatility toward the later years. However, external factors such as global energy crises, changes in oil prices, and the ongoing transition to renewable energy could still introduce some uncertainty. As the market matures, growth will stabilize, but periodic volatility may arise from market dynamics and technological advancements in the sector.
| Metric | Value |
|---|---|
| Industry Sales Value (2025) | USD 215.1 million |
| Industry Forecast Value (2035) | USD 357.9 million |
| Industry Forecast CAGR (2025-2035) | 5.2% |
The demand for hydrocarbon accounting solutions in the USA is rising as oil and gas companies, midstream operators and refiners seek more accurate, efficient and compliant systems for tracking production, allocation, transportation and revenue. Growing complexity in upstream operations driven by tight oil, offshore developments and LNG projects requires tools that support real time measurement, data reconciliation and audit readiness. In addition, regulatory pressures around emissions, royalties and bookkeeping standards increase the need for integrated accounting platforms rather than spreadsheet based manual systems.
Another key driver is the wider digital transformation of the energy sector which encourages adoption of cloud based accounting software, advanced analytics and asset level audit tools. Operators are implementing these solutions to minimise revenue leakage, optimise supply chain flows and improve decision making across the value chain. Challenges include the significant upfront cost of solution deployment, integration with legacy systems and concerns around data security and ownership. Nonetheless, with North America leading global adoption and USA operators facing strong incentives to modernise data systems, the market for hydrocarbon accounting solutions in the USA is expected to grow consistently.
The demand for hydrocarbon accounting solutions in the USA is primarily driven by solution segment and end-user segment. The leading solution segment is on-premises, which holds 65% of the market share, while oilfield services companies dominate the end-user segment, accounting for 28.7% of the demand. Hydrocarbon accounting solutions are critical for managing and tracking the complex data involved in the exploration, production, transportation, and trading of hydrocarbons. With the increasing complexity of the oil and gas industry and the growing need for real-time, accurate accounting, these solutions continue to see strong demand across various segments.
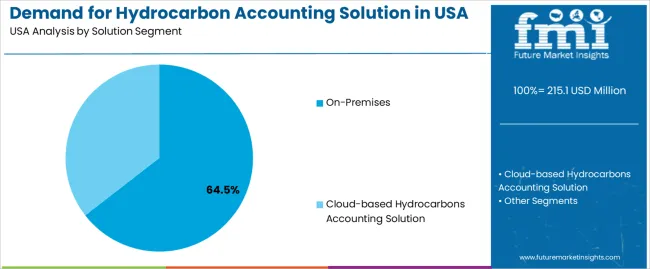
On-premises hydrocarbon accounting solutions lead the market, capturing 65% of the demand in the USA. On-premises solutions are installed locally on an organization's own servers or infrastructure, offering companies full control over their data and systems. These solutions are particularly favored by large oil and gas companies, as they can be customized to meet specific organizational needs and integrate seamlessly with other enterprise resource planning (ERP) systems.
The dominance of on-premises solutions is driven by the high level of security, control, and customization that they offer. In industries like oil and gas, where sensitive financial and operational data is involved, on-premises systems are seen as the more secure option, allowing organizations to keep data within their own networks. Moreover, on-premises solutions are preferred by companies that require heavy customization and integration with existing legacy systems. As the oil and gas industry continues to face complex challenges around data management, the demand for on-premises hydrocarbon accounting solutions remains strong.
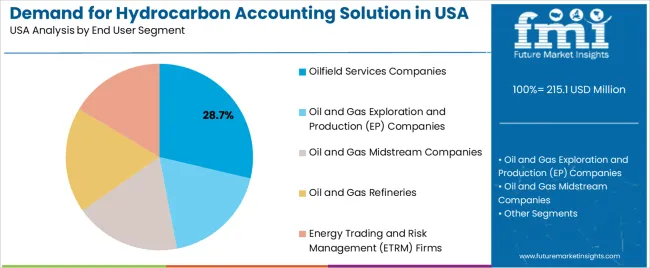
Oilfield services companies represent the largest end-user segment for hydrocarbon accounting solutions, accounting for 28.7% of the market share. These companies provide critical support services to oil and gas exploration, production, and midstream operations, including drilling, well maintenance, and logistics. Hydrocarbon accounting solutions are essential for these companies to manage the large volumes of data related to production levels, transportation, and financial transactions across multiple projects.
The demand from oilfield services companies is driven by their need to track and report hydrocarbon production, ensure compliance with regulatory standards, and optimize financial operations. These companies often operate in highly dynamic environments where accurate, real-time data is critical to making operational decisions and ensuring profitability. As the oil and gas industry continues to grow and diversify, particularly in the exploration and production sectors, the demand for reliable and efficient accounting solutions for hydrocarbon management in oilfield services is expected to remain strong. The need for improved data accuracy and operational transparency further ensures that oilfield services companies will continue to be a key driver of hydrocarbon accounting solution demand in the USA.
Demand for hydrocarbon accounting solutions in the USA is propelled by growing complexity in oil & gas production, midstream operations and regulatory scrutiny around measurement, allocation and reporting of hydrocarbons. Operators require integrated software systems to manage production data, entitlements and joint venture reconciliation across multiple asset types. At the same time, challenges such as legacy system integration, data quality issues and budget constraints act as barriers. Key trends shaping adoption include migration to cloud based platforms, AI driven analytics and real time data visibility across upstream and midstream operations.
Major growth drivers are robust in the USA energy sector. First, increasing production volumes from shale, tight reservoirs and offshore assets induce higher requirement for allocation accuracy and audit ready records. Second, stringent regulatory frameworks and investor demands for transparency push companies to adopt standardized accounting systems rather than spreadsheet based workflows. Third, cost optimisation pressures lead operators to invest in solutions that reduce manual errors, improve reconciliation speed and enable better revenue recovery. Fourth, digital transformation initiatives across oil, gas and pipeline companies elevate demand for integrated software that connects SCADA, ERP and accounting workflows.
Despite strong demand, several constraints persist in the USA market. Integration of new accounting systems with legacy infrastructure and field data capture (SCADA, sensors) can be complex, time consuming and costly. Data quality and standardisation concerns, such as inconsistent measurement data, disparate joint venture reporting practices and reconciliation disputes, can limit system effectiveness. Budget cycles and capital allocation within oil & gas companies may delay investment in accounting software. Moreover, the market is relatively mature, so incremental growth is driven more by upgrades and replacement rather than green field deployments.
Emerging trends in the USA include increasing adoption of cloud native hydrocarbon accounting platforms, enabling remote access, scalability and lower upfront costs compared to on premises systems. Artificial intelligence and machine learning modules are being embedded for anomaly detection, predictive reconciliation and automated audits. The convergence of hydrocarbon accounting with ESG and emission monitoring systems is gaining traction, driven by demand for integrated reporting frameworks across production, allocation and environmental metrics. Also, modular "plug and play" solutions tailored for midstream companies, such as pipelines and terminals, are opening new adoption vectors beyond traditional upstream operators.
The demand for hydrocarbon accounting solutions in the USA is growing as oil and gas companies increasingly seek robust digital tools to manage upstream and midstream operations more efficiently. These solutions provide capabilities such as data integration, production tracking, royalty management, regulatory compliance and real time operational analytics. As regulators tighten reporting requirements, and companies face the pressures of optimizing production and reducing carbon emissions, the need for advanced hydrocarbon accounting systems has become crucial.
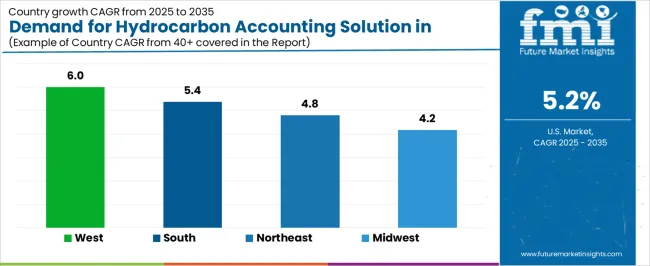
Regional variation in demand is influenced by the presence of oil & gas operations, regulatory environments, and industry maturity. The West region leads due to its strong energy industry infrastructure and technological adoption, while the South, Northeast, and Midwest show consistent growth supported by production, processing and pipeline activities. This analysis explores regional drivers for hydrocarbon accounting solution uptake across the USA.
| Region | CAGR (2025-2035) |
|---|---|
| West | 6% |
| South | 5.4% |
| Northeast | 4.8% |
| Midwest | 4.2% |
The West region leads the USA in demand for hydrocarbon accounting solutions with a CAGR of 6.0%. Many states in the West such as California, Colorado, Utah and Wyoming have significant oil & gas production and midstream infrastructure. Energy companies in this region are under increasing regulatory pressure to report accurately on production volumes, royalty disbursements and emissions. As a result, they are turning to advanced hydrocarbon accounting software to integrate data across wells, pipelines and processing facilities, streamline reporting and enhance operational transparency.
Moreover, the West is known for faster technology adoption, including digital oil field initiatives, cloud computing and analytics for upstream operations. The demand for real time dashboards, automated workflows and integrated data systems encourages deployment of hydrocarbon accounting solutions. With companies striving to optimise production, improve fiscal performance and comply with environmental and financial regulations, the West is at the forefront of solution adoption in this area.
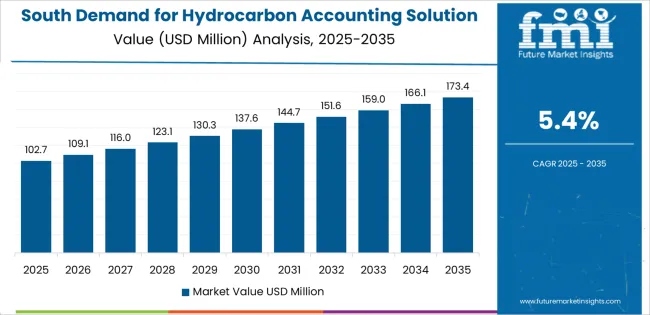
The South region shows strong demand for hydrocarbon accounting solutions with a CAGR of 5.4%. Many Southern states especially Texas, Louisiana, Oklahoma and Arkansas are major hubs for oil & gas extraction, refining, pipeline and petrochemical processing operations. These activities generate large volumes of hydrocarbon data that need to be accounted for, from wellhead production to sales, royalties and regulatory filings. The complexity of operations, combined with regulatory scrutiny and the need for cost control, increases reliance on hydrocarbon accounting solutions.
Additionally, the South’s energy companies are increasingly focusing on digital transformation, operational efficiency and reducing fiscal risk. This drives the uptake of software that can standardise processes, ensure data integrity and provide visibility across the supply chain. As regulatory requirements tighten and companies seek to reduce compliance and production losses, the South will continue to be a major growth region for hydrocarbon accounting solutions.
The Northeast region demonstrates steady demand for hydrocarbon accounting solutions with a CAGR of 4.8%. Although the region is not as heavily oil dependent as the West or the South, it still houses significant midstream, refining and pipeline operations, especially in states like Pennsylvania and New York. These operations require robust accounting systems to track feedstock, refine product outputs, comply with state and federal reporting and manage fiscal flows.
The Northeast also has a strong regulatory environment and numerous energy industry service companies that demand reliable accounting solutions. As companies in the region upgrade legacy systems and move toward digital integration, demand for hydrocarbon accounting software is growing steadily. The region’s emphasis on compliance, efficiency and data transparency supports ongoing adoption of these solutions.
The Midwest region shows moderate growth in hydrocarbon accounting solution demand with a CAGR of 4.2%. The Midwest includes states like Illinois, Michigan, Ohio and Indiana that host oil & gas production, pipeline networks and refining operations. These operations require accurate tracking of hydrocarbon volumes, fiscal flows and regulatory reporting, which fuels demand for dedicated accounting systems.
While the energy infrastructure in the Midwest is less expansive than in the West or South, companies in the region are increasingly focused on operational optimization and cost control. The adoption of modern accounting and data management tools is growing as firms seek to identify losses, improve throughput and meet regulatory demands. As digital adoption becomes more widespread and energy companies update their technology stacks, the Midwest will continue to see steady demand for hydrocarbon accounting solutions.
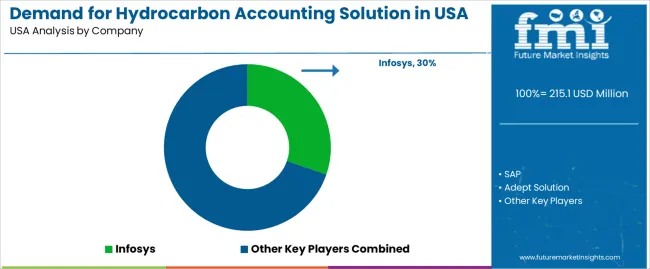
Demand for hydrocarbon accounting solutions in the United States is growing as the energy sector increasingly focuses on improving financial and operational efficiencies. Companies like Infosys (holding approximately 30.3% market share), SAP, Adept Solution, P2 Energy Solution, and Tieto are key players in this industry. Hydrocarbon accounting solutions are essential for managing complex data related to the extraction, transportation, and processing of oil and gas resources, and they help companies comply with regulatory requirements, optimize production processes, and enhance financial reporting accuracy.
Competition in the hydrocarbon accounting solution industry is driven by system integration, scalability, and the ability to handle large volumes of data in real time. Companies focus on offering comprehensive solutions that integrate with other enterprise resource planning (ERP) systems and financial software to provide a seamless experience for energy companies. Another key area of competition is advanced data analytics, as firms are developing solutions that not only track and report on production and financials but also provide insights for decision-making and operational improvements.
Marketing materials typically highlight key features such as multi-currency support, reporting flexibility, regulatory compliance, and system security. By aligning their products with the growing need for more efficient, accurate, and integrated accounting systems in the USA energy sector, these companies aim to capture a larger share of the hydrocarbon accounting solutions market.
| Items | Details |
|---|---|
| Quantitative Units | USD Million |
| Regions Covered | USA |
| Solution Segment | On-Premises, Cloud-based Hydrocarbons Accounting Solution |
| End User Segment | Oilfield Services Companies, Oil and Gas Exploration and Production (EP) Companies, Oil and Gas Midstream Companies, Oil and Gas Refineries, Energy Trading and Risk Management (ETRM) Firms |
| Key Companies Profiled | Infosys, SAP, Adept Solution, P2 Energy Solution, Tieto |
| Additional Attributes | The market analysis includes dollar sales by solution segment and end-user segment categories. It also covers regional demand trends in the United States, particularly driven by the growing need for efficient and accurate hydrocarbon accounting in oil and gas industries. The competitive landscape highlights key software providers focusing on on-premises and cloud-based solutions. Trends in the growing adoption of cloud technologies and the integration of advanced analytics in hydrocarbon accounting are explored, along with innovations in energy trading and risk management systems. |
The global demand for hydrocarbon accounting solution in USA is estimated to be valued at USD 215.1 million in 2025.
The market size for the demand for hydrocarbon accounting solution in USA is projected to reach USD 357.9 million by 2035.
The demand for hydrocarbon accounting solution in USA is expected to grow at a 5.2% CAGR between 2025 and 2035.
The key product types in demand for hydrocarbon accounting solution in USA are on-premises and cloud-based hydrocarbons accounting solution.
In terms of end user segment, oilfield services companies segment to command 28.7% share in the demand for hydrocarbon accounting solution in USA in 2025.


Our Research Products

The "Full Research Suite" delivers actionable market intel, deep dives on markets or technologies, so clients act faster, cut risk, and unlock growth.

The Leaderboard benchmarks and ranks top vendors, classifying them as Established Leaders, Leading Challengers, or Disruptors & Challengers.

Locates where complements amplify value and substitutes erode it, forecasting net impact by horizon

We deliver granular, decision-grade intel: market sizing, 5-year forecasts, pricing, adoption, usage, revenue, and operational KPIs—plus competitor tracking, regulation, and value chains—across 60 countries broadly.

Spot the shifts before they hit your P&L. We track inflection points, adoption curves, pricing moves, and ecosystem plays to show where demand is heading, why it is changing, and what to do next across high-growth markets and disruptive tech

Real-time reads of user behavior. We track shifting priorities, perceptions of today’s and next-gen services, and provider experience, then pace how fast tech moves from trial to adoption, blending buyer, consumer, and channel inputs with social signals (#WhySwitch, #UX).

Partner with our analyst team to build a custom report designed around your business priorities. From analysing market trends to assessing competitors or crafting bespoke datasets, we tailor insights to your needs.
Supplier Intelligence
Discovery & Profiling
Capacity & Footprint
Performance & Risk
Compliance & Governance
Commercial Readiness
Who Supplies Whom
Scorecards & Shortlists
Playbooks & Docs
Category Intelligence
Definition & Scope
Demand & Use Cases
Cost Drivers
Market Structure
Supply Chain Map
Trade & Policy
Operating Norms
Deliverables
Buyer Intelligence
Account Basics
Spend & Scope
Procurement Model
Vendor Requirements
Terms & Policies
Entry Strategy
Pain Points & Triggers
Outputs
Pricing Analysis
Benchmarks
Trends
Should-Cost
Indexation
Landed Cost
Commercial Terms
Deliverables
Brand Analysis
Positioning & Value Prop
Share & Presence
Customer Evidence
Go-to-Market
Digital & Reputation
Compliance & Trust
KPIs & Gaps
Outputs
Full Research Suite comprises of:
Market outlook & trends analysis
Interviews & case studies
Strategic recommendations
Vendor profiles & capabilities analysis
5-year forecasts
8 regions and 60+ country-level data splits
Market segment data splits
12 months of continuous data updates
DELIVERED AS:
PDF EXCEL ONLINE
Demand Side Management Market Size and Share Forecast Outlook 2025 to 2035
Demand Response Market Analysis - Size, Share, and Forecast Outlook 2025 to 2035
North America Shipping Supplies Market Trends – Innovations & Growth 2024-2034
Demand of Kozani Saffron in Greece Analysis - Size, Share & Forecast 2025 to 2035
Demand of No-acid Whey Strained Dairy Processing Concepts in European Union Size and Share Forecast Outlook 2025 to 2035
Demand for Bronte Pistachio in Italy Analysis - Size, Share & Forecast 2025 to 2035
Demand and Trend Analysis of Gaming Monitor in Western Europe Size and Share Forecast Outlook 2025 to 2035
Demand and Trend Analysis of Gaming Monitor in Japan Size and Share Forecast Outlook 2025 to 2035
Demand and Trend Analysis of Gaming Monitor in Korea Size and Share Forecast Outlook 2025 to 2035
Glycine Soja (Soybean) Seed Extract Market Size and Share Forecast Outlook 2025 to 2035
Demand and Trend Analysis of Yeast in Japan - Size, Share, and Forecast Outlook 2025 to 2035
Demand and Trends Analysis of Stevia in Japan Size and Share Forecast Outlook 2025 to 2035
Demand of Pistachio-based desserts & ingredients in France Analysis - Size, Share & Forecast 2025 to 2035
Japan Women’s Intimate Care Market Trends – Growth & Forecast 2024-2034
Western Europe Men’s Skincare Market Analysis – Forecast 2023-2033
Demand and Trend Analysis of Fabric Stain Remover in Korea Size and Share Forecast Outlook 2025 to 2035
Demand and Sales Analysis of Paper Cup in Japan Size and Share Forecast Outlook 2025 to 2035
Demand and Sales Analysis of Paper Cup in Korea Size and Share Forecast Outlook 2025 to 2035
Demand and Sales Analysis of Paper Cup in Western Europe Size and Share Forecast Outlook 2025 to 2035
Demand of MFGM-enriched Powders & RTDs in European Union Size and Share Forecast Outlook 2025 to 2035

Thank you!
You will receive an email from our Business Development Manager. Please be sure to check your SPAM/JUNK folder too.
Chat With
MaRIA