NAD Precursor Supplements Market Size and Share Forecast Outlook 2025 to 2035

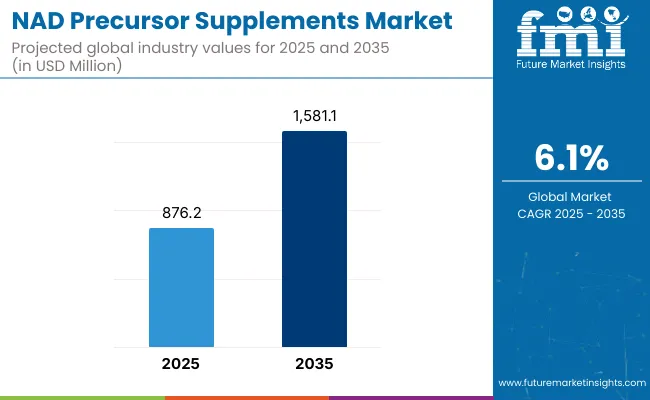
The NAD Precursor Supplements Market is poised to expand significantly, growing from USD 876.2 million in 2025 to an estimated USD 1,581.1 million by 2035. This growth is driven by rising demand in both mainstream and emerging longevity markets, with a projected compound annual growth rate (CAGR) of 6.1%.
Quick Stats for NAD Precursor Supplements Market

  • NAD Precursor Supplements Market Value (2025): USD 876.2 million
  • NAD Precursor Supplements Market Forecast Value (2035): USD 1,581.1 million
  • NAD Precursor Supplements Market Forecast CAGR (2025 to 2035): 6.1%
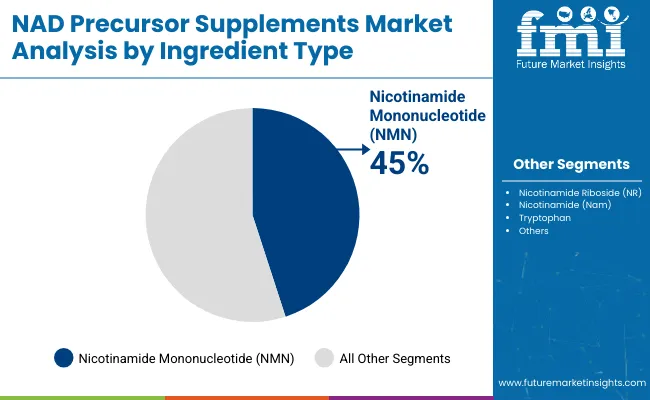
  • Leading Segment in NAD Market in 2025: NMN (45%)
  • Key Growth Regions in the NAD Market: North America, Asia-Pacific, Western Europe
  • Top Key Players in the NAD Market: ChromaDex Inc. (TruNiagen®), Elysium Health, ProHealth Longevity, Do Not Age Ltd., Effepharm Ltd. (Uthever®), Renue By Science, Alive By Science, Wonderfeel, GeneHarbor Biotech, Herbalmax

Nad Precursor Supplements Market

NAD Precursor Supplements Market Key Takeaways

Metric Value
Market Estimated Value in (2025E) USD 876.2 million
Market Forecast Value in (2035F) USD 1,581.1 million
Forecast CAGR (2025 to 2035) 6.1%

During the first half of the forecast period (2025-2030), the market is expected to rise from USD 876.2 million to approximately USD 1,174.5 million, contributing 42% of the decade's total growth. This growth is likely to be driven by rising awareness of cellular health and age-related metabolic decline, particularly among early adopters in North America and select Asia-Pacific countries. Scientific validation of NAD+’s role in energy metabolism and mitochondrial function has been instrumental in influencing clinical interest and supplement demand.

Between 2030 and 2035, a sharper acceleration is projected, with the market forecasted to grow by nearly USD 406.6 million, accounting for 58% of total decade gains. The latter period is expected to witness widespread adoption across mainstream wellness categories, supported by personalized nutrition platforms, precision supplement delivery systems, and pharmaceutical convergence. Premium formulations featuring NMN and NR compounds are expected to dominate the innovation pipeline, while digital health ecosystems are projected to enhance consumer engagement and retention.

From 2020 to 2024, the NAD Precursor Supplements Market expanded from a niche segment into a maturing global wellness category, driven by NMN and NR adoption among aging populations and biohacking communities.

During this phase, product formulations were largely dominated by ingredient-centric players, with companies like ChromaDex and Elysium Health accounting for nearly 20-30% of the global revenue. Competitive positioning was influenced by clinical study credibility, regulatory approvals, and retail expansion through DTC and e-commerce platforms. Service-layer integration remained limited, and recurring revenue was mostly confined to subscription-based delivery models.

By 2025, demand is expected to reach USD 876.2 million, with a strategic shift anticipated toward AI-personalized dosing, biomarker-driven diagnostics, and longevity protocol bundling. Revenue mix is projected to evolve as personalized platforms and digital wellness ecosystems contribute a growing share, challenging product-only brands.

As hybrid clinical-wellness models emerge, leading players are expected to expand into data services, diagnostics partnerships, and app-based wellness tracking. The competitive edge is migrating from ingredient purity alone to bioavailability innovation, clinical validation, and ecosystem strength across preventive health channels.

Why the NAD Precursor Supplements Market is growing?

The NAD Precursor Supplements Market is being driven by a convergence of clinical research breakthroughs, demographic shifts, and increasing consumer awareness surrounding cellular health. Advances in biochemical studies have highlighted the pivotal role of NAD+ in mitochondrial function, DNA repair, and metabolic regulation, prompting heightened interest in supplementation. Aging populations across developed regions have been identified as key consumer segments, with demand being accelerated by the rise of preventive health practices.

Greater accessibility to NAD precursors such as NMN (Nicotinamide Mononucleotide) and NR (Nicotinamide Riboside) has been enabled by regulatory clarity and favorable e-commerce expansion. Personalized wellness platforms are being utilized to match supplementation with genetic predispositions and lifestyle indicators. Strategic endorsements by biohacking communities and longevity-focused influencers have also amplified consumer interest.

Over the next decade, growth is expected to be supported by clinical-grade product development, cross-sector collaborations with pharmaceutical players, and robust retail integration across both online and offline health channels.

Segmental Analysis

The NAD Precursor Supplements Market has been segmented by ingredient type, health function, product format, application, sales channel, and region, offering a multidimensional perspective on demand shifts and innovation trends. Ingredient segmentation emphasizes biologically active NAD+ boosters, such as NMN, NR, and other precursor blends, which are being leveraged to target core cellular repair pathways. The health function classification identifies targeted physiological benefits ranging from cognitive vitality to mitochondrial function and metabolic balance.

Product formats span from traditional oral forms like capsules and tablets to newer delivery platforms such as functional beverages and sublingual lozenges, each catering to specific user preferences and bioavailability goals. Regionally, differentiated adoption curves are being observed across North America, Europe, East Asia, and emerging economies, reflecting variable consumer awareness and regulatory landscapes.
Insights into the Ingredient Type Segment with Nicotinamide Mononucleotide (NMN) Leading in Market Share

Nad Precursor Supplements Market By Ingrediant

Ingredient Type Market Share 2025 (%)
Nicotinamide Mononucleotide (NMN) 45.0%
Nicotinamide Riboside (NR) 28.0%
Nicotinamide (Nam) 12.0%
Tryptophan 5.0%
Other Precursors / Blends 10.0%

The NMN segment is projected to account for 45% of total NAD Precursor Supplements Market revenue in 2025, sustaining its dominance across the ingredient landscape. Its leadership is being driven by peer-reviewed clinical data supporting its NAD+ boosting efficacy, especially in age-related decline reversal and metabolic rejuvenation. The segment's growth has been underpinned by robust consumer demand for advanced anti-aging interventions, particularly within the premium nutraceutical category.

NMN-based formulations have been positioned as superior alternatives due to their rapid conversion to NAD+, supported by improved bioavailability in encapsulated or sublingual forms. As regulatory pathways are being clarified and clinical trials progress globally, NMN is expected to remain the flagship compound within the ingredient segment, with partnerships between biotech firms and supplement brands reinforcing commercial scalability.
Insights into the Health Function Segment with Healthy Aging & LongevityDominating the Demand

Nad Precursor Supplements Market By Health

Health Function Market Share (%)
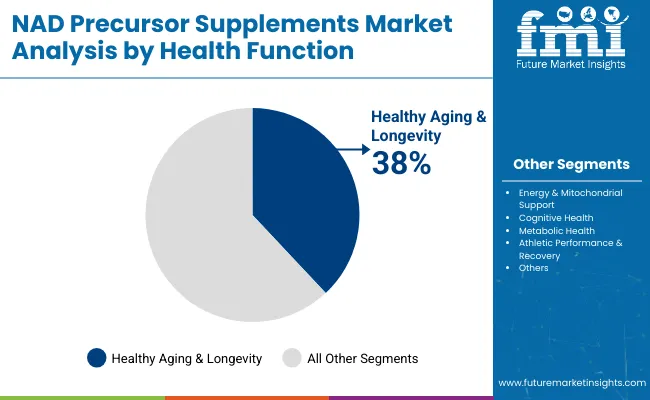
Healthy Aging & Longevity 38.0%
Energy & Mitochondrial Support 22.0%
Cognitive Health 15.0%
Metabolic Health 15.0%
Athletic Performance & Recovery 10.0%

The Healthy Aging & Longevity segment is expected to command 38% of total market revenue by 2025, supported by growing consumer prioritization of lifespan and healthspan optimization. This trend has been catalyzed by increased public engagement with aging science, and amplified through the advocacy of geroscience researchers and wellness influencers.

NAD precursor supplements have been prominently positioned within this movement, with NMN and NR being favored for their cellular energy restoration and sirtuin activation potential. Demand within this segment has also been boosted by the proliferation of biohacking communities and personalized longevity platforms that recommend NAD-enhancing protocols. As aging populations increase in both developed and developing nations, sustained interest in NAD-centric health functions is forecasted to drive long-term growth within this category.
Insights into the Product Format Segment with Focus on Capsules

Nad Precursor Supplements Market By Product

Product Format Market Share (%)
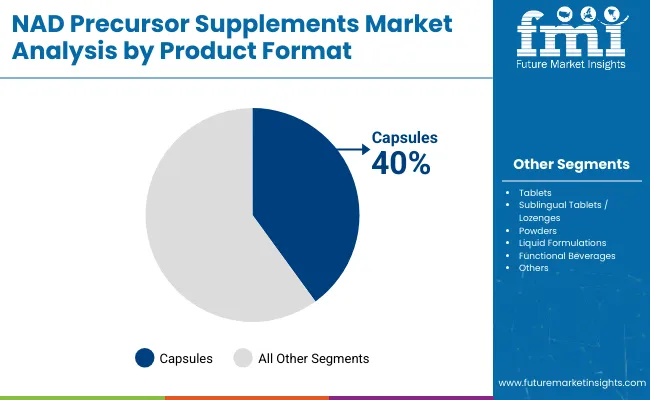
Capsules 40.0%
Tablets 18.0%
Sublingual Tablets / Lozenges 10.0%
Powders 12.0%
Liquid Formulations 10.0%
Functional Beverages 10.0%

The capsules segment is anticipated to lead with 40% of total market share in 2025, driven by consumer preference for familiarity, ease of dosage, and stable shelf-life. Capsule-based formulations have been widely adopted by both direct-to-consumer supplement brands and pharmacy-backed nutraceutical lines, owing to manufacturing scalability and established regulatory pathways.

Innovation in encapsulation technologies particularly sustained release and liposomal delivery has enhanced the absorption profile of NAD precursors, reinforcing capsules' market dominance. As awareness around ingredient purity and traceability continues to grow, capsule formulations are being positioned as premium-grade delivery systems. Their convenience and perceived efficacy are expected to ensure continued leadership across the product format segment, especially among older adult demographics and wellness enthusiasts.

What are the Drivers, Restraints, and Key Trends of the NAD Precursor Supplements Market?

Complexities surrounding clinical validation and product standardization continue to hinder broader adoption, despite rising consumer interest in proactive aging and mitochondrial health. Meanwhile, scientific awareness and health tech integration are accelerating the appeal of NAD precursors across nutraceutical and biohacking domains.

Accelerated Research in Aging and Metabolism

Market expansion is being fueled by the acceleration of scientific research on the role of NAD+ in aging, mitochondrial dysfunction, and chronic disease mitigation. Evidence linking NAD+ depletion to neurodegeneration, metabolic decline, and inflammation has strengthened the therapeutic potential of NAD precursors.

Academic institutions, biotech firms, and pharmaceutical players have been increasingly engaged in preclinical and clinical investigations surrounding NMN and NR compounds. As longevity science gains mainstream traction, funding for translational studies is expected to rise, providing greater legitimacy and consumer trust. This driver is set to reinforce long-term market credibility and innovation.

Convergence of NAD Supplements with Digital Health Platforms

A growing trend has been observed wherein NAD precursor supplements are being integrated into digital health ecosystems, including personalized supplement protocols and biomarker-tracking applications. Wearable-linked platforms and wellness diagnostics are increasingly incorporating NAD+ optimization as part of broader cellular health scoring systems.

This convergence is enabling real-time feedback and precision dosing, thereby improving user engagement and supplement adherence. As consumer expectations shift toward individualized, data-backed wellness solutions, this integration is projected to become a standard differentiator for premium supplement brands.
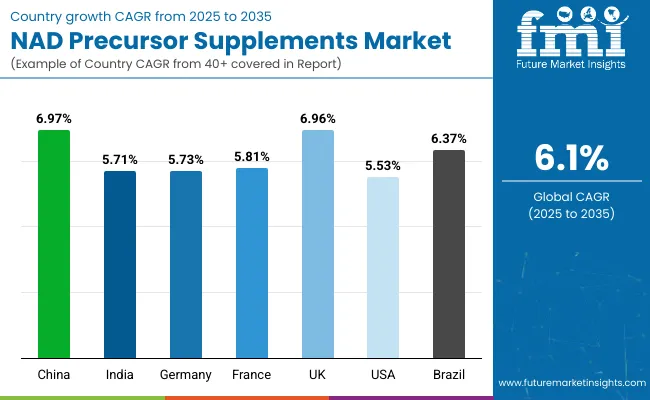
Analysis of NAD Precursor Supplements Market By Key Countries

Nad Precursor Supplements Market By Country

Countries CAGR
China 6.97%
India 5.71%
Germany 5.73%
France 5.81%
UK 6.96%
USA 5.53%
Brazil 6.37%

The global NAD Precursor Supplements Market has demonstrated significant cross-country variation in growth momentum, shaped by demographic aging, wellness consumerism, and regulatory transparency. Asia-Pacific has been identified as a high-opportunity region, with China projected to lead regional expansion at a 6.97% CAGR, driven by rising urban health awareness, cross-border supplement consumption, and increasing alignment with global longevity trends.

India, with a 5.71% CAGR, is witnessing early-stage adoption through digitally native supplement brands and bioavailability-optimized formulations targeting Tier-1 cities.

In Europe, sustained growth is expected across high-regulation economies. The UK is forecasted at a 6.96% CAGR, supported by nutraceutical-tech startups and NHS-initiated longevity dialogues. France (5.81%) and Germany (5.73%) are emphasizing clinically validated aging solutions, with EU-compliant labeling practices reinforcing consumer trust and favoring NAD+ precursors backed by pharmacokinetic data.

North America retains a leading market share, although growth in the United States (5.53%) reflects market maturity and a shift toward differentiation through personalized formulations and biotech partnerships. Brazil, growing at 6.37%, is emerging as a key LATAM node, propelled by health-conscious middle-income consumers and expanded functional ingredient access through relaxed import frameworks.

As regional dynamics evolve, the harmonization of quality standards and innovation in delivery mechanisms are expected to narrow geographic growth gaps and unlock latent demand across underserved nations.

Sales Outlook for NAD Precursor Supplements in the United States

Year USA (USD million)
2025 210.3
2026 224.3
2027 238.6
2028 253.3
2029 267.7
2030 284.1
2031 299.2
2032 318.3
2033 339.0
2034 358.4
2035 378.7

The NAD Precursor Supplements Market in the United States is projected to expand from USD 350 million in 2025 to USD 779 million by 2035, advancing at a compound annual growth rate (CAGR) of 8.4%. Growth is being accelerated by high consumer receptivity to longevity-focused health solutions and the integration of NAD+ optimization into wellness diagnostics and precision nutrition platforms.

Premium adoption has been observed among aging populations and biohacking communities, where NMN and NR-based formulations are being favored for their clinically substantiated efficacy. Institutional demand is also being catalyzed by partnerships with clinical trial networks and personalized supplement startups. A rise in digital health subscription models has enabled tailored NAD supplementation, guided by real-time biomarkers and genetic assessments.

Formulation innovation has been prioritized, with liposomal, time-release, and sublingual formats gaining traction due to their enhanced bioavailability. Growth has been further supported by wellness-centric retail expansion and FDA-aligned labeling practices, strengthening consumer trust and market penetration.

  • Personalized longevity protocols have driven demand among health-conscious consumers aged 45 and above.
  • Digital health platforms have facilitated data-driven NAD+ optimization through continuous tracking and feedback loops.
  • Liposomal and sublingual delivery systems are being adopted to meet advanced absorption expectations.

Growth and Expansion Outlook for NAD Precursor Supplements Market in the United Kingdom

The NAD Precursor Supplements Market in the UK is forecasted to grow from a modest base in 2025 to a significantly larger footprint by 2035, expanding at a CAGR of 6.96%. Market growth is being driven by heightened consumer focus on healthy aging, adoption of longevity supplements by wellness clinics, and increased availability of clinically validated NR and NMN products.

Health-conscious millennials and older adults alike are turning to cellular health regimens, supported by e-pharmacies, wellness apps, and personalized subscription services. Regulatory enforcement on product labeling and quality is prompting brands to invest in transparent sourcing and clinical trials. Partnerships between biotech start-ups and retail channels are expanding consumer reach.

  • NMN adoption is rising via biohacking and longevity wellness centers.
  • NHS initiatives are promoting preventive aging frameworks.
  • E-commerce platforms are driving personalized supplement access.
  • EU-aligned clean-label compliance is enhancing consumer trust.

Growth and Expansion Outlook for NAD Precursor Supplements Market in India

India’s NAD Precursor Supplements Market is projected to advance steadily from 2025 to 2035 at a CAGR of 5.71%, supported by urban lifestyle changes, growing wellness app usage, and social media-driven supplement awareness. The market is being shaped by younger, digital-first consumers who are seeking energy-boosting and anti-aging interventions.

NMN and NR are being introduced via online-only brands with diagnostic integration, enabling personalized dosing models. Regulatory improvements under India’s nutraceutical and AYUSH frameworks are expected to ease market entry. While the Tier-1 city adoption remains dominant, growth in Tier-2 and Tier-3 cities is being unlocked through vernacular health influencers and e-pharmacy expansion.

  • Urban adoption is accelerating via digital-first supplement platforms.
  • Preventive health awareness is expanding among working professionals.
  • Bioavailability innovations are being localized for Indian consumers.
  • AYUSH-aligned regulatory pathways are easing product approvals.

Sales Outlook for NAD Precursor Supplements in China

China’s NAD Precursor Supplements Market is expected to grow at a CAGR of 6.97% between 2025 and 2035, marking one of the highest regional growth rates. Market acceleration is being driven by middle-class expansion, cross-border supplement sales, and high demand for longevity interventions.

NMN, in particular, is gaining traction as a premium offering in the anti-aging and mitochondrial health space. As regulatory clarity improves and local brands receive certification, the domestic market is projected to shift from import-reliant to self-sustaining. Demand is further supported by China’s growing emphasis on healthy life expectancy and integration of wellness into mainstream healthcare.

  • NMN is gaining visibility via influencer marketing and health-tech platforms.
  • Regulatory clarity is unlocking scalability for local players.
  • Cross-border e-commerce has driven early-stage consumer education.
  • Healthy aging is being institutionalized in national wellness policy frameworks.

In-depth Analysis of NAD Precursor Supplements in Germany

Countries 2025
UK 16%
Germany 20%
Italy 10%
France 14%
Spain 8%
BENELUX 6%
Nordic 5%
Rest of Europe 21%
Countries 2035
UK 15%
Germany 19%
Italy 10%
France 13%
Spain 9%
BENELUX 7%
Nordic 6%
Rest of Europe 21%

Germany’s NAD Precursor Supplements Market is projected to expand at a CAGR of 5.73% from 2025 to 2035, driven by a well-informed senior population and clinical alignment with preventive aging. Regulatory rigor in ingredient quality and safety continues to drive consumer trust, positioning Germany as a hub for clinically validated supplements.

Growth is being led by established pharmacies and wellness clinics introducing NMN and NR into their aging wellness protocols. The market is further supported by interest in mitochondrial health and cognitive performance supplements among health-conscious professionals and older adults. Integration with digital health apps is also enhancing personalized usage.

  • Clinically endorsed NMN/NR formulations are being sold through pharmacies.
  • Aging population is driving preventive nutraceutical uptake.
  • Clean-label, EU-compliant certifications are strengthening product appeal.
  • Wellness clinics are incorporating NAD precursors into longevity care plans.

Growth Outlook for NAD Precursor Supplements Market in Japan

Ingredient Type Market Share (%)
Nicotinamide Mononucleotide (NMN) 55%
Nicotinamide Riboside (NR) 20%
Nicotinamide (Nam) 10%
Tryptophan 5%
Other Precursors / Blends 10%

The NAD Precursor Supplements Market in Japan whereas NMN accounting for 55% of total value, signifying a strong consumer and clinical preference for high-efficacy formulations. NR holds a 20% share, while other precursors remain niche. The dominant position of NMN is being driven by its early introduction through Japanese biotech channels and its extensive coverage in longevity science discourse across academia and digital health platforms.

Japanese consumers have shown a clear inclination toward clinically validated, high-purity formulations, further elevating NMN’s credibility in the market. Regulatory alignment and cross-sector R&D collaborations are enabling faster product lifecycle advancement.

With Japan's aging population projected to reach nearly 30% of the total demographic, cellular health supplements are being positioned as integral to preventive care strategies. Pharmaceutical retail networks and functional food categories are converging, allowing for seamless integration of NMN products into both daily nutrition and therapeutic routines.

  • Market in Japan is estimated to hold a significant share of global demand by 2025, reflecting early adoption patterns.
  • NMN leads decisively at 55%, far ahead of NR and other ingredients.
  • Market expansion is being supported by strong consumer trust in science-backed aging interventions.
  • Local R&D and advanced regulatory systems are accelerating high-quality NMN formulation availability.

Opportunity Analysis of South Korea NAD Precursor Supplements Market

Health Function Market Share(%)
Healthy Aging & Longevity 25%
Anti-Aging 15%
Energy & Mitochondrial Support 15%
Cognitive Health 12%
Metabolic Health 10%
Energy & Vitality 8%
Athletic Performance & Recovery 8%
Cognitive Performance 4%
Cellular Repair & Protection 3%

The NAD Precursor Supplements Market in South Korea is projected to record robust growth through 2025, with demand led by the Healthy Aging & Longevity segment at 25% value share, followed by Anti-Aging and Mitochondrial Support functions, each at 15%. The cultural prioritization of aesthetic wellness, longevity, and energy optimization is creating favorable conditions for NAD-focused formulations to be adopted by a wide demographic, particularly consumers aged 30-60.

Early market traction has been enabled by South Korea’s advanced beauty-nutrition ecosystem, where aging and vitality supplements are increasingly offered alongside dermatological and wellness services. Functional positioning of NMN and NR in skincare clinics, health tech apps, and e-commerce platforms is helping normalize NAD supplementation in daily preventive care. Regulatory alignment under KFDA’s functional food category is reinforcing credibility, while clinical collaborations with academic hospitals are deepening trust in NAD’s therapeutic potential.
  • Healthy Aging & Longevity leads with 25% share, signaling preventive aging as the dominant consumption driver.
  • Dual focus on aesthetic and metabolic aging supports multi-functional NAD product lines.
  • Market expansion is being supported by integration into beauty-wellness hybrids and tele-nutrition platforms.
  • KFDA-aligned regulation is enabling faster commercialization of evidence-based NAD+ products.

Competitive Landscape of NAD Precursor Supplements Market

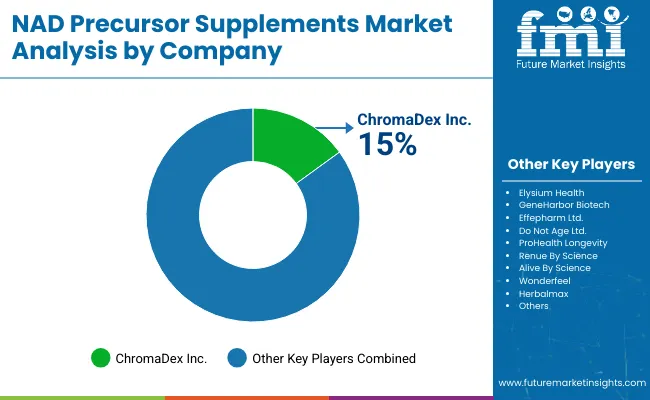
Nad Precursor Supplements Market By Company

Players Global Value Share 2025
ChromaDex Inc.(Tru Niagen ®) 15%
Others 85%

The NAD Precursor Supplements Market is moderately fragmented, with global leaders, mid‑sized innovators, and niche specialists competing across distinct segments. Tier 1 players such as Niagen Bioscience (formerly ChromaDex, maker of Tru Niagen®) and Elysium Health are commanding the largest global market shares, collectively accounting for an estimated 20-30% of total NAD supplement revenue Their dominance is underpinned by clinically backed NR and NMN formulations, deep R&D pipelines, and regulatory credibility across North America and Europe.

Mid‑sized innovators, including ProHealth Longevity, RenueBy Science, and Do Not Age Ltd., are being leveraged to target health‑tech‑savvy consumers through direct‑to‑consumer channels. These players are driving adoption via specialty formulations, liposomal delivery, and influencer‑driven product narratives

Niche specialists, such as GeneHarbor (Hong Kong), Alive By Science, Wonderfeel, Herbalmax, and Effepharm (Uthever® NMN), are focusing on country‑specific or function‑specific segments like skincare integration, high‑dose NMN blends, or local dietary contexts. Their competitive edge lies in customization and regional adaptability rather than scale.

Competitive differentiation is shifting away from raw ingredient claims toward integrated platforms that combine predictive analytics, biomarker‑driven personalization, and subscription‑based service models. Collaboration trends with tele‑health diagnostic apps and longevity clinics are reshaping the value proposition especially among premium consumer segments. The competitive landscape is expected to tilt further toward ecosystem‑oriented brands combining science, transparency, and tech integration.

Key Developments in NAD Precursor Supplements Market

  • On July 8, 2025, Niagen Bioscience (formerly ChromaDex) secured an exclusive license with Haukeland University Hospital in Bergen, Norway to develop its patented nicotinamide riboside (Niagen®) as a potential Parkinson’s disease therapy, reflecting a strategic pivot of NAD precursors toward clinical drug development. alongside broader wellness‑industry credibility and positioning
  • On January 7, 2025, Renue By Science unveiled “Renue Blue,” a liposomal NAD+ precursor skincare and wellness line designed to optimize cellular energy and skin longevity, marking a novel convergence of NAD supplementation with beauty applications and expanding market reach through cross‑channel retail launch strategic innovation branding driven by clinical positioning.

Scope of the Report

Item Value
Quantitative Units USD 876.2 Million
Ingredient Type Nicotinamide Mononucleotide (NMN), Nicotinamide Riboside (NR), Nicotinamide (Nam), Tryptophan, Other Precursors/Blends
Health Function Healthy Aging & Longevity, Energy & Mitochondrial Support, Cognitive Health, Metabolic Health, Athletic Performance, Anti-Aging, Energy & Vitality, Cognitive Performance, Cellular Repair & Protection
Product Format Capsules, Tablets, Sublingual Tablets/Lozenges, Powders, Liquid Formulations, Functional Beverages
Application Areas General Wellness, Anti-Aging, Sports Recovery, Cognitive Enhancement, Metabolic Regulation, Clinical Nutrition
Sales Channels Online Retail, Health Stores, Pharmacies, Direct-to-Consumer (DTC), Functional Clinics
Regions Covered North America, Europe, Asia-Pacific, Latin America, Middle East & Africa
Countries Covered United States, Canada, Germany, France, United Kingdom, China, Japan, India, Brazil, South Korea, South Africa
Key Companies Profiled ChromaDex Inc. (Tru Niagen ®), Elysium Health, GeneHarbor Biotech, Effepharm Ltd. (Uthever ®), Do Not Age Ltd., ProHealth Longevity, Renue By Science, Alive By Science, Wonderfeel , Herbalmax
Additional Attributes Market size by ingredient and application, CAGR by region, delivery system innovations (e.g., liposomal), longevity and wellness consumer behavior, DTC and e-commerce disruption, regulatory frameworks by region, and clinical research alignment with supplement innovation

Key Segments

By Ingredient Type:

  • Nicotinamide Mononucleotide (NMN)
  • Nicotinamide Riboside (NR)
  • Nicotinamide (Nam)
  • Tryptophan
  • Other Precursors / Blends

By Health Function:

  • Healthy Aging & Longevity
  • Energy & Mitochondrial Support
  • Cognitive Health
  • Metabolic Health
  • Athletic Performance & Recovery
  • Anti‑Aging
  • Energy & Vitality
  • Cognitive Performance
  • Cellular Repair & Protection

By Product Format:

  • Capsules
  • Tablets
  • Sublingual Tablets / Lozenges
  • Powders
  • Liquid Formulations
  • Functional Beverages

By Sales Channel:

  • Pharmacies & Drugstores
  • Health & Nutrition Stores
  • Online Retail
  • Direct‑to‑Consumer (DTC) Brands
  • Practitioner / Clinic Distribution

By Region:

  • North America
  • Latin America
  • Europe
  • East Asia
  • South Asia & Pacific
  • Middle East & Africa

Table of Content

  1. Executive Summary
    • Global Market Outlook
    • Demand-side Trends
    • Supply-side Trends
    • Technology Roadmap Analysis
    • Analysis and Recommendations
  2. Market Overview
    • Market Coverage / Taxonomy
    • Market Definition / Scope / Limitations
  3. Market Background
    • Market Dynamics
      • Drivers
      • Restraints
      • Opportunity
      • Trends
    • Scenario Forecast
      • Demand in Optimistic Scenario
      • Demand in Likely Scenario
      • Demand in Conservative Scenario
    • Opportunity Map Analysis
    • Product Life Cycle Analysis
    • Supply Chain Analysis
    • Investment Feasibility Matrix
    • Value Chain Analysis
    • PESTLE and Porter’s Analysis
    • Regulatory Landscape
    • Regional Parent Market Outlook
    • Production and Consumption Statistics
    • Import and Export Statistics
  4. Global Market Analysis 2020 to 2024 and Forecast, 2025 to 2035
    • Historical Market Size Value (USD Million) & Volume (MT) Analysis, 2020 to 2024
    • Current and Future Market Size Value (USD Million) & Volume (MT) Projections, 2025 to 2035
      • Y-o-Y Growth Trend Analysis
      • Absolute $ Opportunity Analysis
  5. Global Market Pricing Analysis 2020 to 2024 and Forecast 2025 to 2035
  6. Global Market Analysis 2020 to 2024 and Forecast 2025 to 2035, By Ingredient Type
    • Introduction / Key Findings
    • Historical Market Size Value (USD Million) & Volume (MT) Analysis By Ingredient Type, 2020 to 2024
    • Current and Future Market Size Value (USD Million) & Volume (MT) Analysis and Forecast By Ingredient Type, 2025 to 2035
      • Nicotinamide Mononucleotide (NMN)
      • Nicotinamide Riboside (NR)
      • Nicotinamide (Nam)
      • Tryptophan
      • Other Precursors / Blends
    • Y-o-Y Growth Trend Analysis By Ingredient Type, 2020 to 2024
    • Absolute $ Opportunity Analysis By Ingredient Type, 2025 to 2035
  7. Global Market Analysis 2020 to 2024 and Forecast 2025 to 2035, By Health Function
    • Introduction / Key Findings
    • Historical Market Size Value (USD Million) & Volume (MT) Analysis By Health Function, 2020 to 2024
    • Current and Future Market Size Value (USD Million) & Volume (MT) Analysis and Forecast By Health Function, 2025 to 2035
      • Healthy Aging & Longevity
      • Energy & Mitochondrial Support
      • Cognitive Health
      • Metabolic Health
      • Athletic Performance & Recovery
      • Anti‑Aging
      • Energy & Vitality
      • Cognitive Performance
      • Cellular Repair & Protection
    • Y-o-Y Growth Trend Analysis By Health Function, 2020 to 2024
    • Absolute $ Opportunity Analysis By Health Function, 2025 to 2035
  8. Global Market Analysis 2020 to 2024 and Forecast 2025 to 2035, By Product Format
    • Introduction / Key Findings
    • Historical Market Size Value (USD Million) & Volume (MT) Analysis By Product Format, 2020 to 2024
    • Current and Future Market Size Value (USD Million) & Volume (MT) Analysis and Forecast By Product Format, 2025 to 2035
      • Capsules
      • Tablets
      • Sublingual Tablets / Lozenges
      • Powders
      • Liquid Formulations
      • Functional Beverages
    • Y-o-Y Growth Trend Analysis By Product Format, 2020 to 2024
    • Absolute $ Opportunity Analysis By Product Format, 2025 to 2035
  9. Global Market Analysis 2020 to 2024 and Forecast 2025 to 2035, By Sales Channel
    • Introduction / Key Findings
    • Historical Market Size Value (USD Million) & Volume (MT) Analysis By Sales Channel, 2020 to 2024
    • Current and Future Market Size Value (USD Million) & Volume (MT) Analysis and Forecast By Sales Channel, 2025 to 2035
      • Pharmacies & Drugstores
      • Health & Nutrition Stores
      • Online Retail
      • Direct‑to‑Consumer (DTC) Brands
      • Practitioner / Clinic Distribution
    • Y-o-Y Growth Trend Analysis By Sales Channel, 2020 to 2024
    • Absolute $ Opportunity Analysis By Sales Channel, 2025 to 2035
  10. Global Market Analysis 2020 to 2024 and Forecast 2025 to 2035, By Region
    • Introduction
    • Historical Market Size Value (USD Million) & Volume (MT) Analysis By Region, 2020 to 2024
    • Current Market Size Value (USD Million) & Volume (MT) Analysis and Forecast By Region, 2025 to 2035
      • North America
      • Latin America
      • Europe
      • East Asia
      • South Asia & Pacific
      • Middle East & Africa
    • Market Attractiveness Analysis By Region
  11. North America Market Analysis 2020 to 2024 and Forecast 2025 to 2035, By Country
    • Historical Market Size Value (USD Million) & Volume (MT) Trend Analysis By Market Taxonomy, 2020 to 2024
    • Market Size Value (USD Million) & Volume (MT) Forecast By Market Taxonomy, 2025 to 2035
      • By Country
        • USA
        • Canada
      • By Ingredient Type
      • By Health Function
      • By Product Format
      • By Sales Channel
    • Market Attractiveness Analysis
      • By Country
      • By Ingredient Type
      • By Health Function
      • By Product Format
      • By Sales Channel
    • Key Takeaways
  12. Latin America Market Analysis 2020 to 2024 and Forecast 2025 to 2035, By Country
    • Historical Market Size Value (USD Million) & Volume (MT) Trend Analysis By Market Taxonomy, 2020 to 2024
    • Market Size Value (USD Million) & Volume (MT) Forecast By Market Taxonomy, 2025 to 2035
      • By Country
        • Brazil
        • Mexico
        • Colombia
        • Rest of Latin America
      • By Ingredient Type
      • By Health Function
      • By Product Format
      • By Sales Channel
    • Market Attractiveness Analysis
      • By Country
      • By Ingredient Type
      • By Health Function
      • By Product Format
      • By Sales Channel
    • Key Takeaways
  13. Europe Market Analysis 2020 to 2024 and Forecast 2025 to 2035, By Country
    • Historical Market Size Value (USD Million) & Volume (MT) Trend Analysis By Market Taxonomy, 2020 to 2024
    • Market Size Value (USD Million) & Volume (MT) Forecast By Market Taxonomy, 2025 to 2035
      • By Country
        • Germany
        • UK
        • France
        • Italy
        • Spain
        • Belgium
        • Netherlands
        • Nordic
        • Switzerland
        • Russia
        • Poland
        • Rest of Europe
      • By Ingredient Type
      • By Health Function
      • By Product Format
      • By Sales Channel
    • Market Attractiveness Analysis
      • By Country
      • By Ingredient Type
      • By Health Function
      • By Product Format
      • By Sales Channel
    • Key Takeaways
  14. East Asia Market Analysis 2020 to 2024 and Forecast 2025 to 2035, By Country
    • Historical Market Size Value (USD Million) & Volume (MT) Trend Analysis By Market Taxonomy, 2020 to 2024
    • Market Size Value (USD Million) & Volume (MT) Forecast By Market Taxonomy, 2025 to 2035
      • By Country
        • China
        • Japan
        • South Korea
      • By Ingredient Type
      • By Health Function
      • By Product Format
      • By Sales Channel
    • Market Attractiveness Analysis
      • By Country
      • By Ingredient Type
      • By Health Function
      • By Product Format
      • By Sales Channel
    • Key Takeaways
  15. South Asia & Pacific Market Analysis 2020 to 2024 and Forecast 2025 to 2035, By Country
    • Historical Market Size Value (USD Million) & Volume (MT) Trend Analysis By Market Taxonomy, 2020 to 2024
    • Market Size Value (USD Million) & Volume (MT) Forecast By Market Taxonomy, 2025 to 2035
      • By Country
        • India
        • Thailand
        • Malaysia
        • Indonesia
        • Singapore
        • Vietnam
        • Australia
        • New Zealand
        • Rest of South Asia
      • By Ingredient Type
      • By Health Function
      • By Product Format
      • By Sales Channel
    • Market Attractiveness Analysis
      • By Country
      • By Ingredient Type
      • By Health Function
      • By Product Format
      • By Sales Channel
    • Key Takeaways
  16. Middle East & Africa Market Analysis 2020 to 2024 and Forecast 2025 to 2035, By Country
    • Historical Market Size Value (USD Million) & Volume (MT) Trend Analysis By Market Taxonomy, 2020 to 2024
    • Market Size Value (USD Million) & Volume (MT) Forecast By Market Taxonomy, 2025 to 2035
      • By Country
        • Kingdom of Saudi Arabia
        • Other GCC Countries
        • Turkiye
        • South Africa
        • Other African Union
        • Rest of Middle East & Africa
      • By Ingredient Type
      • By Health Function
      • By Product Format
      • By Sales Channel
    • Market Attractiveness Analysis
      • By Country
      • By Ingredient Type
      • By Health Function
      • By Product Format
      • By Sales Channel
    • Key Takeaways
  17. Key Countries Market Analysis
    • USA
      • Pricing Analysis
      • Market Share Analysis, 2024
        • By Ingredient Type
        • By Health Function
        • By Product Format
        • By Sales Channel
    • Canada
      • Pricing Analysis
      • Market Share Analysis, 2024
        • By Ingredient Type
        • By Health Function
        • By Product Format
        • By Sales Channel
    • Brazil
      • Pricing Analysis
      • Market Share Analysis, 2024
        • By Ingredient Type
        • By Health Function
        • By Product Format
        • By Sales Channel
    • Mexico
      • Pricing Analysis
      • Market Share Analysis, 2024
        • By Ingredient Type
        • By Health Function
        • By Product Format
        • By Sales Channel
    • Colombia
      • Pricing Analysis
      • Market Share Analysis, 2024
        • By Ingredient Type
        • By Health Function
        • By Product Format
        • By Sales Channel
    • Germany
      • Pricing Analysis
      • Market Share Analysis, 2024
        • By Ingredient Type
        • By Health Function
        • By Product Format
        • By Sales Channel
    • UK
      • Pricing Analysis
      • Market Share Analysis, 2024
        • By Ingredient Type
        • By Health Function
        • By Product Format
        • By Sales Channel
    • France
      • Pricing Analysis
      • Market Share Analysis, 2024
        • By Ingredient Type
        • By Health Function
        • By Product Format
        • By Sales Channel
    • Italy
      • Pricing Analysis
      • Market Share Analysis, 2024
        • By Ingredient Type
        • By Health Function
        • By Product Format
        • By Sales Channel
    • Spain
      • Pricing Analysis
      • Market Share Analysis, 2024
        • By Ingredient Type
        • By Health Function
        • By Product Format
        • By Sales Channel
    • Belgium
      • Pricing Analysis
      • Market Share Analysis, 2024
        • By Ingredient Type
        • By Health Function
        • By Product Format
        • By Sales Channel
    • Netherlands
      • Pricing Analysis
      • Market Share Analysis, 2024
        • By Ingredient Type
        • By Health Function
        • By Product Format
        • By Sales Channel
    • Nordic
      • Pricing Analysis
      • Market Share Analysis, 2024
        • By Ingredient Type
        • By Health Function
        • By Product Format
        • By Sales Channel
    • Switzerland
      • Pricing Analysis
      • Market Share Analysis, 2024
        • By Ingredient Type
        • By Health Function
        • By Product Format
        • By Sales Channel
    • Russia
      • Pricing Analysis
      • Market Share Analysis, 2024
        • By Ingredient Type
        • By Health Function
        • By Product Format
        • By Sales Channel
    • Poland
      • Pricing Analysis
      • Market Share Analysis, 2024
        • By Ingredient Type
        • By Health Function
        • By Product Format
        • By Sales Channel
    • China
      • Pricing Analysis
      • Market Share Analysis, 2024
        • By Ingredient Type
        • By Health Function
        • By Product Format
        • By Sales Channel
    • Japan
      • Pricing Analysis
      • Market Share Analysis, 2024
        • By Ingredient Type
        • By Health Function
        • By Product Format
        • By Sales Channel
    • South Korea
      • Pricing Analysis
      • Market Share Analysis, 2024
        • By Ingredient Type
        • By Health Function
        • By Product Format
        • By Sales Channel
    • India
      • Pricing Analysis
      • Market Share Analysis, 2024
        • By Ingredient Type
        • By Health Function
        • By Product Format
        • By Sales Channel
    • Thailand
      • Pricing Analysis
      • Market Share Analysis, 2024
        • By Ingredient Type
        • By Health Function
        • By Product Format
        • By Sales Channel
    • Indonesia
      • Pricing Analysis
      • Market Share Analysis, 2024
        • By Ingredient Type
        • By Health Function
        • By Product Format
        • By Sales Channel
    • Australia
      • Pricing Analysis
      • Market Share Analysis, 2024
        • By Ingredient Type
        • By Health Function
        • By Product Format
        • By Sales Channel
    • New Zealand
      • Pricing Analysis
      • Market Share Analysis, 2024
        • By Ingredient Type
        • By Health Function
        • By Product Format
        • By Sales Channel
    • Turkey
      • Pricing Analysis
      • Market Share Analysis, 2024
        • By Ingredient Type
        • By Health Function
        • By Product Format
        • By Sales Channel
    • UAE
      • Pricing Analysis
      • Market Share Analysis, 2024
        • By Ingredient Type
        • By Health Function
        • By Product Format
        • By Sales Channel
    • Saudi Arabia
      • Pricing Analysis
      • Market Share Analysis, 2024
        • By Ingredient Type
        • By Health Function
        • By Product Format
        • By Sales Channel
    • Israel
      • Pricing Analysis
      • Market Share Analysis, 2024
        • By Ingredient Type
        • By Health Function
        • By Product Format
        • By Sales Channel
    • North Africa
      • Pricing Analysis
      • Market Share Analysis, 2024
        • By Ingredient Type
        • By Health Function
        • By Product Format
        • By Sales Channel
    • South Africa
      • Pricing Analysis
      • Market Share Analysis, 2024
        • By Ingredient Type
        • By Health Function
        • By Product Format
        • By Sales Channel
  18. Market Structure Analysis
    • Competition Dashboard
    • Competition Benchmarking
    • Market Share Analysis of Top Players
      • By Regional
      • By Ingredient Type
      • By Health Function
      • By Product Format
      • By Sales Channel
  19. Competition Analysis
    • Competition Deep Dive
      • Elysium Health
        • Overview
        • Product Portfolio
        • Profitability by Market Segments (Product/Age /Sales Channel/Region)
        • Sales Footprint
        • Strategy Overview
        • ChromaDex Inc. (Tru Niagen®)
        • GeneHarbor (Hong Kong) Biotechnologies
        • Alive Science
        • Renue Science
        • ProHealth Longevity
        • Do Not Age Ltd.
        • Effepharm Ltd. (Uthever® NMN)
        • Wonderfeel
        • Herbalmax
        • Others
    • Assumptions & Acronyms Used
    • Research Methodology

List of Tables

  • Table 1: Global Market Value (USD Million) Forecast by Region, 2020-2035
  • Table 2: Global Market Volume (Units) Forecast by Region, 2020-2035
  • Table 3: Global Market Value (USD Million) Forecast by Ingredient Type, 2020-2035
  • Table 4: Global Market Volume (Units) Forecast by Ingredient Type, 2020-2035
  • Table 5: Global Market Value (USD Million) Forecast by Health Function, 2020-2035
  • Table 6: Global Market Volume (Units) Forecast by Health Function, 2020-2035
  • Table 7: Global Market Value (USD Million) Forecast by Product Format, 2020-2035
  • Table 8: Global Market Volume (Units) Forecast by Product Format, 2020-2035
  • Table 9: Global Market Value (USD Million) Forecast by Sales Channel, 2020-2035
  • Table 10: Global Market Volume (Units) Forecast by Sales Channel, 2020-2035
  • Table 11: North America Market Value (USD Million) Forecast by Country, 2020-2035
  • Table 12: North America Market Volume (Units) Forecast by Country, 2020-2035
  • Table 13: North America Market Value (USD Million) Forecast by Ingredient Type, 2020-2035
  • Table 14: North America Market Volume (Units) Forecast by Ingredient Type, 2020-2035
  • Table 15: North America Market Value (USD Million) Forecast by Health Function, 2020-2035
  • Table 16: North America Market Volume (Units) Forecast by Health Function, 2020-2035
  • Table 17: North America Market Value (USD Million) Forecast by Product Format, 2020-2035
  • Table 18: North America Market Volume (Units) Forecast by Product Format, 2020-2035
  • Table 19: North America Market Value (USD Million) Forecast by Sales Channel, 2020-2035
  • Table 20: North America Market Volume (Units) Forecast by Sales Channel, 2020-2035
  • Table 21: Latin America Market Value (USD Million) Forecast by Country, 2020-2035
  • Table 22: Latin America Market Volume (Units) Forecast by Country, 2020-2035
  • Table 23: Latin America Market Value (USD Million) Forecast by Ingredient Type, 2020-2035
  • Table 24: Latin America Market Volume (Units) Forecast by Ingredient Type, 2020-2035
  • Table 25: Latin America Market Value (USD Million) Forecast by Health Function, 2020-2035
  • Table 26: Latin America Market Volume (Units) Forecast by Health Function, 2020-2035
  • Table 27: Latin America Market Value (USD Million) Forecast by Product Format, 2020-2035
  • Table 28: Latin America Market Volume (Units) Forecast by Product Format, 2020-2035
  • Table 29: Latin America Market Value (USD Million) Forecast by Sales Channel, 2020-2035
  • Table 30: Latin America Market Volume (Units) Forecast by Sales Channel, 2020-2035
  • Table 31: Europe Market Value (USD Million) Forecast by Country, 2020-2035
  • Table 32: Europe Market Volume (Units) Forecast by Country, 2020-2035
  • Table 33: Europe Market Value (USD Million) Forecast by Ingredient Type, 2020-2035
  • Table 34: Europe Market Volume (Units) Forecast by Ingredient Type, 2020-2035
  • Table 35: Europe Market Value (USD Million) Forecast by Health Function, 2020-2035
  • Table 36: Europe Market Volume (Units) Forecast by Health Function, 2020-2035
  • Table 37: Europe Market Value (USD Million) Forecast by Product Format, 2020-2035
  • Table 38: Europe Market Volume (Units) Forecast by Product Format, 2020-2035
  • Table 39: Europe Market Value (USD Million) Forecast by Sales Channel, 2020-2035
  • Table 40: Europe Market Volume (Units) Forecast by Sales Channel, 2020-2035
  • Table 41: East Asia Market Value (USD Million) Forecast by Country, 2020-2035
  • Table 42: East Asia Market Volume (Units) Forecast by Country, 2020-2035
  • Table 43: East Asia Market Value (USD Million) Forecast by Ingredient Type, 2020-2035
  • Table 44: East Asia Market Volume (Units) Forecast by Ingredient Type, 2020-2035
  • Table 45: East Asia Market Value (USD Million) Forecast by Health Function, 2020-2035
  • Table 46: East Asia Market Volume (Units) Forecast by Health Function, 2020-2035
  • Table 47: East Asia Market Value (USD Million) Forecast by Product Format, 2020-2035
  • Table 48: East Asia Market Volume (Units) Forecast by Product Format, 2020-2035
  • Table 49: East Asia Market Value (USD Million) Forecast by Sales Channel, 2020-2035
  • Table 50: East Asia Market Volume (Units) Forecast by Sales Channel, 2020-2035
  • Table 51: South Asia & Pacific Market Value (USD Million) Forecast by Country, 2020-2035
  • Table 52: South Asia & Pacific Market Volume (Units) Forecast by Country, 2020-2035
  • Table 53: South Asia & Pacific Market Value (USD Million) Forecast by Ingredient Type, 2020-2035
  • Table 54: South Asia & Pacific Market Volume (Units) Forecast by Ingredient Type, 2020-2035
  • Table 55: South Asia & Pacific Market Value (USD Million) Forecast by Health Function, 2020-2035
  • Table 56: South Asia & Pacific Market Volume (Units) Forecast by Health Function, 2020-2035
  • Table 57: South Asia & Pacific Market Value (USD Million) Forecast by Product Format, 2020-2035
  • Table 58: South Asia & Pacific Market Volume (Units) Forecast by Product Format, 2020-2035
  • Table 59: South Asia & Pacific Market Value (USD Million) Forecast by Sales Channel, 2020-2035
  • Table 60: South Asia & Pacific Market Volume (Units) Forecast by Sales Channel, 2020-2035
  • Table 61: MEA Market Value (USD Million) Forecast by Country, 2020-2035
  • Table 62: MEA Market Volume (Units) Forecast by Country, 2020-2035
  • Table 63: MEA Market Value (USD Million) Forecast by Ingredient Type, 2020-2035
  • Table 64: MEA Market Volume (Units) Forecast by Ingredient Type, 2020-2035
  • Table 65: MEA Market Value (USD Million) Forecast by Health Function, 2020-2035
  • Table 66: MEA Market Volume (Units) Forecast by Health Function, 2020-2035
  • Table 67: MEA Market Value (USD Million) Forecast by Product Format, 2020-2035
  • Table 68: MEA Market Volume (Units) Forecast by Product Format, 2020-2035
  • Table 69: MEA Market Value (USD Million) Forecast by Sales Channel, 2020-2035
  • Table 70: MEA Market Volume (Units) Forecast by Sales Channel, 2020-2035

List of Figures

  • Figure 1: Global Market Value (USD Million) by Ingredient Type, 2025-2035
  • Figure 2: Global Market Value (USD Million) by Health Function, 2025-2035
  • Figure 3: Global Market Value (USD Million) by Product Format, 2025-2035
  • Figure 4: Global Market Value (USD Million) by Sales Channel, 2025-2035
  • Figure 5: Global Market Value (USD Million) by Region, 2025-2035
  • Figure 6: Global Market Value (USD Million) Analysis by Region, 2020-2035
  • Figure 7: Global Market Volume (Units) Analysis by Region, 2020-2035
  • Figure 8: Global Market Value Share (%) and BPS Analysis by Region, 2025-2035
  • Figure 9: Global Market Y-o-Y Growth (%) Projections by Region, 2025-2035
  • Figure 10: Global Market Value (USD Million) Analysis by Ingredient Type, 2020-2035
  • Figure 11: Global Market Volume (Units) Analysis by Ingredient Type, 2020-2035
  • Figure 12: Global Market Value Share (%) and BPS Analysis by Ingredient Type, 2025-2035
  • Figure 13: Global Market Y-o-Y Growth (%) Projections by Ingredient Type, 2025-2035
  • Figure 14: Global Market Value (USD Million) Analysis by Health Function, 2020-2035
  • Figure 15: Global Market Volume (Units) Analysis by Health Function, 2020-2035
  • Figure 16: Global Market Value Share (%) and BPS Analysis by Health Function, 2025-2035
  • Figure 17: Global Market Y-o-Y Growth (%) Projections by Health Function, 2025-2035
  • Figure 18: Global Market Value (USD Million) Analysis by Product Format, 2020-2035
  • Figure 19: Global Market Volume (Units) Analysis by Product Format, 2020-2035
  • Figure 20: Global Market Value Share (%) and BPS Analysis by Product Format, 2025-2035
  • Figure 21: Global Market Y-o-Y Growth (%) Projections by Product Format, 2025-2035
  • Figure 22: Global Market Value (USD Million) Analysis by Sales Channel, 2020-2035
  • Figure 23: Global Market Volume (Units) Analysis by Sales Channel, 2020-2035
  • Figure 24: Global Market Value Share (%) and BPS Analysis by Sales Channel, 2025-2035
  • Figure 25: Global Market Y-o-Y Growth (%) Projections by Sales Channel, 2025-2035
  • Figure 26: Global Market Attractiveness by Ingredient Type, 2025-2035
  • Figure 27: Global Market Attractiveness by Health Function, 2025-2035
  • Figure 28: Global Market Attractiveness by Product Format, 2025-2035
  • Figure 29: Global Market Attractiveness by Sales Channel, 2025-2035
  • Figure 30: Global Market Attractiveness by Region, 2025-2035
  • Figure 31: North America Market Value (USD Million) by Ingredient Type, 2025-2035
  • Figure 32: North America Market Value (USD Million) by Health Function, 2025-2035
  • Figure 33: North America Market Value (USD Million) by Product Format, 2025-2035
  • Figure 34: North America Market Value (USD Million) by Sales Channel, 2025-2035
  • Figure 35: North America Market Value (USD Million) by Country, 2025-2035
  • Figure 36: North America Market Value (USD Million) Analysis by Country, 2020-2035
  • Figure 37: North America Market Volume (Units) Analysis by Country, 2020-2035
  • Figure 38: North America Market Value Share (%) and BPS Analysis by Country, 2025-2035
  • Figure 39: North America Market Y-o-Y Growth (%) Projections by Country, 2025-2035
  • Figure 40: North America Market Value (USD Million) Analysis by Ingredient Type, 2020-2035
  • Figure 41: North America Market Volume (Units) Analysis by Ingredient Type, 2020-2035
  • Figure 42: North America Market Value Share (%) and BPS Analysis by Ingredient Type, 2025-2035
  • Figure 43: North America Market Y-o-Y Growth (%) Projections by Ingredient Type, 2025-2035
  • Figure 44: North America Market Value (USD Million) Analysis by Health Function, 2020-2035
  • Figure 45: North America Market Volume (Units) Analysis by Health Function, 2020-2035
  • Figure 46: North America Market Value Share (%) and BPS Analysis by Health Function, 2025-2035
  • Figure 47: North America Market Y-o-Y Growth (%) Projections by Health Function, 2025-2035
  • Figure 48: North America Market Value (USD Million) Analysis by Product Format, 2020-2035
  • Figure 49: North America Market Volume (Units) Analysis by Product Format, 2020-2035
  • Figure 50: North America Market Value Share (%) and BPS Analysis by Product Format, 2025-2035
  • Figure 51: North America Market Y-o-Y Growth (%) Projections by Product Format, 2025-2035
  • Figure 52: North America Market Value (USD Million) Analysis by Sales Channel, 2020-2035
  • Figure 53: North America Market Volume (Units) Analysis by Sales Channel, 2020-2035
  • Figure 54: North America Market Value Share (%) and BPS Analysis by Sales Channel, 2025-2035
  • Figure 55: North America Market Y-o-Y Growth (%) Projections by Sales Channel, 2025-2035
  • Figure 56: North America Market Attractiveness by Ingredient Type, 2025-2035
  • Figure 57: North America Market Attractiveness by Health Function, 2025-2035
  • Figure 58: North America Market Attractiveness by Product Format, 2025-2035
  • Figure 59: North America Market Attractiveness by Sales Channel, 2025-2035
  • Figure 60: North America Market Attractiveness by Country, 2025-2035
  • Figure 61: Latin America Market Value (USD Million) by Ingredient Type, 2025-2035
  • Figure 62: Latin America Market Value (USD Million) by Health Function, 2025-2035
  • Figure 63: Latin America Market Value (USD Million) by Product Format, 2025-2035
  • Figure 64: Latin America Market Value (USD Million) by Sales Channel, 2025-2035
  • Figure 65: Latin America Market Value (USD Million) by Country, 2025-2035
  • Figure 66: Latin America Market Value (USD Million) Analysis by Country, 2020-2035
  • Figure 67: Latin America Market Volume (Units) Analysis by Country, 2020-2035
  • Figure 68: Latin America Market Value Share (%) and BPS Analysis by Country, 2025-2035
  • Figure 69: Latin America Market Y-o-Y Growth (%) Projections by Country, 2025-2035
  • Figure 70: Latin America Market Value (USD Million) Analysis by Ingredient Type, 2020-2035
  • Figure 71: Latin America Market Volume (Units) Analysis by Ingredient Type, 2020-2035
  • Figure 72: Latin America Market Value Share (%) and BPS Analysis by Ingredient Type, 2025-2035
  • Figure 73: Latin America Market Y-o-Y Growth (%) Projections by Ingredient Type, 2025-2035
  • Figure 74: Latin America Market Value (USD Million) Analysis by Health Function, 2020-2035
  • Figure 75: Latin America Market Volume (Units) Analysis by Health Function, 2020-2035
  • Figure 76: Latin America Market Value Share (%) and BPS Analysis by Health Function, 2025-2035
  • Figure 77: Latin America Market Y-o-Y Growth (%) Projections by Health Function, 2025-2035
  • Figure 78: Latin America Market Value (USD Million) Analysis by Product Format, 2020-2035
  • Figure 79: Latin America Market Volume (Units) Analysis by Product Format, 2020-2035
  • Figure 80: Latin America Market Value Share (%) and BPS Analysis by Product Format, 2025-2035
  • Figure 81: Latin America Market Y-o-Y Growth (%) Projections by Product Format, 2025-2035
  • Figure 82: Latin America Market Value (USD Million) Analysis by Sales Channel, 2020-2035
  • Figure 83: Latin America Market Volume (Units) Analysis by Sales Channel, 2020-2035
  • Figure 84: Latin America Market Value Share (%) and BPS Analysis by Sales Channel, 2025-2035
  • Figure 85: Latin America Market Y-o-Y Growth (%) Projections by Sales Channel, 2025-2035
  • Figure 86: Latin America Market Attractiveness by Ingredient Type, 2025-2035
  • Figure 87: Latin America Market Attractiveness by Health Function, 2025-2035
  • Figure 88: Latin America Market Attractiveness by Product Format, 2025-2035
  • Figure 89: Latin America Market Attractiveness by Sales Channel, 2025-2035
  • Figure 90: Latin America Market Attractiveness by Country, 2025-2035
  • Figure 91: Europe Market Value (USD Million) by Ingredient Type, 2025-2035
  • Figure 92: Europe Market Value (USD Million) by Health Function, 2025-2035
  • Figure 93: Europe Market Value (USD Million) by Product Format, 2025-2035
  • Figure 94: Europe Market Value (USD Million) by Sales Channel, 2025-2035
  • Figure 95: Europe Market Value (USD Million) by Country, 2025-2035
  • Figure 96: Europe Market Value (USD Million) Analysis by Country, 2020-2035
  • Figure 97: Europe Market Volume (Units) Analysis by Country, 2020-2035
  • Figure 98: Europe Market Value Share (%) and BPS Analysis by Country, 2025-2035
  • Figure 99: Europe Market Y-o-Y Growth (%) Projections by Country, 2025-2035
  • Figure 100: Europe Market Value (USD Million) Analysis by Ingredient Type, 2020-2035
  • Figure 101: Europe Market Volume (Units) Analysis by Ingredient Type, 2020-2035
  • Figure 102: Europe Market Value Share (%) and BPS Analysis by Ingredient Type, 2025-2035
  • Figure 103: Europe Market Y-o-Y Growth (%) Projections by Ingredient Type, 2025-2035
  • Figure 104: Europe Market Value (USD Million) Analysis by Health Function, 2020-2035
  • Figure 105: Europe Market Volume (Units) Analysis by Health Function, 2020-2035
  • Figure 106: Europe Market Value Share (%) and BPS Analysis by Health Function, 2025-2035
  • Figure 107: Europe Market Y-o-Y Growth (%) Projections by Health Function, 2025-2035
  • Figure 108: Europe Market Value (USD Million) Analysis by Product Format, 2020-2035
  • Figure 109: Europe Market Volume (Units) Analysis by Product Format, 2020-2035
  • Figure 110: Europe Market Value Share (%) and BPS Analysis by Product Format, 2025-2035
  • Figure 111: Europe Market Y-o-Y Growth (%) Projections by Product Format, 2025-2035
  • Figure 112: Europe Market Value (USD Million) Analysis by Sales Channel, 2020-2035
  • Figure 113: Europe Market Volume (Units) Analysis by Sales Channel, 2020-2035
  • Figure 114: Europe Market Value Share (%) and BPS Analysis by Sales Channel, 2025-2035
  • Figure 115: Europe Market Y-o-Y Growth (%) Projections by Sales Channel, 2025-2035
  • Figure 116: Europe Market Attractiveness by Ingredient Type, 2025-2035
  • Figure 117: Europe Market Attractiveness by Health Function, 2025-2035
  • Figure 118: Europe Market Attractiveness by Product Format, 2025-2035
  • Figure 119: Europe Market Attractiveness by Sales Channel, 2025-2035
  • Figure 120: Europe Market Attractiveness by Country, 2025-2035
  • Figure 121: East Asia Market Value (USD Million) by Ingredient Type, 2025-2035
  • Figure 122: East Asia Market Value (USD Million) by Health Function, 2025-2035
  • Figure 123: East Asia Market Value (USD Million) by Product Format, 2025-2035
  • Figure 124: East Asia Market Value (USD Million) by Sales Channel, 2025-2035
  • Figure 125: East Asia Market Value (USD Million) by Country, 2025-2035
  • Figure 126: East Asia Market Value (USD Million) Analysis by Country, 2020-2035
  • Figure 127: East Asia Market Volume (Units) Analysis by Country, 2020-2035
  • Figure 128: East Asia Market Value Share (%) and BPS Analysis by Country, 2025-2035
  • Figure 129: East Asia Market Y-o-Y Growth (%) Projections by Country, 2025-2035
  • Figure 130: East Asia Market Value (USD Million) Analysis by Ingredient Type, 2020-2035
  • Figure 131: East Asia Market Volume (Units) Analysis by Ingredient Type, 2020-2035
  • Figure 132: East Asia Market Value Share (%) and BPS Analysis by Ingredient Type, 2025-2035
  • Figure 133: East Asia Market Y-o-Y Growth (%) Projections by Ingredient Type, 2025-2035
  • Figure 134: East Asia Market Value (USD Million) Analysis by Health Function, 2020-2035
  • Figure 135: East Asia Market Volume (Units) Analysis by Health Function, 2020-2035
  • Figure 136: East Asia Market Value Share (%) and BPS Analysis by Health Function, 2025-2035
  • Figure 137: East Asia Market Y-o-Y Growth (%) Projections by Health Function, 2025-2035
  • Figure 138: East Asia Market Value (USD Million) Analysis by Product Format, 2020-2035
  • Figure 139: East Asia Market Volume (Units) Analysis by Product Format, 2020-2035
  • Figure 140: East Asia Market Value Share (%) and BPS Analysis by Product Format, 2025-2035
  • Figure 141: East Asia Market Y-o-Y Growth (%) Projections by Product Format, 2025-2035
  • Figure 142: East Asia Market Value (USD Million) Analysis by Sales Channel, 2020-2035
  • Figure 143: East Asia Market Volume (Units) Analysis by Sales Channel, 2020-2035
  • Figure 144: East Asia Market Value Share (%) and BPS Analysis by Sales Channel, 2025-2035
  • Figure 145: East Asia Market Y-o-Y Growth (%) Projections by Sales Channel, 2025-2035
  • Figure 146: East Asia Market Attractiveness by Ingredient Type, 2025-2035
  • Figure 147: East Asia Market Attractiveness by Health Function, 2025-2035
  • Figure 148: East Asia Market Attractiveness by Product Format, 2025-2035
  • Figure 149: East Asia Market Attractiveness by Sales Channel, 2025-2035
  • Figure 150: East Asia Market Attractiveness by Country, 2025-2035
  • Figure 151: South Asia & Pacific Market Value (USD Million) by Ingredient Type, 2025-2035
  • Figure 152: South Asia & Pacific Market Value (USD Million) by Health Function, 2025-2035
  • Figure 153: South Asia & Pacific Market Value (USD Million) by Product Format, 2025-2035
  • Figure 154: South Asia & Pacific Market Value (USD Million) by Sales Channel, 2025-2035
  • Figure 155: South Asia & Pacific Market Value (USD Million) by Country, 2025-2035
  • Figure 156: South Asia & Pacific Market Value (USD Million) Analysis by Country, 2020-2035
  • Figure 157: South Asia & Pacific Market Volume (Units) Analysis by Country, 2020-2035
  • Figure 158: South Asia & Pacific Market Value Share (%) and BPS Analysis by Country, 2025-2035
  • Figure 159: South Asia & Pacific Market Y-o-Y Growth (%) Projections by Country, 2025-2035
  • Figure 160: South Asia & Pacific Market Value (USD Million) Analysis by Ingredient Type, 2020-2035
  • Figure 161: South Asia & Pacific Market Volume (Units) Analysis by Ingredient Type, 2020-2035
  • Figure 162: South Asia & Pacific Market Value Share (%) and BPS Analysis by Ingredient Type, 2025-2035
  • Figure 163: South Asia & Pacific Market Y-o-Y Growth (%) Projections by Ingredient Type, 2025-2035
  • Figure 164: South Asia & Pacific Market Value (USD Million) Analysis by Health Function, 2020-2035
  • Figure 165: South Asia & Pacific Market Volume (Units) Analysis by Health Function, 2020-2035
  • Figure 166: South Asia & Pacific Market Value Share (%) and BPS Analysis by Health Function, 2025-2035
  • Figure 167: South Asia & Pacific Market Y-o-Y Growth (%) Projections by Health Function, 2025-2035
  • Figure 168: South Asia & Pacific Market Value (USD Million) Analysis by Product Format, 2020-2035
  • Figure 169: South Asia & Pacific Market Volume (Units) Analysis by Product Format, 2020-2035
  • Figure 170: South Asia & Pacific Market Value Share (%) and BPS Analysis by Product Format, 2025-2035
  • Figure 171: South Asia & Pacific Market Y-o-Y Growth (%) Projections by Product Format, 2025-2035
  • Figure 172: South Asia & Pacific Market Value (USD Million) Analysis by Sales Channel, 2020-2035
  • Figure 173: South Asia & Pacific Market Volume (Units) Analysis by Sales Channel, 2020-2035
  • Figure 174: South Asia & Pacific Market Value Share (%) and BPS Analysis by Sales Channel, 2025-2035
  • Figure 175: South Asia & Pacific Market Y-o-Y Growth (%) Projections by Sales Channel, 2025-2035
  • Figure 176: South Asia & Pacific Market Attractiveness by Ingredient Type, 2025-2035
  • Figure 177: South Asia & Pacific Market Attractiveness by Health Function, 2025-2035
  • Figure 178: South Asia & Pacific Market Attractiveness by Product Format, 2025-2035
  • Figure 179: South Asia & Pacific Market Attractiveness by Sales Channel, 2025-2035
  • Figure 180: South Asia & Pacific Market Attractiveness by Country, 2025-2035
  • Figure 181: MEA Market Value (USD Million) by Ingredient Type, 2025-2035
  • Figure 182: MEA Market Value (USD Million) by Health Function, 2025-2035
  • Figure 183: MEA Market Value (USD Million) by Product Format, 2025-2035
  • Figure 184: MEA Market Value (USD Million) by Sales Channel, 2025-2035
  • Figure 185: MEA Market Value (USD Million) by Country, 2025-2035
  • Figure 186: MEA Market Value (USD Million) Analysis by Country, 2020-2035
  • Figure 187: MEA Market Volume (Units) Analysis by Country, 2020-2035
  • Figure 188: MEA Market Value Share (%) and BPS Analysis by Country, 2025-2035
  • Figure 189: MEA Market Y-o-Y Growth (%) Projections by Country, 2025-2035
  • Figure 190: MEA Market Value (USD Million) Analysis by Ingredient Type, 2020-2035
  • Figure 191: MEA Market Volume (Units) Analysis by Ingredient Type, 2020-2035
  • Figure 192: MEA Market Value Share (%) and BPS Analysis by Ingredient Type, 2025-2035
  • Figure 193: MEA Market Y-o-Y Growth (%) Projections by Ingredient Type, 2025-2035
  • Figure 194: MEA Market Value (USD Million) Analysis by Health Function, 2020-2035
  • Figure 195: MEA Market Volume (Units) Analysis by Health Function, 2020-2035
  • Figure 196: MEA Market Value Share (%) and BPS Analysis by Health Function, 2025-2035
  • Figure 197: MEA Market Y-o-Y Growth (%) Projections by Health Function, 2025-2035
  • Figure 198: MEA Market Value (USD Million) Analysis by Product Format, 2020-2035
  • Figure 199: MEA Market Volume (Units) Analysis by Product Format, 2020-2035
  • Figure 200: MEA Market Value Share (%) and BPS Analysis by Product Format, 2025-2035
  • Figure 201: MEA Market Y-o-Y Growth (%) Projections by Product Format, 2025-2035
  • Figure 202: MEA Market Value (USD Million) Analysis by Sales Channel, 2020-2035
  • Figure 203: MEA Market Volume (Units) Analysis by Sales Channel, 2020-2035
  • Figure 204: MEA Market Value Share (%) and BPS Analysis by Sales Channel, 2025-2035
  • Figure 205: MEA Market Y-o-Y Growth (%) Projections by Sales Channel, 2025-2035
  • Figure 206: MEA Market Attractiveness by Ingredient Type, 2025-2035
  • Figure 207: MEA Market Attractiveness by Health Function, 2025-2035
  • Figure 208: MEA Market Attractiveness by Product Format, 2025-2035
  • Figure 209: MEA Market Attractiveness by Sales Channel, 2025-2035
  • Figure 210: MEA Market Attractiveness by Country, 2025-2035

Frequently Asked Questions

How big is the NAD Precursor Supplements Market in 2025?

The global NAD Precursor Supplements Market is estimated to be valued at USD 876.2 million in 2025.

What will be the size of the NAD Precursor Supplements Market in 2035?

The market size for the NAD Precursor Supplements Market is projected to reach USD 1,581.1 million by 2035.

How much will the NAD Precursor Supplements Market grow between 2025 and 2035?

The NAD Precursor Supplements Market is expected to grow at a CAGR of 6.1% between 2025 and 2035.

What are the key ingredient types in the NAD Precursor Supplements Market?

The key ingredient types in the NAD Precursor Supplements Market include Nicotinamide Mononucleotide (NMN), Nicotinamide Riboside (NR), Nicotinamide (Nam), Tryptophan, and Other Precursors or Blends.

Which ingredient type is projected to hold the highest share in 2025?

In terms of ingredient type, the NMN segment is expected to command a 45% share in the NAD Precursor Supplements Market in 2025.

Explore Similar Insights

Future Market Insights

NAD Precursor Supplements Market