The PAG Base Stock Market is estimated to be valued at USD 2.4 billion in 2025 and is projected to reach USD 5.4 billion by 2035, registering a compound annual growth rate (CAGR) of 8.5% over the forecast period.
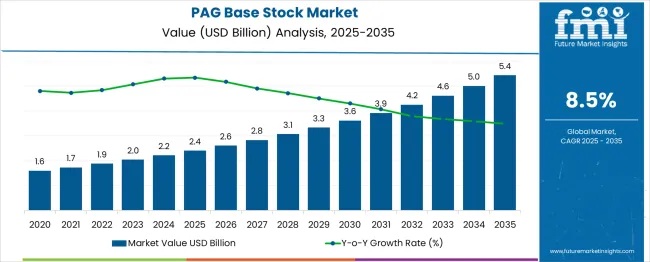
The PAG base stock market is undergoing significant growth driven by increasing demand for high-performance lubricants with superior thermal stability and biodegradability. Rising awareness about the environmental impact of conventional oils and the push for energy-efficient machinery are encouraging the shift toward PAG-based solutions.
Advances in synthetic lubrication technology and the emphasis on reducing maintenance costs and downtime in industrial and automotive sectors are further supporting adoption. The market outlook remains optimistic as regulatory policies promoting eco-friendly lubricants and the expanding industrial base create new opportunities.
Investments in research to enhance water resistance and oxidative stability in formulations are expected to widen application areas. Strong alignment with sustainability goals and operational efficiency requirements is paving the path for long-term market expansion and innovation.
The market is segmented by Type, Application, and End Use and region. By Type, the market is divided into Water Insoluble, Water Soluble, Mineral Oil Soluble, Random Copolymer, and Block Copolymer. In terms of Application, the market is classified into Gear Oils, Fire Resistant Hydraulic Fluids, Food Grade Lubricants, Compressor Oils, Wind Turbine Lubrication, Metalworking and Quenching Fluids, and Other Applications. Based on End Use, the market is segmented into in Industrial Equipment, in Automotive, in Aerospace, in Marine, in HVAC & Refrigeration, and Other. Regionally, the market is classified into North America, Latin America, Western Europe, Eastern Europe, Balkan & Baltic Countries, Russia & Belarus, Central Asia, East Asia, South Asia & Pacific, and the Middle East & Africa.
The market is segmented by Type, Application, and End Use and region. By Type, the market is divided into Water Insoluble, Water Soluble, Mineral Oil Soluble, Random Copolymer, and Block Copolymer. In terms of Application, the market is classified into Gear Oils, Fire Resistant Hydraulic Fluids, Food Grade Lubricants, Compressor Oils, Wind Turbine Lubrication, Metalworking and Quenching Fluids, and Other Applications. Based on End Use, the market is segmented into in Industrial Equipment, in Automotive, in Aerospace, in Marine, in HVAC & Refrigeration, and Other. Regionally, the market is classified into North America, Latin America, Western Europe, Eastern Europe, Balkan & Baltic Countries, Russia & Belarus, Central Asia, East Asia, South Asia & Pacific, and the Middle East & Africa.
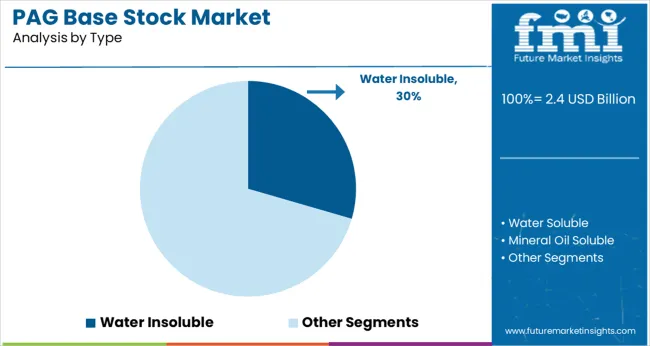
When segmented by type, water insoluble PAG base stocks are anticipated to account for 29.5% of the total market revenue in 2025, positioning it as the leading type segment. This leadership is attributed to their superior lubrication properties under extreme pressure and high-temperature conditions, which have made them particularly suitable for heavy-duty industrial and automotive applications.
Their inherent resistance to hydrolysis and compatibility with seals and metals have reinforced their preference in environments where moisture presence is minimal but operational demands are high. The ability to deliver longer drain intervals and reduced wear rates has also strengthened their appeal among end users seeking cost-effective and high-performance solutions.
As manufacturers continue to prioritize efficiency and longevity of equipment, water insoluble PAG base stocks are expected to retain their prominence in critical applications requiring dependable lubrication.
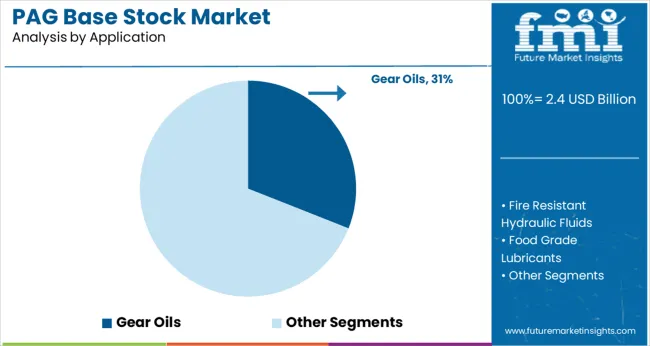
In terms of application, gear oils are projected to hold 31.0% of the market revenue in 2025, establishing themselves as the top application segment. This dominance is being driven by the growing need for gear systems to operate efficiently under higher loads and temperatures while maintaining reliability.
AG-based gear oils are being chosen for their exceptional film strength, reduced friction, and ability to withstand extreme operating environments without significant degradation. Their use has been further supported by operational goals to extend service life and minimize maintenance intervals, which are critical in manufacturing and energy production settings.
As industries increasingly demand lubricants that can handle both heavy-duty operations and environmental considerations, gear oils formulated with PAG base stocks continue to command a leading position due to their proven performance and durability.
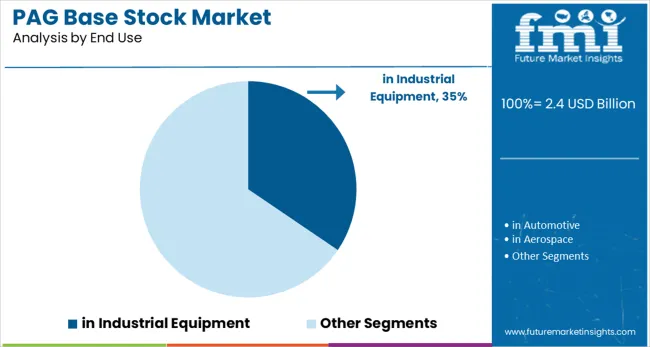
Segmenting by end use shows that industrial equipment is forecast to capture 34.5% of the market revenue in 2025, maintaining its role as the largest end-use segment. This prominence stems from the widespread application of PAG base stocks in compressors, hydraulics, and other industrial machinery where operational efficiency and equipment longevity are paramount.
Their ability to perform reliably under high loads and at elevated temperatures, coupled with lower volatility and excellent oxidative stability, has made them the preferred choice in industrial settings.
The focus on reducing total cost of ownership and ensuring uninterrupted production has further encouraged the use of PAG-based lubricants across a variety of equipment. As industries expand and adopt more advanced machinery, the demand for high-quality lubricants tailored to industrial environments is expected to sustain the dominance of this segment in the market.
According to market research and competitive intelligence provider FMI, the PAG base stock industry grew at a CAGR of 6.25% from 2020 to 2025. PAG oils provide excellent lubricity, excellent temperature stability, and a high natural viscosity index. Depending on the viscosity grade and the form of the base fluid, PAG base fluids can be obtained in water-soluble as well as water-insoluble forms.
As HVAC and refrigeration demand continues to grow globally, the PAG stock market will continue to benefit. Although fluids live for decades, their viscosity remains relatively stable. Due to their water tolerance, PAG oils may have higher water limits than hydrocarbon fluids. Globally, the market for PAG base oils will expand as countries focus on reducing carbon emissions.
According to reports, even during the pandemic crisis, spending on PAG base oil increased by over 6%. Following the pandemic, automotive production increased as the world returns to normalcy. The overall industry is expected to experience substantial gains in the future due to the expansion of business operations, growing innovations to reduce carbon emissions, and the growing awareness of the environment. According to forecasts, the PAG base stock market will grow at an 8.5% CAGR between 2025 and 2035.
With the rising demand for lubricants, both in the automotive industry as well as with the surge in demand for lubricants in electric cars, the lubricant market is expected to experience growth over the next few years. The increasing production of automobiles and the expansion of the automotive market are expected to positively impact the market development globally. The construction activities and infrastructural developments that have been taking place around the world are forecast to further drive the growth of the global construction market.
A number of factors are contributing to the rapid growth of the PAG base oil market. These factors include the scale of aircraft production, the popularity of travel and tourism, the booming business activities, and the need for textile items are all expected to contribute to the market demand. There is an increase in the demand from various end-use industries for high-performance lubricants, which can be attributed to the growth in the global PAG base oil market. Further, there are numerous environmental regulations that also contribute to the increased demand for PAG base oils all over the world.
Increasing Regulation to Reduce Global Warming Impacts is Likely to Boost Demand for Lubricants.
Government/industry research is being carried out on Advanced Petroleum Based Fuels - Diesel Emission Control (APBF-DEC) to develop low-emission diesel engines for the future. Anti-wear additives in lubricating oil are also suspected of causing diesel exhaust systems problems, similar to those for gasoline systems. According to forecasts, the market for base oils is expected to grow further due to increasing carbon emissions and environmental concerns.
The performance and durability of diesel emission control systems are being examined by a cooperative research project analyzing lubricant formulation (base stocks and additives). EMA, MECA, Engine Manufacturers Association, National Petrochemical & Refiners Association, American Chemistry Council, and various California regulatory agencies all contribute to the research funded by the Department of Energy's Office of FreedomCAR and Vehicle Technologies. A number of California regulatory agencies, as well as API, NPRA, and several petrochemical & refinery associations, also participate in the consortium.
Commercial and experimental lubricant additive systems were tested with four conventionally available lubricant base stocks. In order to determine the real impact of lubricant oil compositions, an experimental design was used to ensure that the formulations tested would be the most useful. Future lubricant formulations for light-duty and heavy-duty diesel engines will be shaped by the results of this study.
Price volatility and a decline in the base stock demand will stymie the sales
A high degree of volatility in prices and issues with the supply chain are expected to hamper the growth of the industry. As a result of the high availability of substitutes, the market is expected to decline further in the future.
As a result of the switch from internal combustion engines (ICEs)-powered cars to electric vehicles (EVs), the requirement for lubricants would be reduced, which, in turn, would reduce the demand for base stocks. Thus, base stock demand may decline in the short term, which would result in different API groups exhibiting different rates of growth or decline, depending on a variety of factors.
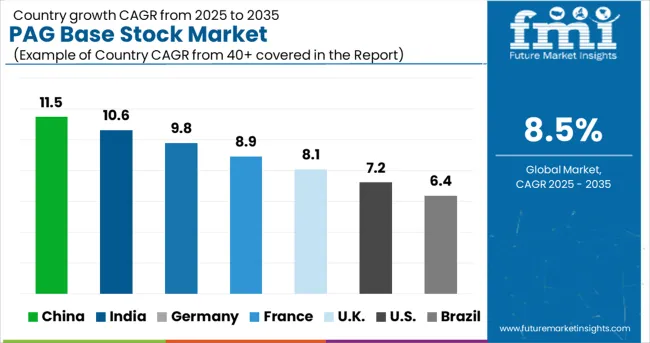
Polyalkylene glycol (PAG) Bases Oils have Grown Significantly in Popularity Because of Increasing Demand in the Automotive and Textile Industries.
The Asia Pacific region is expected to hold the largest market share for the PAG base stock market. According to forecasts, the market will capture 29% of the revenue share within the next few years.
PAG base lubricants are used by end users across multiple industries in large economies such as China, India, and Japan., Due to its rapid growth in the automobile and textile industries, China holds the largest market for PAG base stocks in the coming years. Therefore, this market is expected to increase in the coming years. Industrial production has increased in developing countries like India and China due to increased investment, which includes the use of PAG base oil in various industries.
For instance, China Electronic Information Industry Development expects to invest USD 1.4 trillion in new infrastructure and renewable energy projects from 2024 to 2025. As a result, PAG base stock markets are expected to grow in this region.
A rising economy and increasing disposable incomes in India are expected to boost the market for PAG base stock. For instance, Independent Truck Repair Group (iTRG) and Phillips 66 Lubricants teamed up for a national oil program in India. Through this new program, iTRG members will access special pricing, promotional materials, rebates, and enhanced education and technical support on Phillips 66 Company premium diesel products. This will bring more customers to Phillips 66 Company.
Carbon Emissions Regulations and Infrastructure Projects to Grow the Market
Between 2025 and 2035, the North American PAG base stock market is anticipated to exhibit a compound annual growth rate of 6.2% during the forecast period. A significant increase in commercial travel is expected to lead to a rise in the demand for PAG base stocks in the market. Due to the increasing infrastructure needs, the market demand for commercial spaces is also expected to grow the market for PAG base stocks. A growing presence of key industry players in this region is anticipated to drive market growth.
A stringent government regulation on carbon emissions, as well as a growing demand for high-end cars in this region, are expected to result in an increase in demand for PAG base stock in the future. For instance, In January 2024, BASF SE entered into an agreement with China Bluecchemical Limited Company (China BlueChemical). This partnership aims to reduce greenhouse gas emissions by improving the efficiency of the production processes, as well as improving the efficiency of carbon offsetting. By introducing this new product, BASF SE aims to attract a broader range of customers.
Rising Demand for Compressed Oils in Automotives is Expected to enhance the demand for PAG Base Oil
Based on application type the PAG base stock market is segmented into gear oils, fire-resistant hydraulic fluids, food-grade lubricants, compressor oils, wind turbine lubricants, metalworking and quenching fluids, and other applications. According to the forecast, the compressed oil segment will hold the largest revenue share of 38.5% from 2025 to 2035. Due to the reduction of wear and tear on rotating parts and the prevention of metals from rubbing against metal, the market for this product is expected to grow during the forecast period.
Several industries are contributing to the growth, including manufacturing, oil & gas, automotive, and power industries, which are all contributing to the growth. It is expected that the high demand for compressor oil will be largely driven by the need to lubricate compressors in order to ensure their proper performance during the forecast period as lubrication remains a significant factor fueling the market.
Bio-based compressor oil is also expected to see an increase in demand. The low carbon emissions of this oil make it a great option in areas with strict regulations. As the compressor oil market continues to develop, biobased oil is expected to remain a key factor.
Increasing Demand for Automotive is Expected to Boost PAG Base Oil Markets
According to the end-use segment, the automotive segment of the PAG base stock market is anticipated to grow at over 6.8% CAGR from 2025 to 2035. In 2025, PAG oil will see a boost in demand due to its ability to decrease friction and wear in automotive engines. The growing production demand for automobiles globally will continue to drive growth in the market in the near future.
As an engine oil, PAG base oil assists in controlling friction and wear of automotive engines and is used as compressor oil in combination with polyether in vehicles' air conditioning systems. Additionally, it plays an important role in controlling friction and wears in braking, clutching, and power steering systems.
A higher standard of living, more disposable income and rapid urbanization all contributed to the growth of the automobile market, which in turn brought about a rise in vehicle sales in the market. Automobile production is expected to pick up pace in developing economies, which will also lead to continued demand for PAGs.
How does the New Entrant Affect the PAG Base Stock Market?
As startup companies enter the market, they use lubricants in a wide range of applications to satisfy the demands of consumers. As innovative technologies emerge on the market, PAG base stock is becoming increasingly prominent in automobiles and textiles, making them more innovative and useful to consumers in the market. The market for bio-based oils for automotive parts has recently been flooded with startups that offer their products.
Some of the start-ups in the PAG base stock market include-
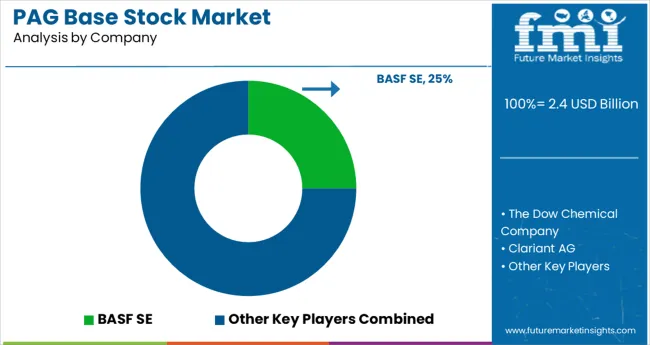
Major players in the PAG base oil market aim to meet consumer demands by offering innovative products. New products are being launched by leading manufacturers in collaboration with reputed brands in order to reach a broader audience. Researchers and developers are constantly developing innovative solutions to reduce carbon emissions for specific end uses.
| Report Attribute | Details |
|---|---|
| Growth Rate (2025 to 2035) | 8.5% |
| Expected Market Value (2025) | USD 2.4 billion |
| ProjectedForecast Value (2035) | USD 5.4 billion |
| Base Year for Estimation | 2025 |
| Historical Data | 2020 to 2025 |
| Forecast Period | 2025 to 2035 |
| Quantitative Units | Revenue in million and CAGR from 2025 to 2035 |
| Report Coverage | Revenue Forecast, Volume Forecast, Company Ranking, Competitive Landscape, Growth Factors, Trends, and Pricing Analysis |
| Segments Covered | Type, Application, End Use, Region |
| Regions Covered | North America; Latin America; Europe; Asia Pacific; Middle East and Africa (MEA) |
| Key Countries Profiled | USA, Canada, Brazil, Mexico, Germany, United Kingdom, France, Spain, Italy, Rest of Europe, China, Japan, South Korea, Singapore, Thailand, Indonesia, Australia, New Zealand, Rest of Asia Pacific, GCC Countries, South Africa, Israel, Rest of MEA |
| Key Companies Profiled | BASF SE; The Dow Chemical Company; Clariant AG; Idemitsu Kosan Co., Ltd.; Printed Circuit Board (PCC) Group; Fuchs Group; Croda International Plc; Exxon Mobil Corporation; Technical Lubricants International B.V.; Shandong Shing Chemical Co., Ltd. |
| Customization | Available Upon Request |
The global pag base stock market is estimated to be valued at USD 2.4 billion in 2025.
It is projected to reach USD 5.4 billion by 2035.
The market is expected to grow at a 8.5% CAGR between 2025 and 2035.
The key product types are water insoluble, water soluble, mineral oil soluble, random copolymer and block copolymer.
gear oils segment is expected to dominate with a 31.0% industry share in 2025.


Our Research Products

The "Full Research Suite" delivers actionable market intel, deep dives on markets or technologies, so clients act faster, cut risk, and unlock growth.

The Leaderboard benchmarks and ranks top vendors, classifying them as Established Leaders, Leading Challengers, or Disruptors & Challengers.

Locates where complements amplify value and substitutes erode it, forecasting net impact by horizon

We deliver granular, decision-grade intel: market sizing, 5-year forecasts, pricing, adoption, usage, revenue, and operational KPIs—plus competitor tracking, regulation, and value chains—across 60 countries broadly.

Spot the shifts before they hit your P&L. We track inflection points, adoption curves, pricing moves, and ecosystem plays to show where demand is heading, why it is changing, and what to do next across high-growth markets and disruptive tech

Real-time reads of user behavior. We track shifting priorities, perceptions of today’s and next-gen services, and provider experience, then pace how fast tech moves from trial to adoption, blending buyer, consumer, and channel inputs with social signals (#WhySwitch, #UX).

Partner with our analyst team to build a custom report designed around your business priorities. From analysing market trends to assessing competitors or crafting bespoke datasets, we tailor insights to your needs.
Supplier Intelligence
Discovery & Profiling
Capacity & Footprint
Performance & Risk
Compliance & Governance
Commercial Readiness
Who Supplies Whom
Scorecards & Shortlists
Playbooks & Docs
Category Intelligence
Definition & Scope
Demand & Use Cases
Cost Drivers
Market Structure
Supply Chain Map
Trade & Policy
Operating Norms
Deliverables
Buyer Intelligence
Account Basics
Spend & Scope
Procurement Model
Vendor Requirements
Terms & Policies
Entry Strategy
Pain Points & Triggers
Outputs
Pricing Analysis
Benchmarks
Trends
Should-Cost
Indexation
Landed Cost
Commercial Terms
Deliverables
Brand Analysis
Positioning & Value Prop
Share & Presence
Customer Evidence
Go-to-Market
Digital & Reputation
Compliance & Trust
KPIs & Gaps
Outputs
Full Research Suite comprises of:
Market outlook & trends analysis
Interviews & case studies
Strategic recommendations
Vendor profiles & capabilities analysis
5-year forecasts
8 regions and 60+ country-level data splits
Market segment data splits
12 months of continuous data updates
DELIVERED AS:
PDF EXCEL ONLINE
PAG Compressor Oil Market Size and Share Forecast Outlook 2025 to 2035
Champagne Market Analysis by Price Range, Sales Channel, and Region Through 2035
Landing Page Builders Market Analysis - Size, Share, and Forecast 2025 to 2035
Wireless Paging Systems Market Size and Share Forecast Outlook 2025 to 2035
USA Landing Page Builders Market Analysis – Size, Trends & Forecast 2025-2035
India Landing Page Builders Market Trends – Growth, Demand & Forecast 2025-2035
Thumb Hole Book Page Holder Market Size and Share Forecast Outlook 2025 to 2035
Germany Landing Page Builders Market Trends – Growth, Demand & Forecast 2025-2035
Base Editing Market Size and Share Forecast Outlook 2025 to 2035
Base Transceiver Station (BTS) Market Size and Share Forecast Outlook 2025 to 2035
Base Paper Market Size and Share Forecast Outlook 2025 to 2035
Base Station Antenna Market Insights - Size, Share & Growth Forecast 2025 to 2035
Base Station Analyser Market Report – Growth & Forecast 2019-2027
AI-Based Data Observability Software Market Size and Share Forecast Outlook 2025 to 2035
Biobased Binder for Nonwoven Market Size and Share Forecast Outlook 2025 to 2035
Si-based Hall Effect Sensors Market Size and Share Forecast Outlook 2025 to 2035
AI-based 3D reconstruction Tools Market Size and Share Forecast Outlook 2025 to 2035
AI based Triage Tools Market Size and Share Forecast Outlook 2025 to 2035
Ph Based Lip Balm Market Size and Share Forecast Outlook 2025 to 2035
AI-Based Driving Systems (L2 to L5) Market Analysis - Size, Share, and Forecast Outlook 2025 to 2035

Thank you!
You will receive an email from our Business Development Manager. Please be sure to check your SPAM/JUNK folder too.
Chat With
MaRIA