The Philippines tourism industry is expanding steadily due to the country’s rich cultural diversity, natural attractions, and strategic government initiatives to promote sustainable tourism. Growth is being driven by enhanced connectivity, increasing disposable incomes, and rising demand for experiential travel among both domestic and international tourists. The current market environment is marked by the integration of digital booking platforms, infrastructure development in key tourist destinations, and supportive regulatory frameworks.
Improved airport facilities, coastal preservation programs, and investment in hospitality infrastructure have strengthened the nation’s tourism competitiveness. The future outlook remains positive as digital transformation, targeted marketing campaigns, and public-private partnerships continue to attract travelers.
Growth rationale is based on the rising preference for cultural exploration, the widespread adoption of online booking systems, and the increasing contribution of domestic tourism to the national economy These combined factors are expected to ensure consistent expansion, enhance service quality, and solidify the Philippines as a leading tourism destination in Southeast Asia.

| Metric | Value |
|---|---|
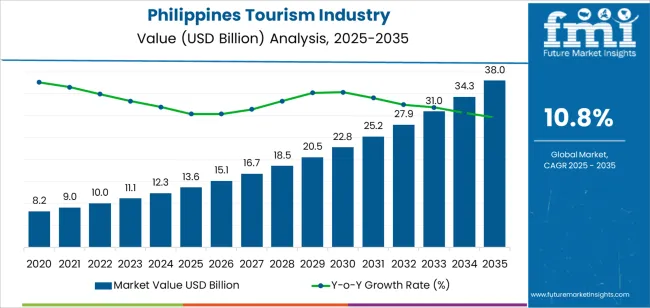
| Philippines Tourism Industry Estimated Value in (2025 E) | USD 13.6 billion |
| Philippines Tourism Industry Forecast Value in (2035 F) | USD 38.0 billion |
| Forecast CAGR (2025 to 2035) | 10.8% |
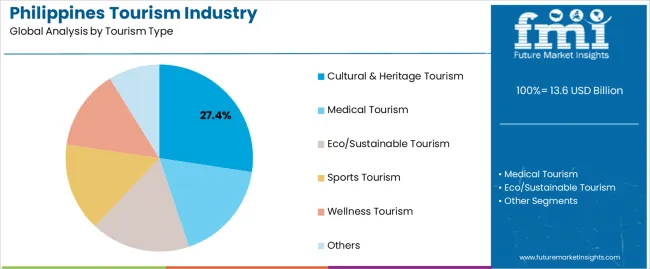
The market is segmented by Tourism Type, Booking Channel, Tourist Type, and Age Group and region. By Tourism Type, the market is divided into Cultural & Heritage Tourism, Medical Tourism, Eco/Sustainable Tourism, Sports Tourism, Wellness Tourism, and Others. In terms of Booking Channel, the market is classified into Online Booking, Phone Booking, and In Person Booking. Based on Tourist Type, the market is segmented into Domestic and International. By Age Group, the market is divided into 26-35 Years, 15-25 Years, 36-45 Years, 46-55 Years, and 66-75 Years. Regionally, the market is classified into North America, Latin America, Western Europe, Eastern Europe, Balkan & Baltic Countries, Russia & Belarus, Central Asia, East Asia, South Asia & Pacific, and the Middle East & Africa.

The cultural and heritage tourism segment, accounting for 27.40% of the tourism type category, has been leading due to the Philippines’ diverse traditions, historical landmarks, and vibrant local festivals. Sustained interest in authentic cultural experiences has strengthened its dominance, supported by government efforts to preserve and promote heritage sites.
Infrastructure upgrades around cultural destinations and strategic collaboration with local communities have enhanced tourist satisfaction. The segment’s resilience has been reinforced by the global trend toward meaningful travel, where visitors seek immersive, educational experiences.
Marketing initiatives highlighting the country’s cultural richness have increased visibility across global travel markets Continued investment in heritage conservation and cultural event promotion is expected to support further growth, ensuring long-term relevance and economic contribution from this segment.

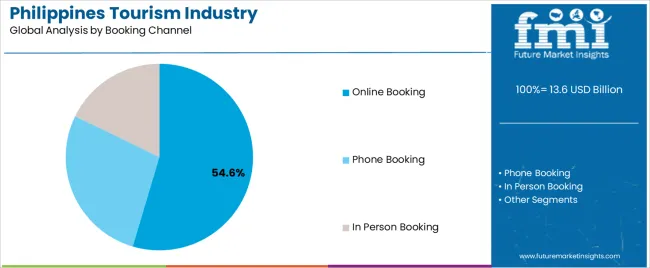
The online booking segment, holding 54.60% of the booking channel category, has maintained its leadership as travelers increasingly rely on digital platforms for convenience, price comparison, and real-time availability. The rapid expansion of internet access and mobile technology has enabled seamless booking experiences, while the presence of major travel aggregators and apps has simplified itinerary management.
The pandemic accelerated digital adoption, further solidifying this channel’s dominance. Enhanced payment security, customer review systems, and promotional discounts have reinforced consumer trust and usage frequency.
Tourism operators and hospitality providers are increasingly integrating AI-driven recommendation tools and chat-based support to improve engagement As digital literacy continues to grow across the Philippines, the online booking segment is expected to remain the preferred choice, driving efficiency and expanding market reach.

The domestic tourist segment, representing 61.80% of the tourist type category, has emerged as the dominant contributor to the Philippines tourism industry. Strong local demand has been supported by affordability, shorter travel distances, and increased government promotion of regional attractions.
The segment’s strength lies in consistent year-round travel, driven by cultural events, local holidays, and family-oriented tourism. Economic recovery post-pandemic has encouraged greater domestic mobility, while initiatives such as travel vouchers and infrastructure development have boosted participation.
Enhanced accessibility to provincial destinations through improved transport networks has further supported growth Continued emphasis on regional tourism promotion and the introduction of affordable travel packages are expected to sustain domestic travel momentum, ensuring stability and resilience within the broader tourism landscape.
The Philippine economy relies a lot on tourism. Many people like to travel to the Philippines to enjoy its peaceful atmosphere and delicious food. Tourists especially love the Philippines because there are many tasty foods and beverages to choose from. Social media is making more people interested in culinary tourism in the Philippines.
In June 2025, the Philippines introduced its new tourism campaign called "Love the Philippines." It changed it from "It's More Fun in the Philippines" to focus more on real and deep experiences after the pandemic.
On Facebook, Twitter, and Instagram, travel influencers are showing off beautiful places and travel services online. Tourism companies are also putting ads there to reach more people. Consequently, there is likely to be around a 2.8X surge in the sales of tourism in the Philippines by 2035.
Hoteliers are using apps more to manage visitor services, giving them better control over the visitor experience. Also, services like digital check-in and contactless cards are getting popular, while facial and fingerprint verification help with payments and record keeping. This is boosting sales in the Philippines' hospitality industry.
In the Philippines, there are lots of different things to do for eco/sustainable tourism. People can join community activities in the Philippines, like fixing houses, planting mangroves, or helping with schools. They can also teach new skills or work on projects like building a visitor center or fixing up a forest.
From 2020 to 2025, the Philippines tourism industry showed promising growth, boasting a 9.80% CAGR. Hotels in Metro Manila are getting better after the pandemic, with 13.6 million tourists visiting in the first nine months of 2025.
That is almost twice as many as in 2025 and close to the year-end target set by the Department of Tourism. Tourists have already added USD 5.7 billion to the economy.
| Attributes | Quantitative Outlook |
|---|---|
| Philippines Tourism Industry Size (2025) | USD 11.13 billion |
| Historical CAGR (2020 to 2025) | 9.80% |
Prices are still not as high as before the pandemic, and more places to stay are being made. If the government and cities with lots of future places to stay do well economically, more people might want to stay there, and the places might get fuller.
More hotels are being built, with 6,13.600 new rooms expected by 2029, mostly in Quezon City and Pasay City. This trend is expected to contribute to the positive outlook of the Philippines tourism industry.
Social media is helping the tourism industry in the Philippines grow. Travel influencing is the new buzzword in the market. Travel influencers visit different places to promote tourism, and the Philippines is no exception.
They now share the real footage of places and their experience on platforms like Facebook, Twitter, and Instagram, and tourism companies advertise there too. In the Philippines, there are 86.75 million active people using social media.
As social media platforms are proliferating more day by day, it is expected to help the industry develop more during the forecast period.
In October 2025, the Department of Tourism (DOT) in the Philippines changed the entry rule for travelers with the e-Arrival Card system. This system is easier because it does not need a mobile app and asks for less information. Also, by the end of 2025, the government plans to start a VAT Refund Program to give back VAT on things tourists take out of the country.
DOT started the "Tourism Champions Challenge" to help cities and towns with tourism, giving them USD 3.2 million. Overseas Filipino Workers (OFWs) who bring foreign tourists to the country can win prizes in a raffle called "Bisita, Be My Guest."
Therefore, the future of the Philippines tourism and hotel market looks bright. Hotels in the Philippines are getting better, with more people coming, owing to promotions and help from the government.
As far as the tourist type is concerned, the domestic segment is likely to perform better in 2025, holding 58.00% of the Philippines tourism industry share. Similarly, the 26 to 35 years segment is expected to generate significant turnover in terms of age group, possessing a 47.00% revenue share of the tourism industry in the Philippines in 2025.
| Segment | Estimated Industry Share in 2025 |
|---|---|
| Domestic Tourist | 58.00% |
| 26 to 35 Years Age Group | 47.00% |
The domestic traveler segment is likely to become the prime revenue generator within the industry. The main reason Philippine tourism is bouncing back is because more people are traveling within the country. In 2025, most overnight travelers were locals, with around 40 million visitors.
People prefer to visit their own country nowadays because they know about their own culture and interesting places there. Individuals also find domestic traveling cost-effective as it does not necessitate the huge amount of money required for trips abroad or getting visas. These travelers often know people and have friends in the places they visit, so they can do special things that they may not be able to do outside.
The 26 to 35 age group is the top segment in the industry. The main reason this segment is growing is because individuals belonging from this age group have enough money to travel. They are financially stable, so they can go wherever they want, whether it is within their own country or abroad.
People aged 26 to 35 like to travel because they want special and unforgettable experiences in each place they go. They really want to explore different tourist spots and are excited about seeing adventure sites. People in this group also enjoy adventurous activities like scuba diving and exploring different islands, which are easy to find in the Philippines.

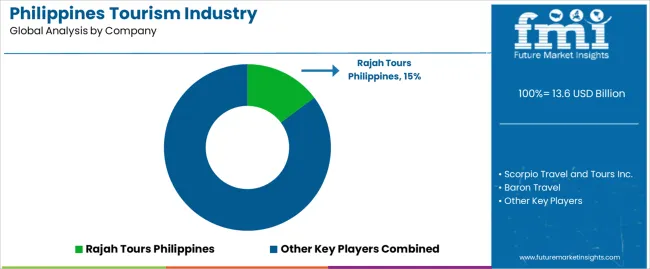
Tourism industry players in the Philippines employ miscellaneous strategies to get a competitive edge. Some players give high priority to enhancing infrastructure for smoother travel experiences. At the same time, many prioritize industry to showcase natural beauty and cultural richness.
Some adopt sustainable practices to attract tourists who are extremely concerned about the environment. While others collaborate with the government to leverage policies for tourism promotion. Many make substantial investments in digital platforms for convenient traveler services.
Recent Developments
The global philippines tourism industry is estimated to be valued at USD 13.6 billion in 2025.
The market size for the philippines tourism industry is projected to reach USD 38.0 billion by 2035.
The philippines tourism industry is expected to grow at a 10.8% CAGR between 2025 and 2035.
The key product types in philippines tourism industry are cultural & heritage tourism, medical tourism, eco/sustainable tourism, sports tourism, wellness tourism and others.
In terms of booking channel, online booking segment to command 54.6% share in the philippines tourism industry in 2025.


Our Research Products

The "Full Research Suite" delivers actionable market intel, deep dives on markets or technologies, so clients act faster, cut risk, and unlock growth.

The Leaderboard benchmarks and ranks top vendors, classifying them as Established Leaders, Leading Challengers, or Disruptors & Challengers.

Locates where complements amplify value and substitutes erode it, forecasting net impact by horizon

We deliver granular, decision-grade intel: market sizing, 5-year forecasts, pricing, adoption, usage, revenue, and operational KPIs—plus competitor tracking, regulation, and value chains—across 60 countries broadly.

Spot the shifts before they hit your P&L. We track inflection points, adoption curves, pricing moves, and ecosystem plays to show where demand is heading, why it is changing, and what to do next across high-growth markets and disruptive tech

Real-time reads of user behavior. We track shifting priorities, perceptions of today’s and next-gen services, and provider experience, then pace how fast tech moves from trial to adoption, blending buyer, consumer, and channel inputs with social signals (#WhySwitch, #UX).

Partner with our analyst team to build a custom report designed around your business priorities. From analysing market trends to assessing competitors or crafting bespoke datasets, we tailor insights to your needs.
Supplier Intelligence
Discovery & Profiling
Capacity & Footprint
Performance & Risk
Compliance & Governance
Commercial Readiness
Who Supplies Whom
Scorecards & Shortlists
Playbooks & Docs
Category Intelligence
Definition & Scope
Demand & Use Cases
Cost Drivers
Market Structure
Supply Chain Map
Trade & Policy
Operating Norms
Deliverables
Buyer Intelligence
Account Basics
Spend & Scope
Procurement Model
Vendor Requirements
Terms & Policies
Entry Strategy
Pain Points & Triggers
Outputs
Pricing Analysis
Benchmarks
Trends
Should-Cost
Indexation
Landed Cost
Commercial Terms
Deliverables
Brand Analysis
Positioning & Value Prop
Share & Presence
Customer Evidence
Go-to-Market
Digital & Reputation
Compliance & Trust
KPIs & Gaps
Outputs
Full Research Suite comprises of:
Market outlook & trends analysis
Interviews & case studies
Strategic recommendations
Vendor profiles & capabilities analysis
5-year forecasts
8 regions and 60+ country-level data splits
Market segment data splits
12 months of continuous data updates
DELIVERED AS:
PDF EXCEL ONLINE
Tourism Industry Analysis in Japan - Size, Share, & Forecast Outlook 2025 to 2035
Tourism Industry Big Data Analytics Market Analysis by Application, by End, by Region – Forecast for 2025 to 2035
Assessing Tourism Industry Loyalty Program Market Share & Industry Trends
Tourism Industry Loyalty Programs Sector Analysis by Program Type by Traveler Profile by Region - Forecast for 2025 to 2035
BRICS Tourism Industry Analysis Size and Share Forecast Outlook 2025 to 2035
Italy Tourism Market Analysis – Growth & Industry Trends 2024-2034
Philippines Culinary Tourism Market Analysis – Growth & Forecast 2025 to 2035
Greece Tourism Market Insights – Growth & Forecast 2024-2034
Leading Providers & Market Share in Virtual Tourism Industry
Asia-Pacific Religious Tourism Market Growth – Forecast 2024-2034
Industry Analysis of Outbound Tourism in Germany Size and Share Forecast Outlook 2025 to 2035
Market Share Distribution Among Theme Park Tourism Providers
European Union Tourism Industry Size and Share Forecast Outlook 2025 to 2035
Sales Analysis of Tourism Industry in the Middle East Size and Share Forecast Outlook 2025 to 2035
Thailand Culinary Tourism Market Trends – Growth & Forecast 2024-2034
Industry Analysis of Syringe and Needle in GCC Size and Share Forecast Outlook 2025 to 2035
Tourism Independent Contractor Model Market Size and Share Forecast Outlook 2025 to 2035
Industry Analysis Non-commercial Acrylic Paint in the United States Size and Share Forecast Outlook 2025 to 2035
Industry Analysis of Medical Device Packaging in Southeast Asia Size and Share Forecast Outlook 2025 to 2035
Industry Analysis of Paper Bag in North America Size and Share Forecast Outlook 2025 to 2035

Thank you!
You will receive an email from our Business Development Manager. Please be sure to check your SPAM/JUNK folder too.
Chat With
MaRIA