Physical-Digital Integration Market Size and Share Forecast Outlook 2025 to 2035

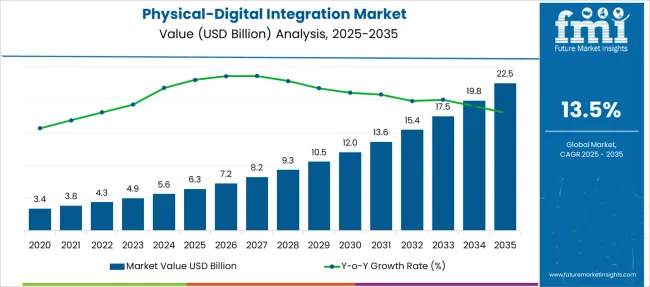
The Physical-Digital Integration Market is estimated to be valued at USD 6.3 billion in 2025 and is projected to reach USD 22.5 billion by 2035, registering a compound annual growth rate (CAGR) of 13.5% over the forecast period.
Quick Stats for Physical-Digital Integration Market

  • Physical-Digital Integration Market Industry Value (2025): USD 6.3 billion
  • Physical-Digital Integration Market Forecast Value (2035): USD 22.5 billion
  • Physical-Digital Integration Market Forecast CAGR: 13.5%
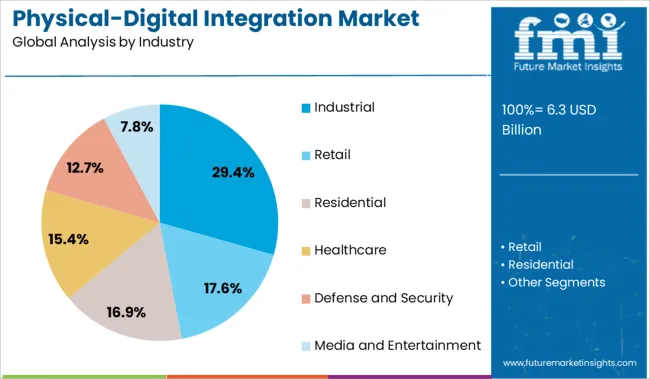
  • Leading Segment in Physical-Digital Integration Market in 2025: Industrial (29.4%)
  • Key Growth Region in Physical-Digital Integration Market: North America, Asia-Pacific, Europe
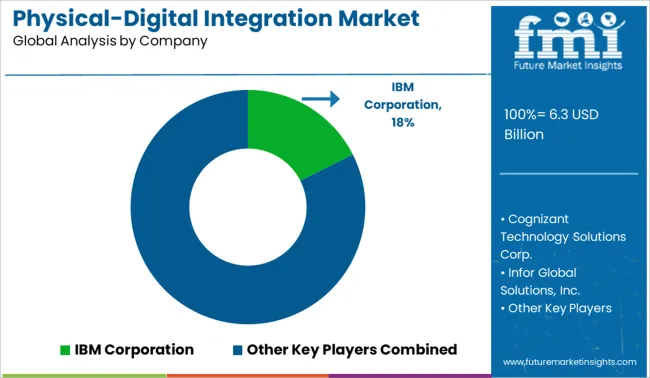
  • Top Key Players in Physical-Digital Integration Market: IBM Corporation, Cognizant Technology Solutions Corp., Infor Global Solutions, Inc., Infosys Ltd., Oracle Corporation, Salesforce.com, Inc., SAP SE, Toshiba Corporation, AeroFarms, AVA Technologies Inc.

Physical Digital Integration Market Market Value Analysis

Metric Value
Physical-Digital Integration Market Estimated Value in (2025 E) USD 6.3 billion
Physical-Digital Integration Market Forecast Value in (2035 F) USD 22.5 billion
Forecast CAGR (2025 to 2035) 13.5%

Rationale for Segmental Growth in the Physical-Digital Integration Market

The physical-digital integration market is witnessing significant traction as industries across sectors seek real-time data synchronization between physical operations and digital ecosystems. Growing investments in Industrial Internet of Things (IIoT), sensor-based automation, and digital twin technologies are driving adoption across manufacturing and infrastructure.

Enhanced regulatory frameworks encouraging predictive maintenance, energy efficiency, and process visibility have created a robust environment for deployment. The convergence of cloud, edge computing, and AI-powered analytics has further enabled faster and more intelligent decision-making, reducing operational downtime and enhancing throughput.

Organizations are also leveraging physical-digital convergence to ensure traceability, enhance product quality, and comply with ESG mandates. As supply chains and factory floors become increasingly interconnected, the market is expected to expand across legacy systems through integration retrofits and next-gen deployments, positioning it as a foundational pillar of Industry 4.0 transformation strategies.

Segmental Analysis

The market is segmented by Industry and region. By Industry, the market is divided into Industrial, Retail, Residential, Healthcare, Defense and Security, and Media and Entertainment. Regionally, the market is classified into North America, Latin America, Western Europe, Eastern Europe, Balkan & Baltic Countries, Russia & Belarus, Central Asia, East Asia, South Asia & Pacific, and the Middle East & Africa.
Insights into the Industrial Industry Segment:

Physical Digital Integration Market Analysis By Industry

The industrial segment is projected to account for 29.4% of the total revenue in the physical-digital integration market by 2025, making it the leading vertical. This dominance is being driven by the sector’s increasing reliance on smart manufacturing frameworks, machine-level automation, and cyber-physical systems.

Integration of real-time sensor networks with ERP and MES systems is enabling improved asset utilization, energy management, and quality control. Operational demands for predictive analytics, remote equipment monitoring, and process optimization have accelerated the deployment of digital twins and augmented reality tools.

Industrial players are prioritizing digital transformation to enhance resilience, reduce downtime, and meet global compliance standards. The growing need for scalable, interoperable systems that unify factory data with enterprise workflows has reinforced the industrial sector's leadership in the adoption of physical-digital integration technologies.

Key Drivers In The Physical-Digital Integration Market

The analysts at FMI have analyzed various elements that are likely to boost the growth of the physical-digital integration market in the coming years and unravel a positive dimension of the concerned market.

These elements are as follows:

  • Rising penetration of digital devices, such as mobile phones, 4G smartphones, LED televisions, and various hi-tech appliances, is propelling the demand for the physical-digital integration market.
  • Further, the market is being catalyzedcatalyzed by the growing demand for physical-digital integration applications in various industries, such as healthcare, retail, industrial, and defense and security, among others.
  • Presently, retail stores are observing high demand for physical-digital integration due to the growing need to balance retail shops and online stores by integrating retail shops with the Internet of Things (IoT). This, along with the growing trend of personalization, is boosting the demand for retail innovation, such as self-serve kiosks, to engage customers with interactive experiences.
  • Moreover, the extending applications within the market, including artificial intelligence, machine learning, voice-activated commerce, virtual and augmented reality, and mobile commerce, are anticipated to spur market growth in the years to come.
  • The market is predicted to witness further growth over the forecast period on account of rising investments in the market due to lucrative growth potential.

Factors Restraining The Expansion Of The Physical-Digital Integration Market

Besides the factors bolstering the growth of the physical-digital integration market, the expert analysts at FMI have also identified some elements that are likely to hinder the pace of advancement in the long run. They are as follows:

  • The market growth may inhibit in the forecast period due to difficulties and complexity in the management of back-end activities.

Further, cyberattacks and data breaches are some of the limiting factors that might provide hurdles in the growth of the market in the upcoming years.
Regional Outlook

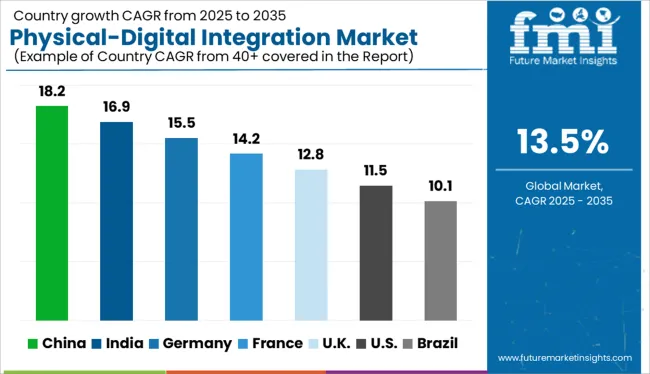
Physical Digital Integration Market Cagr Analysis By Country

Growth Prospect of Physical-Digital Integration in Regional Markets

Statistics:

Region Statistics
North America North America is projected to dominate the global physical-digital integration market through 2035. At present, this region is accountable for a market share of 30.1% globally.
Europe Europe is projected to hold the second-largest share in the global physical-digital integration market after North America. Currently, the European region is accountable for a market share of 23.7% in 2025.
Asia Pacific The Asia Pacific region is projected to witness rapid growth in the global physical-digital integration market over the forecast period.

Responsible Factors:

Region Responsible Factors
North America The factors attributing to the rising market size for physical-digital integration in North America are:
  • Heightened adoption of technology and increasing innovations in this region are fueling market growth.
  • The presence of key market players in North America is projected to aid the growth of the forum.
Europe Key elements bolstering the market size in Europe can be identified:
  • The rising proliferation of smart devices, such as smartphones and tablets, in the region, is expected to facilitate market growth.
  • Growing awareness regarding the significance of the physical presence of retailers and brands to catapult their e-commerce sales, thereby boosting the demand for physical-digital integration solutions, like self-serve kiosks.
Asia Pacific The aspects fueling the growth of the physical-digital integration market in the Asia Pacific region are:
  • Rapid urbanization and expanding consumer base in the region are propelling the demand for physical-digital integration.
  • The region is further considered a lucrative market for the expansion of key players, thus offering a high growth rate over the forecast period.

Competitive Landscape

Physical Digital Integration Market Analysis By Company

Biggies Revolutionizing the Market

The physical-digital integration market is thriving due to the increasing demand for solutions that deliver refined interactive customer experiences. The demand for these solutions gained momentum in recent years and is expected to expand exponentially over the forecast period. Physical-digital integration has been witnessing demand in numerous end-use industries, including retail, residential, industrial, healthcare, and defense and security, among others.

In the healthcare system, the emphasis is being laid upon the interconnection of virtual and physical space to offer new health solutions around remote care, well-being, smart homes, and communities., thereby accelerating the demand for physical-digital integration in the respective sector.

Likewise, the rising demand for these solutions in the retail sector to integrate digital and physical retail formats and offer personalized customer experiences is providing abundant stimulus to the market growth. Further, the investments in physical spaces by e-commerce retailers like Amazon are rising, consequently tapping into the gigantic uncharted potential for unattended retail.

Recent developments in the market include:

  • In February 2025, Infosys, a leading player offering next-gen digital services and consulting, announced the launch of Infosys metaverse foundry that will facilitate and fast-track the exploration of metaverse by enterprises for their customers, products, workplace, and operations. With this launch, the company aims to elevate the enterprises’ ability to execute dynamic strategies for virtual-physical interconnections.
  • In November 2020, Starbucks launched its entire pickup-only store, which is situated in New York City’s Penn Plaza. This allows the customers to place orders and then make payments using the mobile app of the company. Customers are informed regarding the product status via a digital status board, which is placed inside the store.

Some of the key companies in the market are:

Report Scope

Report Attribute Details
Growth Rate CAGR of 13.5% from 2025 to 2035
Base Year for Estimation 2024
Historical Data 2020 to 2024
Forecast Period 2025 to 2035
Quantitative Units Revenue in USD million and CAGR from 2025 to 2035
Report Coverage Revenue Forecast, Volume Forecast, Company Ranking, Competitive Landscape, Growth Factors, Trends, and Pricing Analysis
Segments Covered Industry, Region
Regions Covered North America; Latin America; Europe; East Asia; South Asia; Oceania; Middle East and Africa
Key Countries Profiled USA, Canada, Brazil, Argentina, Germany, United Kingdom, France, Spain, Italy, Nordics, BENELUX, Australia & New Zealand, China, India, ASIAN, GCC Countries, South Africa
Key Companies Profiled Cognizant Technology Solutions Corp.; IBM Corporation; Infor Global Solutions, Inc.; Infosys Ltd.,; Oracle Corporation, Salesforce.com, Inc.; SAP SE; Toshiba Corporation
Customization Available Upon Request

Key Segments In The Physical-Digital Integration Market

By Industry:

  • Retail
  • Residential
  • Industrial
  • Healthcare
  • Defense and Security
  • Media and Entertainment

By Region:

  • North America
  • Latin America
  • Asia Pacific
  • Middle East and Africa(MEA)
  • Europe

Table of Content

  1. Executive Summary
    • Global Market Outlook
    • Demand-side Trends
    • Supply-side Trends
    • Technology Roadmap Analysis
    • Analysis and Recommendations
  2. Market Overview
    • Market Coverage / Taxonomy
    • Market Definition / Scope / Limitations
  3. Market Background
    • Market Dynamics
      • Drivers
      • Restraints
      • Opportunity
      • Trends
    • Scenario Forecast
      • Demand in Optimistic Scenario
      • Demand in Likely Scenario
      • Demand in Conservative Scenario
    • Opportunity Map Analysis
    • Product Life Cycle Analysis
    • Supply Chain Analysis
    • Investment Feasibility Matrix
    • Value Chain Analysis
    • PESTLE and Porter’s Analysis
    • Regulatory Landscape
    • Regional Parent Market Outlook
    • Production and Consumption Statistics
    • Import and Export Statistics
  4. Global Market Analysis 2020 to 2024 and Forecast, 2025 to 2035
    • Historical Market Size Value (USD Million) Analysis, 2020 to 2024
    • Current and Future Market Size Value (USD Million) Projections, 2025 to 2035
      • Y-o-Y Growth Trend Analysis
      • Absolute $ Opportunity Analysis
  5. Global Market Pricing Analysis 2020 to 2024 and Forecast 2025 to 2035
  6. Global Market Analysis 2020 to 2024 and Forecast 2025 to 2035, By Industry
    • Introduction / Key Findings
    • Historical Market Size Value (USD Million) Analysis By Industry , 2020 to 2024
    • Current and Future Market Size Value (USD Million) Analysis and Forecast By Industry , 2025 to 2035
      • Industrial
      • Retail
      • Residential
      • Healthcare
      • Defense and Security
      • Media and Entertainment
    • Y-o-Y Growth Trend Analysis By Industry , 2020 to 2024
    • Absolute $ Opportunity Analysis By Industry , 2025 to 2035
  7. Global Market Analysis 2020 to 2024 and Forecast 2025 to 2035, By Region
    • Introduction
    • Historical Market Size Value (USD Million) Analysis By Region, 2020 to 2024
    • Current Market Size Value (USD Million) Analysis and Forecast By Region, 2025 to 2035
      • North America
      • Latin America
      • Western Europe
      • Eastern Europe
      • East Asia
      • South Asia and Pacific
      • Middle East & Africa
    • Market Attractiveness Analysis By Region
  8. North America Market Analysis 2020 to 2024 and Forecast 2025 to 2035, By Country
    • Historical Market Size Value (USD Million) Trend Analysis By Market Taxonomy, 2020 to 2024
    • Market Size Value (USD Million) Forecast By Market Taxonomy, 2025 to 2035
      • By Country
        • USA
        • Canada
        • Mexico
      • By Industry
    • Market Attractiveness Analysis
      • By Country
      • By Industry
    • Key Takeaways
  9. Latin America Market Analysis 2020 to 2024 and Forecast 2025 to 2035, By Country
    • Historical Market Size Value (USD Million) Trend Analysis By Market Taxonomy, 2020 to 2024
    • Market Size Value (USD Million) Forecast By Market Taxonomy, 2025 to 2035
      • By Country
        • Brazil
        • Chile
        • Rest of Latin America
      • By Industry
    • Market Attractiveness Analysis
      • By Country
      • By Industry
    • Key Takeaways
  10. Western Europe Market Analysis 2020 to 2024 and Forecast 2025 to 2035, By Country
    • Historical Market Size Value (USD Million) Trend Analysis By Market Taxonomy, 2020 to 2024
    • Market Size Value (USD Million) Forecast By Market Taxonomy, 2025 to 2035
      • By Country
        • Germany
        • UK
        • Italy
        • Spain
        • France
        • Nordic
        • BENELUX
        • Rest of Western Europe
      • By Industry
    • Market Attractiveness Analysis
      • By Country
      • By Industry
    • Key Takeaways
  11. Eastern Europe Market Analysis 2020 to 2024 and Forecast 2025 to 2035, By Country
    • Historical Market Size Value (USD Million) Trend Analysis By Market Taxonomy, 2020 to 2024
    • Market Size Value (USD Million) Forecast By Market Taxonomy, 2025 to 2035
      • By Country
        • Russia
        • Poland
        • Hungary
        • Balkan & Baltic
        • Rest of Eastern Europe
      • By Industry
    • Market Attractiveness Analysis
      • By Country
      • By Industry
    • Key Takeaways
  12. East Asia Market Analysis 2020 to 2024 and Forecast 2025 to 2035, By Country
    • Historical Market Size Value (USD Million) Trend Analysis By Market Taxonomy, 2020 to 2024
    • Market Size Value (USD Million) Forecast By Market Taxonomy, 2025 to 2035
      • By Country
        • China
        • Japan
        • South Korea
      • By Industry
    • Market Attractiveness Analysis
      • By Country
      • By Industry
    • Key Takeaways
  13. South Asia and Pacific Market Analysis 2020 to 2024 and Forecast 2025 to 2035, By Country
    • Historical Market Size Value (USD Million) Trend Analysis By Market Taxonomy, 2020 to 2024
    • Market Size Value (USD Million) Forecast By Market Taxonomy, 2025 to 2035
      • By Country
        • India
        • ASEAN
        • Australia & New Zealand
        • Rest of South Asia and Pacific
      • By Industry
    • Market Attractiveness Analysis
      • By Country
      • By Industry
    • Key Takeaways
  14. Middle East & Africa Market Analysis 2020 to 2024 and Forecast 2025 to 2035, By Country
    • Historical Market Size Value (USD Million) Trend Analysis By Market Taxonomy, 2020 to 2024
    • Market Size Value (USD Million) Forecast By Market Taxonomy, 2025 to 2035
      • By Country
        • Kingdom of Saudi Arabia
        • Other GCC Countries
        • Turkiye
        • South Africa
        • Other African Union
        • Rest of Middle East & Africa
      • By Industry
    • Market Attractiveness Analysis
      • By Country
      • By Industry
    • Key Takeaways
  15. Key Countries Market Analysis
    • USA
      • Pricing Analysis
      • Market Share Analysis, 2024
        • By Industry
    • Canada
      • Pricing Analysis
      • Market Share Analysis, 2024
        • By Industry
    • Mexico
      • Pricing Analysis
      • Market Share Analysis, 2024
        • By Industry
    • Brazil
      • Pricing Analysis
      • Market Share Analysis, 2024
        • By Industry
    • Chile
      • Pricing Analysis
      • Market Share Analysis, 2024
        • By Industry
    • Germany
      • Pricing Analysis
      • Market Share Analysis, 2024
        • By Industry
    • UK
      • Pricing Analysis
      • Market Share Analysis, 2024
        • By Industry
    • Italy
      • Pricing Analysis
      • Market Share Analysis, 2024
        • By Industry
    • Spain
      • Pricing Analysis
      • Market Share Analysis, 2024
        • By Industry
    • France
      • Pricing Analysis
      • Market Share Analysis, 2024
        • By Industry
    • India
      • Pricing Analysis
      • Market Share Analysis, 2024
        • By Industry
    • ASEAN
      • Pricing Analysis
      • Market Share Analysis, 2024
        • By Industry
    • Australia & New Zealand
      • Pricing Analysis
      • Market Share Analysis, 2024
        • By Industry
    • China
      • Pricing Analysis
      • Market Share Analysis, 2024
        • By Industry
    • Japan
      • Pricing Analysis
      • Market Share Analysis, 2024
        • By Industry
    • South Korea
      • Pricing Analysis
      • Market Share Analysis, 2024
        • By Industry
    • Russia
      • Pricing Analysis
      • Market Share Analysis, 2024
        • By Industry
    • Poland
      • Pricing Analysis
      • Market Share Analysis, 2024
        • By Industry
    • Hungary
      • Pricing Analysis
      • Market Share Analysis, 2024
        • By Industry
    • Kingdom of Saudi Arabia
      • Pricing Analysis
      • Market Share Analysis, 2024
        • By Industry
    • Turkiye
      • Pricing Analysis
      • Market Share Analysis, 2024
        • By Industry
    • South Africa
      • Pricing Analysis
      • Market Share Analysis, 2024
        • By Industry
  16. Market Structure Analysis
    • Competition Dashboard
    • Competition Benchmarking
    • Market Share Analysis of Top Players
      • By Regional
      • By Industry
  17. Competition Analysis
    • Competition Deep Dive
      • IBM Corporation
        • Overview
        • Product Portfolio
        • Profitability by Market Segments (Product/Age /Sales Channel/Region)
        • Sales Footprint
        • Strategy Overview
          • Marketing Strategy
          • Product Strategy
          • Channel Strategy
      • Cognizant Technology Solutions Corp.
      • Infor Global Solutions, Inc.
      • Infosys Ltd.
      • Oracle Corporation
      • Salesforce.com, Inc.
      • SAP SE
      • Toshiba Corporation
      • AeroFarms
      • AVA Technologies Inc.
  18. Assumptions & Acronyms Used
  19. Research Methodology

List of Tables

  • Table 1: Global Market Value (USD Million) Forecast by Region, 2020-2035
  • Table 2: Global Market Value (USD Million) Forecast by Industry , 2020-2035
  • Table 3: North America Market Value (USD Million) Forecast by Country, 2020-2035
  • Table 4: North America Market Value (USD Million) Forecast by Industry , 2020-2035
  • Table 5: Latin America Market Value (USD Million) Forecast by Country, 2020-2035
  • Table 6: Latin America Market Value (USD Million) Forecast by Industry , 2020-2035
  • Table 7: Western Europe Market Value (USD Million) Forecast by Country, 2020-2035
  • Table 8: Western Europe Market Value (USD Million) Forecast by Industry , 2020-2035
  • Table 9: Eastern Europe Market Value (USD Million) Forecast by Country, 2020-2035
  • Table 10: Eastern Europe Market Value (USD Million) Forecast by Industry , 2020-2035
  • Table 11: East Asia Market Value (USD Million) Forecast by Country, 2020-2035
  • Table 12: East Asia Market Value (USD Million) Forecast by Industry , 2020-2035
  • Table 13: South Asia and Pacific Market Value (USD Million) Forecast by Country, 2020-2035
  • Table 14: South Asia and Pacific Market Value (USD Million) Forecast by Industry , 2020-2035
  • Table 15: Middle East & Africa Market Value (USD Million) Forecast by Country, 2020-2035
  • Table 16: Middle East & Africa Market Value (USD Million) Forecast by Industry , 2020-2035

List of Figures

  • Figure 1: Global Market Pricing Analysis
  • Figure 2: Global Market Value (USD Million) Forecast 2020-2035
  • Figure 3: Global Market Value (USD Million) Share and BPS Analysis by Region, 2025 and 2035
  • Figure 4: Global Market Y-o-Y Growth Comparison by Region, 2025-2035
  • Figure 5: Global Market Attractiveness Analysis by Region
  • Figure 6: North America Market Incremental Dollar Opportunity, 2025-2035
  • Figure 7: Latin America Market Incremental Dollar Opportunity, 2025-2035
  • Figure 8: Western Europe Market Incremental Dollar Opportunity, 2025-2035
  • Figure 9: Eastern Europe Market Incremental Dollar Opportunity, 2025-2035
  • Figure 10: East Asia Market Incremental Dollar Opportunity, 2025-2035
  • Figure 11: South Asia and Pacific Market Incremental Dollar Opportunity, 2025-2035
  • Figure 12: Middle East & Africa Market Incremental Dollar Opportunity, 2025-2035
  • Figure 13: North America Market Value Share and BPS Analysis by Country, 2025 and 2035
  • Figure 14: Latin America Market Value Share and BPS Analysis by Country, 2025 and 2035
  • Figure 15: Western Europe Market Value Share and BPS Analysis by Country, 2025 and 2035
  • Figure 16: Eastern Europe Market Value Share and BPS Analysis by Country, 2025 and 2035
  • Figure 17: East Asia Market Value Share and BPS Analysis by Country, 2025 and 2035
  • Figure 18: South Asia and Pacific Market Value Share and BPS Analysis by Country, 2025 and 2035
  • Figure 19: Middle East & Africa Market Value Share and BPS Analysis by Country, 2025 and 2035
  • Figure 20: Global Market - Tier Structure Analysis
  • Figure 21: Global Market - Company Share Analysis

Frequently Asked Questions

How big is the physical-digital integration market in 2025?

The global physical-digital integration market is estimated to be valued at USD 6.3 billion in 2025.

What will be the size of physical-digital integration market in 2035?

The market size for the physical-digital integration market is projected to reach USD 22.5 billion by 2035.

How much will be the physical-digital integration market growth between 2025 and 2035?

The physical-digital integration market is expected to grow at a 13.5% CAGR between 2025 and 2035.

What are the key product types in the physical-digital integration market?

The key product types in physical-digital integration market are industrial, retail, residential, healthcare, defense and security and media and entertainment.

Which segment to contribute significant share in the physical-digital integration market in 2025?

In terms of , segment to command 0.0% share in the physical-digital integration market in 2025.

Explore Similar Insights

Future Market Insights

Physical-Digital Integration Market

Chat With

MaRIA

Hi There, I am MaRIA, Your Market Research Intelligence Assistant. How may I help you?