Ponceau 4R Color Market Outlook (2022-2032)

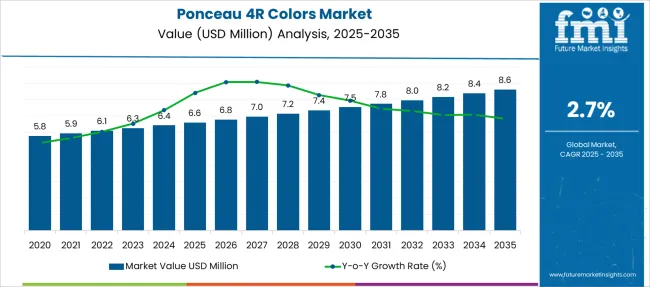
[300 Pages Report] The global ponceau 4R market is expected to reach a valuation of US$ 6.09 Million in 2022, with sales projected to increase at a 2.7% CAGR over the assessment period. As per the report, the market size will reach US$ 8.2 Million by 2032.

Attributes Details
Ponceau 4R Colors Market Estimated Size (2022E) US$ 6.1 Million
Projected Market Valuation (2032F) US$ 8.2 Million
Value CAGR (2022 to 2032) 2.7%
Top Region Market Share (EMEAI) 39.5%

FMI analysis indicates that synthetic food colors will account for nearly US$ 1.06 Billion of sales in the global market by 2032. Out of this, the ponceau 4R colors market will have a market share of US$ 6.1 Million in 2032. By volume, ponceau 4R colors had a consumption of 1300 metric tonnes globally in 2021.

Don't pay for what you don't need

Customize your report by selecting specific countries or regions and save 30%!

2017-2021 Ponceau 4R Color Market Historic Outlook Vs 2022-2032 Forecast

Ponceau 4R is a monoaze dye that predominantly occurs as reddish powder or granules. It is mainly a trisodium salt, used together with sodium chloride and/or sodium sulfate as the principal uncolored components. It may be converted to a corresponding aluminum lake. It is denoted by E Number E124.

Demand for ponceau 4R is expected to increase at a 2.7% CAGR, in comparison to the 1.9% CAGR registered between 2017 to 2021.

Ponceau 4R is a strawberry red dye from the azo dyes family that can be used in a variety of food items and is usually synthesized from aromatic hydrocarbons. It is stable to light, heat, and acid but fades in the presence of ascorbic acid. Ponceau 4R is used in Europe, Asia, and Australia, but has not been approved for human consumption by the United States Food and Drug Administration.

Market research suggests that the demand in the natural pink-red food colorants sector is expected to grow faster than ponceau 4R colors. The overall food colorants market is driven by the growing demand for innovative, unique-looking food dishes, and changing taste and food appeal preferences. This trend has been impelled further due to the advent of rapid connectivity by social media among the populations worldwide.

Ponceau 4R Colors Market

What are the Key Trends that are Driving Sales of Ponceau 4R Food Colors?

Ponceau 4R food colors are much cheaper than their counterparts. Food processing manufacturers are using these colors in cakes & pastries, confectionery, cookies, biscuits & cones, frosting / icing, and crackers & savory snacks. Ready-to-eat food products have been consistently gaining popularity in view of urban lifestyles’ growth in Asia and Africa.

The rapid urbanization, growth in population, advanced distribution systems, and increase in disposable income influence the ponceau 4R colors market positively. Increasing production and demand for food and beverage products across the globe is a chief factor boosting sales in the market.

As compared to natural food colors, ponceau 4R colors are highly effective and impart intense and uniform red color in food & beverage products at a faster pace and can easily get miscible with the solution.

Nandini Roy Choudhury

Principal Consultant

Talk to Analyst

Find your sweet spots for generating winning opportunities in this market.

Which Factors are Limiting Sales of Ponceau 4R Colors?

Bans and strict regulations on ponceau 4R colors is a key restraint to the market. Ponceau 4R food color has not been approved in the U.S. The country is one of the largest markets for food colorants and this ban has shrunk the overall ponceau market substantially. Although, it is approved by the European Union and countries across Oceania.

Potential causes of hyperactivity by ponceau 4R and consumer reluctance are limiting sales in the market. Also, shifting preference towards natural ingredients In food and beverage products will restrict demand in the market.
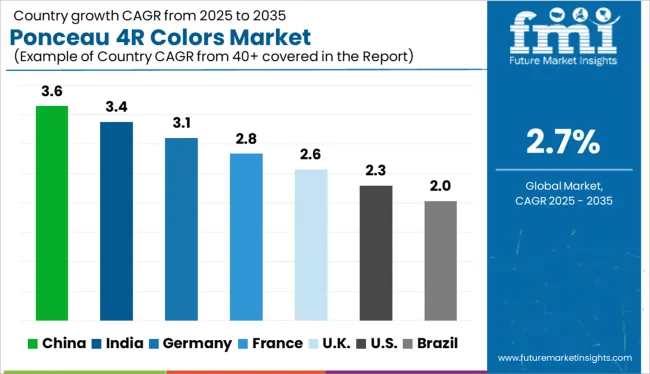
Country-wise Insights

How is the China Ponceau 4R Colors Market Faring?

“Sales of Ponceau 4R Colors in China to Remain High”

As per FMI, Asia-Pacific Ponceau 4R colors market accounted for about 342 metric tons in terms of consumption in 2021, which is approximately 26.3% of the global ponceau 4R colors market.

China is one of the largest markets for synthetic food colorants. The China ponceau 4R market recorded sales of 117 metric tons in 2021. Key manufacturers like Hangzhou Dayangchem Co. Ltd. and San-Ei Gen F.F.I., Inc. have vast manufacturing facilities, strong distribution networks, and commercial presence in Southeast Asia, particularly China and Thailand.
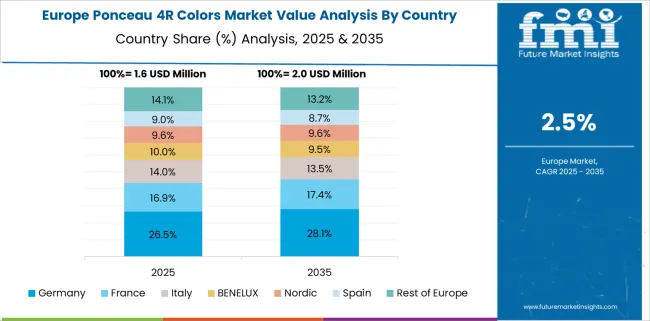
Why is the Germany Ponceau 4R Colors Market Considered Attractive?

“Expansion in the Food and Beverage Sector in Germany Will Spur Demand for Ponceau 4R Colors”

Germany sells about 109 metric tons of ponceau 4R colors annually. Total sales in Europe ponceau 4R colors clocked over 300 metric tons in 2021. Continuous advancements in various food industries apart from bakery & confectionery, such as meat processing, pet food, and functional food, and the rise in demand for innovative and exotic food colors by restaurants and cafeterias are expected to drive sales in the market.

Get the data you need at a Fraction of the cost

Personalize your report by choosing insights you need
and save 40%!

Category-wise Insights

Which is the Leading Application of Ponceau 4R Colors?

“Adoption of Ponceau 4R Colors in Candies and Confectionaries Will Boost Growth”

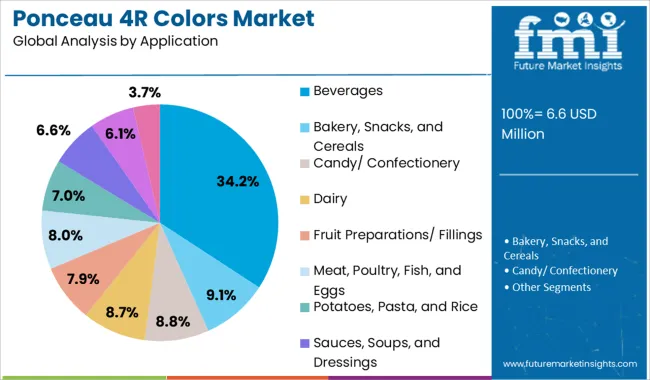
Of all the ponceau 4R coloring applications, candy, confectioneries, beverages and bakery, snacks, and cereals segments have been and are projected to account for the largest share in the market. The candy-confectionery and beverages segments have over an estimated 22% and 19% of ponceau 4R colors market share respectively.

Red is one of the most sought-after shades in confectioneries, bakeries, and desserts. Owing to high demand for confectionery, baked items, pastries, desserts, ready-to-eat, and ready-to-drink foods, food manufacturers are using synthetic food colors like ponceau 4R to restore the attractiveness of the food and beverage products after processing.
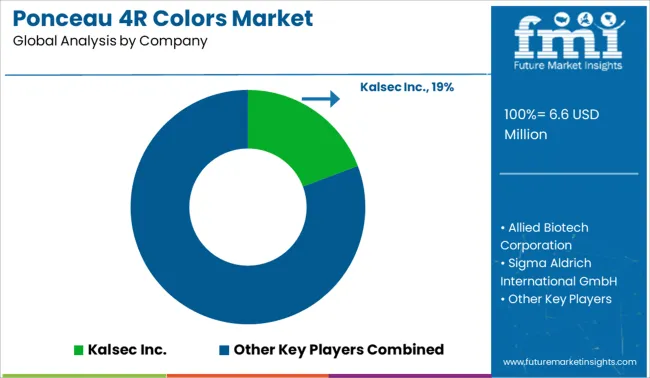
Competitive Landscape

Ponceau 4R colors manufacturers are investing in research and development to reduce health hazards, minimize barriers to entry in markets, while simultaneously making the product more valuable to end-user industries and consumers by diversifying its applications. Moreover, large manufacturers are acquiring regional units of synthetic colorants. Manufacturers are also launching products for then personal care and cosmetics sectors.

Scope of the Report

Attributes Details
Estimated Market Size (2022) US$ 6.1 Million
Projected Market Valuation (2032) US$ 8.2 Million
Value-based CAGR (2022 to 2032) 2.7%
Forecast Period 2022 to 2032
Historical Data Available for 2017 to 2021
Market Analysis US$ Million for Value and MT for Volume
Key Regions Covered Global North America; Latin America; Europe; Middle east and Africa; and India; Asia Pacific
Key Countries Covered The USA, Canada, Mexico, Brazil, Peru, Argentina, The UK, China, India, Japan, Germany, Italy, France, South Africa, South Korea, Australia, and GCC Countries
Key Segments Covered Type, Form, Color, Application, and Region
Key Companies Profiled Chr. Hansen Holding A/S; Allied Biotech Corporation; Sigma-Aldrich International GmbH; DDW; The Color House; Hangzhou Dayangchem Co. Ltd.; DSM; Vinayak Ingredients India Pvt Ltd.; San-Ei Gen F.F.I., Inc.; Sensient Colors LLC.; Symrise AG; Döhler Group; Kancor; Kalsec Inc.; Others
Report Coverage Market Forecast, DROT Analysis, Company Share Analysis, Competition Intelligence, Market Dynamics and Challenges, and Strategic Growth Initiatives

Ponceau 4R Colors Market by Category

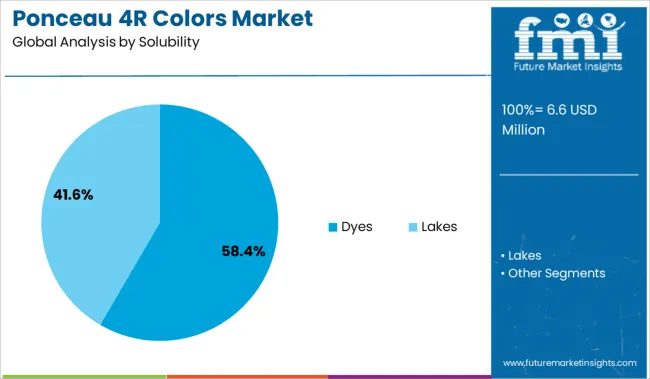
On the Basis of Solubility:

  • Dyes
  • Lakes

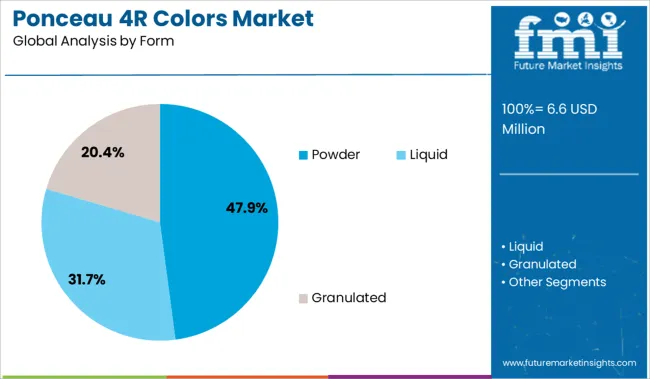
On the Basis of Form:

  • Liquid
  • Powder
  • Granulated

On the Basis of Application:

  • Beverage
  • Bakery, Snacks, and Cereals
  • Candy/ Confectionery
  • Dairy
  • Fruit Preparations/ Fillings
  • Meat, Poultry, Fish, and Eggs
  • Potatoes, Pasta, and Rice
  • Sauces, Soups, and Dressings
  • Seasonings
  • Pet Food

On the Basis of Region:

  • Global
  • North America
  • Latin America
  • Europe, the Middle East and Africa, and India
  • Asia Pacific

Frequently Asked Questions

How big is the ponceau 4R colors Market?

The ponceau 4R colors market will reach nearly US$ 6.1 Mn by 2022 and is projected to surpass US$ 8.1 Mn by 2032.

How much does bakery, cereal, and snack industry contribute to ponceau 4R food colors Market?

Bakery, cereal, and snacks accounted for 15.7% of sales by volume in the ponceau 4R colors market in 2021.

What is the outlook for China ponceau 4R colors market?

The China ponceau 4R market recorded sales of 117 metric tons in 2021, and sales are forecast to increase at a 2.3% CAGR over the assessment period.

Table of Content
1. Executive Summary
    1.1. Global Market Outlook
    1.2. Demand-side Trends
    1.3. Supply-side Trends
    1.4. Technology Roadmap Analysis
    1.5. Analysis and Recommendations
2. Market Overview
    2.1. Market Coverage / Taxonomy
    2.2. Market Definition / Scope / Limitations
3. Market Background
    3.1. Market Dynamics
        3.1.1. Drivers
        3.1.2. Restraints
        3.1.3. Opportunity
        3.1.4. Trends
    3.2. Scenario Forecast
        3.2.1. Demand in Optimistic Scenario
        3.2.2. Demand in Likely Scenario
        3.2.3. Demand in Conservative Scenario
    3.3. Product launches & Recent Developments
    3.4. Product Life Cycle Analysis
    3.5. Value Chain Analysis
        3.5.1. Supply Side Participants and their Roles
            3.5.1.1. Producers
            3.5.1.2. Mid-Level Participants (Traders/ Agents/ Brokers)
            3.5.1.3. Wholesalers and Distributors
        3.5.2. % of Operating Margin Analysis
        3.5.3. List of Raw Material Suppliers
        3.5.4. List of Existing and Potential Buyer’s
    3.6. Global Ponceau 4R ColorsMarket- Pricing Analysis
        3.6.1. Price Point Assessment by Region
        3.6.2. Price Point Assessment by Product Type
        3.6.3. Price Forecast till 2032
        3.6.4. Factors affecting Pricing
    3.7. Forecast Factors - Relevance & Impact
    3.8. PESTLE and Porter’s Analysis
    3.9. Regulatory Landscape
        3.9.1. Packaging & Labelling Regulations
        3.9.2. Certifications and Certifying Agency Overview
        3.9.3. Import/Export Policies
    3.10. Regional Parent Market Outlook
    3.11. Consumers Survey Analysis
    3.12. Macro-Economic Factors
    3.13. Product Claims & Nutritional Information Scan by Buyers
4. Global Ponceau 4R Colors Market Analysis 2017-2021 and Forecast, 2022-2032
    4.1. Historical Market Size Value (US$ Mn) & Volume (MT) Analysis, 2017-2021
    4.2. Current and Future Market Size Value (US$ Mn) & Volume (MT) Projections, 2022-2032
        4.2.1. Y-o-Y Growth Trend Analysis
        4.2.2. Absolute $ Opportunity Analysis
5. Global Ponceau 4R ColorsMarket Analysis 2017-2021 and Forecast 2022-2032, By Solubility
    5.1. Introduction / Key Findings
    5.2. Historical Market Size Value (US$ Mn) & Volume (MT) Analysis By Solubility, 2017-2021
    5.3. Current and Future Market Size Value (US$ Mn) & Volume (MT) Analysis and Forecast By Solubility, 2022-2032
        5.3.1. Dyes
        5.3.2. Lakes
    5.4. Y-o-Y Growth Trend Analysis By Solubility, 2017-2021
    5.5. Absolute $ Opportunity Analysis By Solubility, 2022-2032
6. Global Ponceau 4R ColorsMarket Analysis 2017-2021 and Forecast 2022-2032, By Form
    6.1. Introduction / Key Findings
    6.2. Historical Market Size Value (US$ Mn) & Volume (MT) Analysis By Form, 2017-2021
    6.3. Current and Future Market Size Value (US$ Mn) & Volume (MT) Analysis and Forecast By Form, 2022-2032
        6.3.1. Liquid
        6.3.2. Powder
        6.3.3. Granulated
    6.4. Y-o-Y Growth Trend Analysis By Form, 2017-2021
    6.5. Absolute $ Opportunity Analysis By Form, 2022-2032
7. Global Ponceau 4R ColorsMarket Analysis 2017-2021 and Forecast 2022-2032, By Application
    7.1. Introduction / Key Findings
    7.2. Historical Market Size Value (US$ Mn) & Volume (MT) Analysis By Application, 2017-2021
    7.3. Current and Future Market Size Value (US$ Mn) & Volume (MT) Analysis and Forecast By Application, 2022-2032
        7.3.1. Beverages
        7.3.2. Bakery, Snacks, and Cereals
        7.3.3. Candy/ Confectionery
        7.3.4. Dairy
        7.3.5. Fruit Preparations/ Fillings
        7.3.6. Meat, Poultry, Fish, and Eggs
        7.3.7. Potatoes, Pasta, and Rice
        7.3.8. Sauces, Soups, and Dressings
        7.3.9. Seasoning
        7.3.10. Pet Food
    7.4. Y-o-Y Growth Trend Analysis By Application, 2017-2021
    7.5. Absolute $ Opportunity Analysis By Application, 2022-2032
8. Global Ponceau 4R Colors Market Analysis 2017-2021 and Forecast 2022-2032, By Region
    8.1. Introduction
    8.2. Historical Market Size Value (US$ Mn) & Volume (MT) Analysis By Region, 2017-2021
    8.3. Current Market Size Value (US$ Mn) & Volume (MT) Analysis and Forecast By Region, 2022-2032
        8.3.1. North America
        8.3.2. Latin America
        8.3.3. Europe
        8.3.4. East Asia
        8.3.5. South Asia
        8.3.6. Oceania
        8.3.7. MEA
    8.4. Market Attractiveness Analysis By Region
9. North America Ponceau 4R Colors Market Analysis 2017-2021 and Forecast 2022-2032, By Country
    9.1. Historical Market Size Value (US$ Mn) & Volume (MT) Trend Analysis By Market Taxonomy, 2017-2021
    9.2. Market Size Value (US$ Mn) & Volume (MT) Forecast By Market Taxonomy, 2022-2032
        9.2.1. By Country
            9.2.1.1. U.S.
            9.2.1.2. Canada
        9.2.2. By Solubility
        9.2.3. By Form
        9.2.4. By Application
    9.3. Market Attractiveness Analysis
        9.3.1. By Country
        9.3.2. By Solubility
        9.3.3. By Form
        9.3.4. By Application
    9.4. Key Takeaways
10. Latin America Ponceau 4R Colors Market Analysis 2017-2021 and Forecast 2022-2032, By Country
    10.1. Historical Market Size Value (US$ Mn) & Volume (MT) Trend Analysis By Market Taxonomy, 2017-2021
    10.2. Market Size Value (US$ Mn) & Volume (MT) Forecast By Market Taxonomy, 2022-2032
        10.2.1. By Country
            10.2.1.1. Brazil
            10.2.1.2. Mexico
            10.2.1.3. Argentina
            10.2.1.4. Chile
            10.2.1.5. Peru
            10.2.1.6. Rest of Latin America
        10.2.2. By Solubility
        10.2.3. By Form
        10.2.4. By Application
    10.3. Market Attractiveness Analysis
        10.3.1. By Country
        10.3.2. By Solubility
        10.3.3. By Form
        10.3.4. By Application
    10.4. Key Takeaways
11. Europe Ponceau 4R Colors Market Analysis 2017-2021 and Forecast 2022-2032, By Country
    11.1. Historical Market Size Value (US$ Mn) & Volume (MT) Trend Analysis By Market Taxonomy, 2017-2021
    11.2. Market Size Value (US$ Mn) & Volume (MT) Forecast By Market Taxonomy, 2022-2032
        11.2.1. By Country
            11.2.1.1. Germany
            11.2.1.2. Italy
            11.2.1.3. France
            11.2.1.4. U.K.
            11.2.1.5. Spain
            11.2.1.6. Russia
            11.2.1.7. BENELUX
            11.2.1.8. Poland
            11.2.1.9. Nordic Countries
            11.2.1.10. Rest of Europe
        11.2.2. By Solubility
        11.2.3. By Form
        11.2.4. By Application
    11.3. Market Attractiveness Analysis
        11.3.1. By Country
        11.3.2. By Solubility
        11.3.3. By Form
        11.3.4. By Application
    11.4. Key Takeaways
12. East Asia Ponceau 4R Colors Market Analysis 2017-2021 and Forecast 2022-2032, By Country
    12.1. Historical Market Size Value (US$ Mn) & Volume (MT) Trend Analysis By Market Taxonomy, 2017-2021
    12.2. Market Size Value (US$ Mn) & Volume (MT) Forecast By Market Taxonomy, 2022-2032
        12.2.1. By Country
            12.2.1.1. China
            12.2.1.2. Japan
            12.2.1.3. South Korea
        12.2.2. By Solubility
        12.2.3. By Form
        12.2.4. By Application
    12.3. Market Attractiveness Analysis
        12.3.1. By Country
        12.3.2. By Solubility
        12.3.3. By Form
        12.3.4. By Application
    12.4. Key Takeaways
13. South Asia Ponceau 4R Colors Market Analysis 2017-2021 and Forecast 2022-2032, By Country
    13.1. Historical Market Size Value (US$ Mn) & Volume (MT) Trend Analysis By Market Taxonomy, 2017-2021
    13.2. Market Size Value (US$ Mn) & Volume (MT) Forecast By Market Taxonomy, 2022-2032
        13.2.1. By Country
            13.2.1.1. India
            13.2.1.2. Thailand
            13.2.1.3. Malaysia
            13.2.1.4. Indonesia
            13.2.1.5. Rest of South Asia
        13.2.2. By Solubility
        13.2.3. By Form
        13.2.4. By Application
    13.3. Market Attractiveness Analysis
        13.3.1. By Country
        13.3.2. By Solubility
        13.3.3. By Form
        13.3.4. By Application
    13.4. Key Takeaways
14. Oceania Ponceau 4R Colors Market Analysis 2017-2021 and Forecast 2022-2032, By Country
    14.1. Historical Market Size Value (US$ Mn) & Volume (MT) Trend Analysis By Market Taxonomy, 2017-2021
    14.2. Market Size Value (US$ Mn) & Volume (MT) Forecast By Market Taxonomy, 2022-2032
        14.2.1. By Country
            14.2.1.1. Australia
            14.2.1.2. New Zealand
        14.2.2. By Solubility
        14.2.3. By Form
        14.2.4. By Application
    14.3. Market Attractiveness Analysis
        14.3.1. By Country
        14.3.2. By Solubility
        14.3.3. By Form
        14.3.4. By Application
    14.4. Key Takeaways
15. MEA Ponceau 4R Colors Market Analysis 2017-2021 and Forecast 2022-2032, By Country
    15.1. Historical Market Size Value (US$ Mn) & Volume (MT) Trend Analysis By Market Taxonomy, 2017-2021
    15.2. Market Size Value (US$ Mn) & Volume (MT) Forecast By Market Taxonomy, 2022-2032
        15.2.1. By Country
            15.2.1.1. GCC Countries
            15.2.1.2. South Africa
            15.2.1.3. Central Africa
            15.2.1.4. North Africa
        15.2.2. By Solubility
        15.2.3. By Form
        15.2.4. By Application
    15.3. Market Attractiveness Analysis
        15.3.1. By Country
        15.3.2. By Solubility
        15.3.3. By Form
        15.3.4. By Application
    15.4. Key Takeaways
16. Key Countries Ponceau 4R Colors Market Analysis
    16.1. U.S.
        16.1.1. Pricing Analysis
        16.1.2. Market Share Analysis, 2021
            16.1.2.1. By Solubility
            16.1.2.2. By Form
            16.1.2.3. By Application
    16.2. Canada
        16.2.1. Pricing Analysis
        16.2.2. Market Share Analysis, 2021
            16.2.2.1. By Solubility
            16.2.2.2. By Form
            16.2.2.3. By Application
    16.3. Brazil
        16.3.1. Pricing Analysis
        16.3.2. Market Share Analysis, 2021
            16.3.2.1. By Solubility
            16.3.2.2. By Form
            16.3.2.3. By Application
    16.4. Mexico
        16.4.1. Pricing Analysis
        16.4.2. Market Share Analysis, 2021
            16.4.2.1. By Solubility
            16.4.2.2. By Form
            16.4.2.3. By Application
    16.5. Argentina
        16.5.1. Pricing Analysis
        16.5.2. Market Share Analysis, 2021
            16.5.2.1. By Solubility
            16.5.2.2. By Form
            16.5.2.3. By Application
    16.6. Chile
        16.6.1. Pricing Analysis
        16.6.2. Market Share Analysis, 2021
            16.6.2.1. By Solubility
            16.6.2.2. By Form
            16.6.2.3. By Application
    16.7. Peru
        16.7.1. Pricing Analysis
        16.7.2. Market Share Analysis, 2021
            16.7.2.1. By Solubility
            16.7.2.2. By Form
            16.7.2.3. By Application
    16.8. Germany
        16.8.1. Pricing Analysis
        16.8.2. Market Share Analysis, 2021
            16.8.2.1. By Solubility
            16.8.2.2. By Form
            16.8.2.3. By Application
    16.9. Italy
        16.9.1. Pricing Analysis
        16.9.2. Market Share Analysis, 2021
            16.9.2.1. By Solubility
            16.9.2.2. By Form
            16.9.2.3. By Application
    16.10. France
        16.10.1. Pricing Analysis
        16.10.2. Market Share Analysis, 2021
            16.10.2.1. By Solubility
            16.10.2.2. By Form
            16.10.2.3. By Application
    16.11. Spain
        16.11.1. Pricing Analysis
        16.11.2. Market Share Analysis, 2021
            16.11.2.1. By Solubility
            16.11.2.2. By Form
            16.11.2.3. By Application
    16.12. U.K.
        16.12.1. Pricing Analysis
        16.12.2. Market Share Analysis, 2021
            16.12.2.1. By Solubility
            16.12.2.2. By Form
            16.12.2.3. By Application
    16.13. Russia
        16.13.1. Pricing Analysis
        16.13.2. Market Share Analysis, 2021
            16.13.2.1. By Solubility
            16.13.2.2. By Form
            16.13.2.3. By Application
    16.14. Poland
        16.14.1. Pricing Analysis
        16.14.2. Market Share Analysis, 2021
            16.14.2.1. By Solubility
            16.14.2.2. By Form
            16.14.2.3. By Application
    16.15. BENELUX
        16.15.1. Pricing Analysis
        16.15.2. Market Share Analysis, 2021
            16.15.2.1. By Solubility
            16.15.2.2. By Form
            16.15.2.3. By Application
    16.16. Nordic Countries
        16.16.1. Pricing Analysis
        16.16.2. Market Share Analysis, 2021
            16.16.2.1. By Solubility
            16.16.2.2. By Form
            16.16.2.3. By Application
    16.17. China
        16.17.1. Pricing Analysis
        16.17.2. Market Share Analysis, 2021
            16.17.2.1. By Solubility
            16.17.2.2. By Form
            16.17.2.3. By Application
    16.18. Japan
        16.18.1. Pricing Analysis
        16.18.2. Market Share Analysis, 2021
            16.18.2.1. By Solubility
            16.18.2.2. By Form
            16.18.2.3. By Application
    16.19. South Korea
        16.19.1. Pricing Analysis
        16.19.2. Market Share Analysis, 2021
            16.19.2.1. By Solubility
            16.19.2.2. By Form
            16.19.2.3. By Application
    16.20. India
        16.20.1. Pricing Analysis
        16.20.2. Market Share Analysis, 2021
            16.20.2.1. By Solubility
            16.20.2.2. By Form
            16.20.2.3. By Application
    16.21. Thailand
        16.21.1. Pricing Analysis
        16.21.2. Market Share Analysis, 2021
            16.21.2.1. By Solubility
            16.21.2.2. By Form
            16.21.2.3. By Application
    16.22. Indonesia
        16.22.1. Pricing Analysis
        16.22.2. Market Share Analysis, 2021
            16.22.2.1. By Solubility
            16.22.2.2. By Form
            16.22.2.3. By Application
    16.23. Malaysia
        16.23.1. Pricing Analysis
        16.23.2. Market Share Analysis, 2021
            16.23.2.1. By Solubility
            16.23.2.2. By Form
            16.23.2.3. By Application
    16.24. Singapore
        16.24.1. Pricing Analysis
        16.24.2. Market Share Analysis, 2021
            16.24.2.1. By Solubility
            16.24.2.2. By Form
            16.24.2.3. By Application
    16.25. GCC Countries
        16.25.1. Pricing Analysis
        16.25.2. Market Share Analysis, 2021
            16.25.2.1. By Solubility
            16.25.2.2. By Form
            16.25.2.3. By Application
    16.26. South Africa
        16.26.1. Pricing Analysis
        16.26.2. Market Share Analysis, 2021
            16.26.2.1. By Solubility
            16.26.2.2. By Form
            16.26.2.3. By Application
    16.27. Central Africa
        16.27.1. Pricing Analysis
        16.27.2. Market Share Analysis, 2021
            16.27.2.1. By Solubility
            16.27.2.2. By Form
            16.27.2.3. By Application
    16.28. North Africa
        16.28.1. Pricing Analysis
        16.28.2. Market Share Analysis, 2021
            16.28.2.1. By Solubility
            16.28.2.2. By Form
            16.28.2.3. By Application
17. Market Structure Analysis
    17.1. Competition Dashboard
    17.2. Competition Benchmarking
    17.3. Market Share Analysis of Top Players
        17.3.1. By Regional
        17.3.2. By Solubility
        17.3.3. By Form
        17.3.4. By Application
18. Competition Analysis
    18.1. Competition Deep Dive
        18.1.1. Chr. Hansen Holding A/S
            18.1.1.1. Overview
            18.1.1.2. Product Portfolio
            18.1.1.3. Profitability by Market Segments (Product/Age /Sales Channel/Region)
            18.1.1.4. Sales Footprint
            18.1.1.5. Strategy Overview
                18.1.1.5.1. Marketing Strategy
                18.1.1.5.2. Product Strategy
                18.1.1.5.3. Channel Strategy
        18.1.2. Allied Biotech Corporation
            18.1.2.1. Overview
            18.1.2.2. Product Portfolio
            18.1.2.3. Profitability by Market Segments (Product/Age /Sales Channel/Region)
            18.1.2.4. Sales Footprint
            18.1.2.5. Strategy Overview
                18.1.2.5.1. Marketing Strategy
                18.1.2.5.2. Product Strategy
                18.1.2.5.3. Channel Strategy
        18.1.3. Sigma-Aldrich International GmbH
            18.1.3.1. Overview
            18.1.3.2. Product Portfolio
            18.1.3.3. Profitability by Market Segments (Product/Age /Sales Channel/Region)
            18.1.3.4. Sales Footprint
            18.1.3.5. Strategy Overview
                18.1.3.5.1. Marketing Strategy
                18.1.3.5.2. Product Strategy
                18.1.3.5.3. Channel Strategy
        18.1.4. DDW, The Color House
            18.1.4.1. Overview
            18.1.4.2. Product Portfolio
            18.1.4.3. Profitability by Market Segments (Product/Age /Sales Channel/Region)
            18.1.4.4. Sales Footprint
            18.1.4.5. Strategy Overview
                18.1.4.5.1. Marketing Strategy
                18.1.4.5.2. Product Strategy
                18.1.4.5.3. Channel Strategy
        18.1.5. Hangzhou Dayangchem Co. Ltd.
            18.1.5.1. Overview
            18.1.5.2. Product Portfolio
            18.1.5.3. Profitability by Market Segments (Product/Age /Sales Channel/Region)
            18.1.5.4. Sales Footprint
            18.1.5.5. Strategy Overview
                18.1.5.5.1. Marketing Strategy
                18.1.5.5.2. Product Strategy
                18.1.5.5.3. Channel Strategy
        18.1.6. DSM 
            18.1.6.1. Overview
            18.1.6.2. Product Portfolio
            18.1.6.3. Profitability by Market Segments (Product/Age /Sales Channel/Region)
            18.1.6.4. Sales Footprint
            18.1.6.5. Strategy Overview
                18.1.6.5.1. Marketing Strategy
                18.1.6.5.2. Product Strategy
                18.1.6.5.3. Channel Strategy
        18.1.7. Vinayak Ingredients India Pvt Ltd.
            18.1.7.1. Overview
            18.1.7.2. Product Portfolio
            18.1.7.3. Profitability by Market Segments (Product/Age /Sales Channel/Region)
            18.1.7.4. Sales Footprint
            18.1.7.5. Strategy Overview
                18.1.7.5.1. Marketing Strategy
                18.1.7.5.2. Product Strategy
                18.1.7.5.3. Channel Strategy
        18.1.8. San-Ei Gen F.F.I., Inc.
            18.1.8.1. Overview
            18.1.8.2. Product Portfolio
            18.1.8.3. Profitability by Market Segments (Product/Age /Sales Channel/Region)
            18.1.8.4. Sales Footprint
            18.1.8.5. Strategy Overview
                18.1.8.5.1. Marketing Strategy
                18.1.8.5.2. Product Strategy
                18.1.8.5.3. Channel Strategy
        18.1.9. Sensient Colors LLC.
            18.1.9.1. Overview
            18.1.9.2. Product Portfolio
            18.1.9.3. Profitability by Market Segments (Product/Age /Sales Channel/Region)
            18.1.9.4. Sales Footprint
            18.1.9.5. Strategy Overview
                18.1.9.5.1. Marketing Strategy
                18.1.9.5.2. Product Strategy
                18.1.9.5.3. Channel Strategy
        18.1.10. Symrise AG
            18.1.10.1. Overview
            18.1.10.2. Product Portfolio
            18.1.10.3. Profitability by Market Segments (Product/Age /Sales Channel/Region)
            18.1.10.4. Sales Footprint
            18.1.10.5. Strategy Overview
                18.1.10.5.1. Marketing Strategy
                18.1.10.5.2. Product Strategy
                18.1.10.5.3. Channel Strategy
        18.1.11. Döhler Group
            18.1.11.1. Overview
            18.1.11.2. Product Portfolio
            18.1.11.3. Profitability by Market Segments (Product/Age /Sales Channel/Region)
            18.1.11.4. Sales Footprint
            18.1.11.5. Strategy Overview
                18.1.11.5.1. Marketing Strategy
                18.1.11.5.2. Product Strategy
                18.1.11.5.3. Channel Strategy
        18.1.12. Kancor
            18.1.12.1. Overview
            18.1.12.2. Product Portfolio
            18.1.12.3. Profitability by Market Segments (Product/Age /Sales Channel/Region)
            18.1.12.4. Sales Footprint
            18.1.12.5. Strategy Overview
                18.1.12.5.1. Marketing Strategy
                18.1.12.5.2. Product Strategy
                18.1.12.5.3. Channel Strategy
        18.1.13. Kalsec Inc.
            18.1.13.1. Overview
            18.1.13.2. Product Portfolio
            18.1.13.3. Profitability by Market Segments (Product/Age /Sales Channel/Region)
            18.1.13.4. Sales Footprint
            18.1.13.5. Strategy Overview
                18.1.13.5.1. Marketing Strategy
                18.1.13.5.2. Product Strategy
                18.1.13.5.3. Channel Strategy
        18.1.14. Others (on additional request)
19. Assumptions & Acronyms Used
20. Research Methodology
Recommendations

Food and Beverage

Synthetic Food Color Market

May 2024

REP-GB-15299

333 pages

Food and Beverage

Lycopene Food Colors Market

July 2022

REP-GB-15286

300 pages

Food and Beverage

Brilliant Blue FCF Colors Market

July 2022

REP-GB-15284

300 pages

Food and Beverage

Brilliant Black BN Colors Market

June 2022

REP-GB-15056

342 pages

Explore Food and Beverage Insights

View Reports
Future Market Insights

Ponceau 4R Colors Market

Schedule a Call