
- Market Size (2026)
- USD 4.5 Bn
- Forecast (2036)
- USD 14.0 Bn
- CAGR (2026 to 2036)
- 12.0%
How Big Is the Privileged Access Management Market in 2026?
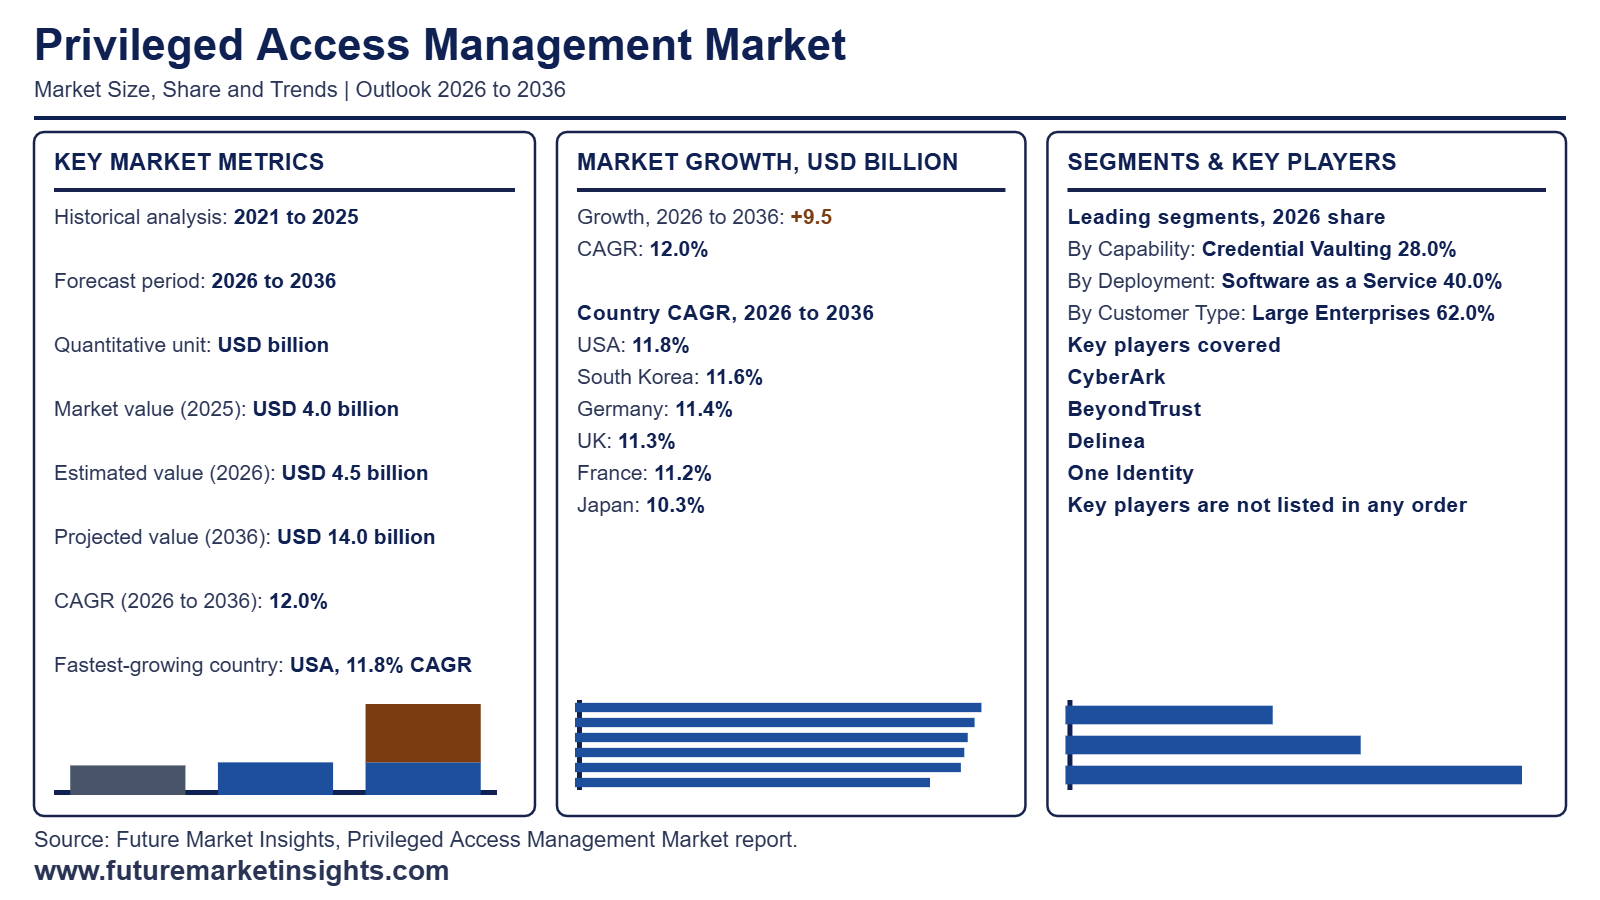
The global privileged access management market is valued at USD 4.5 billion in 2026 and was about USD 4.0 billion in 2025. Future Market Insights (FMI) projects it to reach USD 14.0 billion by 2036 at a 12.0% CAGR, which generates USD 9.5 billion in incremental revenue over the forecast decade.
| Market Metric | Valuation / Share / Forecast Benchmark |
|---|---|
| 2025 Market Size (Historical) | USD 4.0 billion |
| 2026 Market Size (Estimated) | USD 4.5 billion |
| 2036 Market Size (Projected) | USD 14.0 billion |
| Compound Annual Growth Rate (2026 to 2036) | 12.0% CAGR |
| Incremental Dollar Opportunity (2026 to 2036) | USD 9.5 billion |
| Dominant Capability (2026 to 2036 Share) | Credential Vaulting (28.0% in 2026 rising to 29.0% by 2036 at 12.4% CAGR) |
| Leading Deployment | Software as a Service (40.0% share in 2026 and 13.0% CAGR) |
| Leading Customer Type | Large Enterprises (62.0% share in 2026 and 12.2% CAGR) |
| Leading End Use | Banking and Insurance (33.0% share in 2026 and 12.3% CAGR) |
| Largest Country Markets (2026 Global Share) | USA (40.0%) |
| Fastest-Growing Country Markets (2026 to 2036) | USA (11.8% CAGR) |
| Leading Tier-1 Companies | CyberArk |
Source: Future Market Insights analysis of the privileged access management market, 2026.
Executive Market Overview
Privileged access management is widening from a vault for administrator passwords into the control layer for every account that can change systems. Cloud adoption and automation and AI agents multiply the machine and service identities that hold elevated rights and security teams must grant that access only when needed. Palo Alto Networks states that machine identities outnumber human identities by more than 80 to 1 and extends privileged controls to all of them through CyberArk (Palo Alto Networks 2026). Delinea paired vaulting with just-in-time authorization through StrongDM (Delinea 2026). This shift keeps Credential Vaulting at 28.0% of Capability revenue with a 12.4% CAGR while Software as a Service holds 40.0% of Deployment at 13.0% as buyers favor quick rollout.
Budget competition from patching is the restraint specific to this market since software vulnerabilities now start 31% of breaches and lead entry routes (Verizon 2026). Even so privileged paths decide how far an intruder travels and agencies advise layered defense and strict access controls for agentic AI (Canadian Centre for Cyber Security 2026). Large Enterprises hold 62.0% of Customer Type revenue at 12.2% and Banking and Insurance holds 33.0% of End Use at 12.3% as regulated firms need audit trails. The USA is the fastest-growing country at an 11.8% CAGR ahead of South Korea at 11.6% and Germany at 11.4% as banks and federal agencies formalize identity and access management programs. The UK at 11.3% and France at 11.2% sit above Japan at 10.3% within zero trust rollouts. Market sizing covers vaulting and session and privilege and secrets tools while excluding single sign-on and directory services.
Analyst Perspective
The privileged access management market is expanding as hybrid cloud estates and rising identity threats push enterprises toward tighter control of administrator credentials. Providers that combine session monitoring with automated credential vaulting will win larger enterprise contracts and strengthen long term subscription revenue.
- Sudip Saha, Principal Consultant, Future Market Insights.
Major Market Trends and Insights
- Cloud Delivery Pulls Privileged Access Spending Toward Subscriptions: Security teams are moving privileged access controls to subscription platforms because cloud workloads and outside contractors create admin accounts faster than on premise vaults can reach them. Vendors that host the vault shorten onboarding and shift spending toward recurring revenue. The 2026 Data Breach Investigations Report from Verizon as summarized by the Center for Internet Security (2026) shows credential abuse in 39% of breaches while third-party involvement rose 60% from the prior report. FMI projects software as a service to hold 40.0% share in 2026 at a 13.0% CAGR ahead of credential vaulting at 12.4%.
- DORA Oversight Pushes Banks to Govern Vendor Privileged Access: European supervisors now examine how financial firms control the access that outside ICT providers hold inside their systems because one vendor administrator account can reach many institutions at once. Banks and insurers therefore need session level records and audit rights they can show on request. The Austrian FMA (2026) notes that firms file full registers of ICT providers in a window from 16 February to 13 March 2026 and authorities pass them to the ESAs by 31 March 2026. EBA (January 2026) reports a UK oversight accord signed on 14 January 2026. FMI places banking and insurance at 33.0% share and 12.3% CAGR.
- Platform Vendors Absorb Privileged Access Leaders to Cover Machine Identities: Privileged access is widening from a small group of administrators to every human machine and agent identity and that pushes buyers toward suppliers that unify identity and network controls. Platform vendors respond by acquiring specialists to close the gap quickly. Palo Alto Networks (February 2026) completed its CyberArk acquisition on 11 February 2026 with each share exchanged for $45.00 in cash plus 2.2005 Palo Alto shares and keeps the CyberArk platform available as a standalone offer. Its release cites machine identities outnumbering human ones by more than 80 to 1.
How Is the Privileged Access Management Market Segmented?
Analysis of the global privileged access management market follows capability and deployment and customer type and end use and region with every axis sized on its own so that each one reconciles to the full market value.
| Segmentation Axis | Sub-Segments Covered | 2026 Leading Segment and Share | Main Growth Benchmark (2026 to 2036) |
|---|---|---|---|
| Capability | Credential Vaulting / Session Management and Monitoring / Privilege Elevation and Delegation / Endpoint Privilege Management / Secrets Management | Credential Vaulting (28.0% revenue share) | Credential Vaulting share rises to 29.0% by 2036 at 12.4% CAGR |
| Deployment | Software as a Service / On-Premise / Hybrid / Self-Hosted Cloud | Software as a Service (40.0% revenue share) | Software as a Service grows at 13.0% CAGR |
| Customer Type | Large Enterprises / Upper Mid-Market / Small and Medium Businesses / Public Sector | Large Enterprises (62.0% revenue share) | Large Enterprises grows at 12.2% CAGR |
| End Use | Banking and Insurance / IT and Telecom / Government and Defense / Healthcare / Energy and Utilities | Banking and Insurance (33.0% revenue share) | Banking and Insurance grows at 12.3% CAGR |
| Region | North America / Latin America / Western Europe / Eastern Europe / East Asia / South Asia and Pacific / Middle East and Africa | United States (40.0% global share) | United States grows at 11.8% CAGR |
Source. Future Market Insights analysis of the privileged access management market 2026.
Why Does Credential Vaulting Lead by Capability?
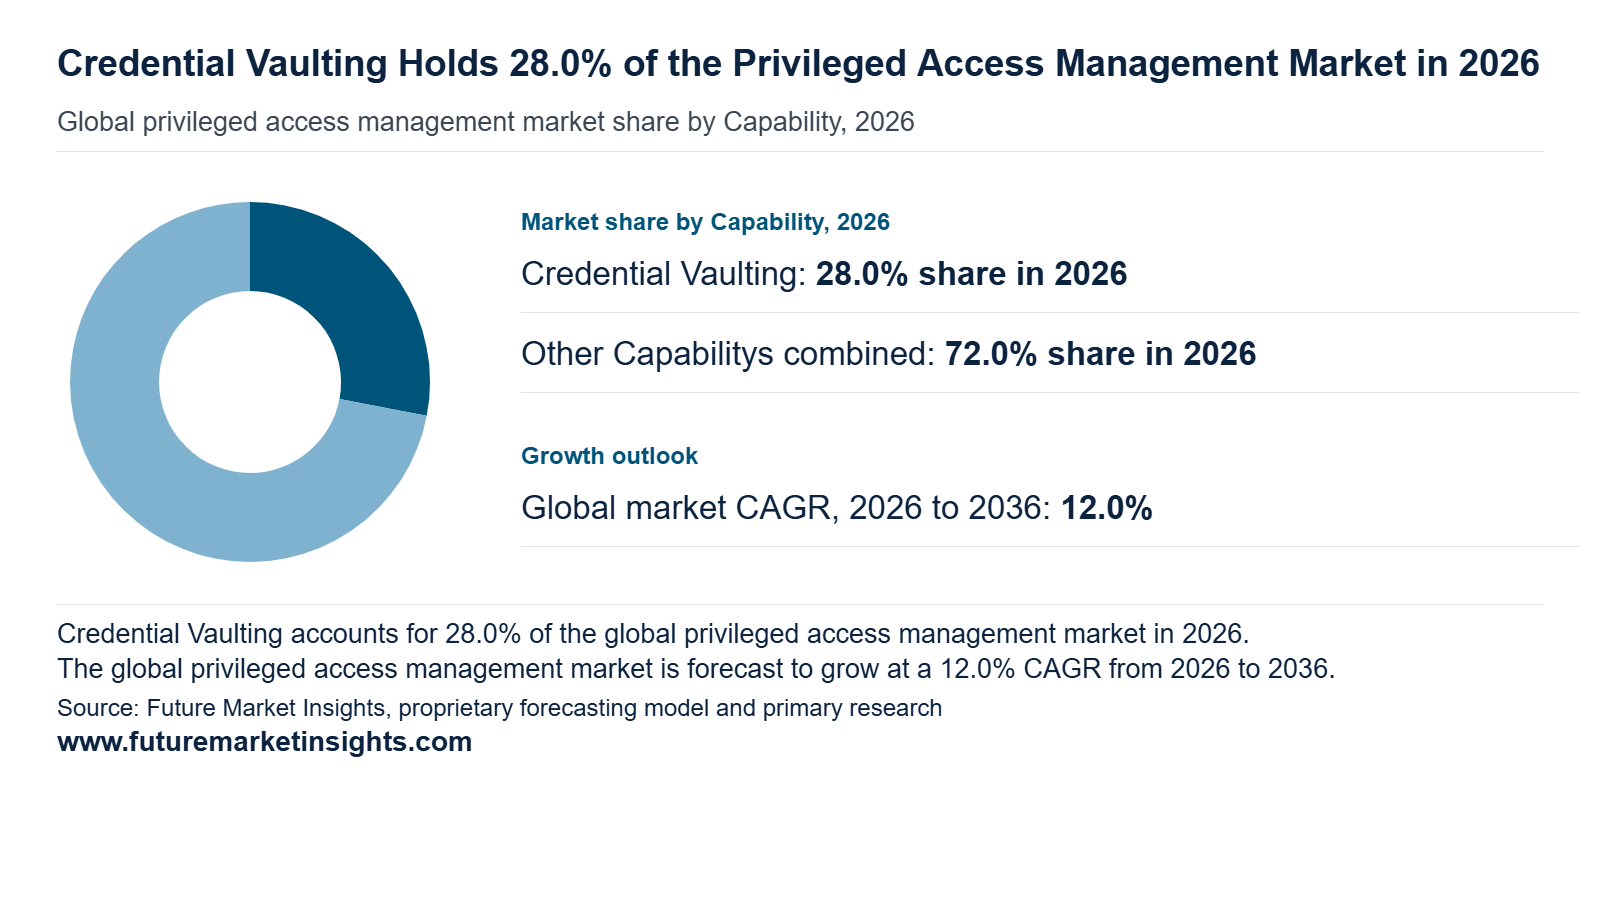
Credential vaulting leads the privileged access management market by capability with a 28.0% share in 2026 and is projected to reach 29.0% by 2036 at a 12.4% CAGR. Security teams begin with vaulting since it removes shared administrator passwords from spreadsheets and ties every checkout to a named identity inside broader identity and access management programs. CyberArk and Delinea and BeyondTrust sell vaults as the entry module that later pulls in session recording and privilege elevation. Cyber insurers that ask for evidence of rotated credentials at renewal add budget support. Secrets management and endpoint privilege management extend the same control logic to machine accounts and workstations.
Why Does Software as a Service Lead by Deployment?
Software as a service leads deployment with a 40.0% share in 2026 and grows at a 13.0% CAGR. Security teams with lean datacenter capacity favor vendor-run vaults that deploy in weeks and update automatically as cloud consoles and DevOps pipelines change. Buyers aligning access policy with zero trust security architectures prefer cloud-delivered brokers that reach remote administrators and contractors directly. Established vendors have each expanded SaaS editions to shorten onboarding. Subscription pricing gives finance teams predictable annual spend and draws organizations that previously relied on spreadsheets for privileged credentials. On-premise and hybrid and self-hosted cloud options remain relevant for regulated workloads that require data residency.
Why Do Large Enterprises Lead by Customer Type?
Large enterprises lead by customer type with a 62.0% share in 2026 and grow at a 12.2% CAGR. Global banks and telecom operators and defense contractors run thousands of administrator accounts across hybrid estates. Session recording requirements under SOX and ISO 27001 keep auditors satisfied. Dedicated security operations teams fund multi-year platform contracts that bundle vaulting and monitoring and elevation. Upper mid-market and small and medium businesses and public sector buyers adopt through managed service providers that package privileged access with monitoring. Enterprise renewals and module expansion keep revenue per account rising. Large accounts also negotiate enterprise license agreements that span regions.
Why Does Banking and Insurance Lead by End Use?
Banking and insurance leads end use with a 33.0% share in 2026 and grows at a 12.3% CAGR. Regulators raise the bar through the EU Digital Operational Resilience Act and the NYDFS cybersecurity regulation which expect disciplined control over administrator access to payment and core banking systems. Banks and insurers also manage large outsourced IT workforces whose sessions need recording and time-bound approval. Card networks require privileged access controls under PCI DSS 4.0. IT and telecom and government and defense and healthcare and energy and utilities follow with programs tied to network and patient data and grid assets.
What Are the Main Drivers, Restraints, and Opportunities?
Machine and AI identities keep multiplying privileged credentials across hybrid estates while native cloud controls and vendor consolidation shape how buyers allocate budgets and that balance favors SaaS vaulting platforms that extend least privilege to every identity for regulated banking and large enterprise programs.
Driver: Machine Identity Growth Expands Credential Vaulting Demand
Credential vaulting demand grows because software workloads and AI agents now outnumber employees as holders of credentials and every such identity needs a rotated secret and a recorded session. Security teams therefore extend vaulting from administrators to service accounts and pipelines and that widens the licensed identity base inside identity governance programs. Palo Alto Networks (February 2026) stated that machine identities outnumber human identities by more than 80 to 1. CyberArk (November 2025) reported annual recurring revenue of USD 1.341 billion up 45% with subscription ARR up 57%. Credential Vaulting holds 28.0% of 2026 revenue while the USA contributes 40.0% with large enterprises at 62.0%.
Restraint: Native Cloud Controls and Vendor Integration Temper Standalone Purchases
Buyers weigh dedicated platforms against privileged role controls already bundled inside their cloud identity suites and that comparison lengthens evaluations for mid-sized estates. Vendor consolidation adds a second layer of caution because roadmap choices land during integration. Microsoft (April 2026) documents Privileged Identity Management with just-in-time activation and approval workflows and access reviews for Entra ID and Azure roles. Palo Alto Networks (September 2026) booked USD 295 million of fiscal 2026 acquisition-related costs including CyberArk integration. Security leaders in zero trust security programs should therefore map native role coverage first and reserve dedicated vaulting for hybrid servers and secrets.
Opportunity: Hosted Just-in-Time Access Opens Regulated Enterprise Budgets
National cyber agencies now treat standing administrator rights as a preventable exposure and that pushes buyers toward just-in-time elevation delivered as a service. The Cybersecurity and Infrastructure Security Agency (March 2026) urged least privilege roles and multi admin approval and phishing-resistant multi-factor authentication for privileged actions after the Stryker attack. FMI projects privileged access management at a 12.0% CAGR from USD 4.5 billion in 2026 to USD 14.0 billion by 2036. SaaS holds 40.0% of 2026 deployment at 13.0% CAGR.
Privileged Access Management Market by Region and Country (2026 to 2036)
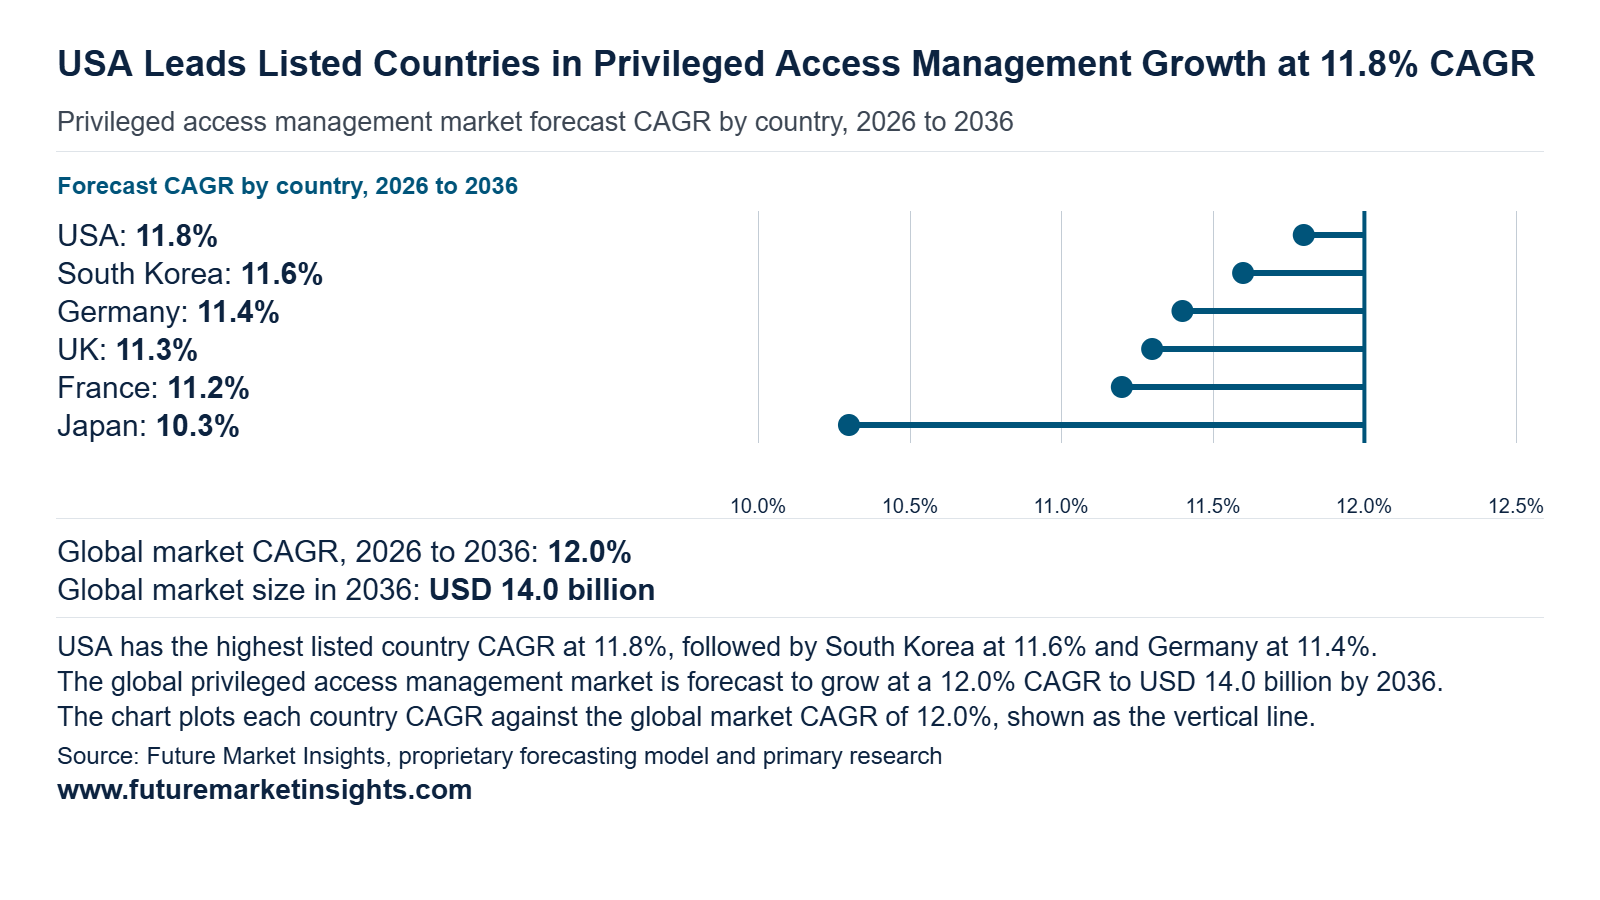
The six profiled countries hold 63.5% of global privileged access management revenue in 2026 and 60.9% by 2036 as markets outside the group scale faster. Together they add USD 5.67 billion which equals about 59.7% of the USD 9.5 billion global increment. The USA contributes USD 3.69 billion of that gain and leads the growth ranking at 11.8%. Regulation in Germany and the UK and identity token guidance in the USA show that stronger access governance now shapes buying decisions.
| Country | 2026 Revenue | 2036 Revenue | 10-Year Addition | 2026 to 2036 CAGR | Global Share (2026 → 2036) |
|---|---|---|---|---|---|
| USA | USD 1.80 billion | USD 5.49 billion | +USD 3.69 billion | 11.8% | 40.0% → 39.2% |
| South Korea | USD 112.5 million | USD 337.1 million | +USD 224.6 million | 11.6% | 2.5% → 2.4% |
| Germany | USD 292.5 million | USD 860.9 million | +USD 568.4 million | 11.4% | 6.5% → 6.1% |
| UK | USD 247.5 million | USD 722.0 million | +USD 474.5 million | 11.3% | 5.5% → 5.2% |
| France | USD 157.5 million | USD 455.3 million | +USD 297.8 million | 11.2% | 3.5% → 3.3% |
| Japan | USD 247.5 million | USD 659.7 million | +USD 412.2 million | 10.3% | 5.5% → 4.7% |
| Rest of World | USD 1.64 billion | USD 5.47 billion | +USD 3.83 billion | 12.8% | 36.5% → 39.1% |
Source: Future Market Insights analysis of the privileged access management market, 2026.
USA
The USA holds the largest position with a 40.0% share in 2026 and is also the fastest-growing country at an 11.8% CAGR. Revenue moves from an assumed USD 1.80 billion to USD 5.49 billion by 2036 and adds USD 3.69 billion. Cloud identity governance drives this scale. NIST (September 2026) finalized IR 8587 with CISA to guide agencies and cloud providers in keeping identity tokens from forgery and theft and misuse. The publication also applies to any organization that relies on identity tokens and divides duties between agencies that configure cloud services and providers that deliver secure products. Federal agencies and regulated enterprises therefore place administrator sessions and service credentials under vaulted and time-bound control. Banking and insurance buyers extend the same discipline across multi-cloud estates and this should keep American demand ahead through 2036.
South Korea
South Korea registers an 11.6% CAGR and holds the second position among the profiled countries. Revenue moves from an assumed USD 112.5 million in 2026 to USD 337.1 million by 2036 and adds USD 224.6 million. Enforcement action is shaping purchasing priorities. The Personal Information Protection Commission (June 2026) imposed a total penalty of KRW 624.681 billion on Coupang. Its findings noted that token-based authentication relied solely on e-signatures. Signing keys stayed accessible in plaintext and remained unrenewed after a former employee departed. Correction orders require an overhaul of key management and access controls. Korean retailers and platform operators now treat credential vaulting and automated key rotation and rapid access revocation as board level priorities. These upgrades should lift software spending through 2036.
Germany
Germany posts an 11.4% CAGR and ranks third among the profiled countries. Revenue rises from an assumed USD 292.5 million in 2026 to USD 860.9 million by 2036 and adds USD 568.4 million. A far wider regulatory perimeter explains this pace. The NIS-2 implementation law took effect on 6 December 2025. The BSI (December 2025) states that it will supervise around 29.5 thousand entities against roughly 4.5 thousand under the earlier act. Covered companies must register and report significant incidents and implement and document security management measures. Manufacturers and logistics operators across the Mittelstand therefore need auditable control of administrator accounts and this favors subscription delivered platforms that produce evidence for supervisors through 2036.
UK
The UK advances at an 11.3% CAGR and ranks fourth among the profiled countries. Revenue moves from an assumed USD 247.5 million in 2026 to USD 722.0 million by 2036 and adds USD 474.5 million. Outsourced IT sits at the center of new policy. The Cyber Security and Resilience Bill brings medium and large managed service providers into scope because their deep access to client systems makes them a target. Harmful incidents require an initial notification within 24 hours and a fuller report within 72 hours. The National Cyber Security Centre managed 429 incidents in the year before September 2025. Providers serving banks and NHS bodies and local authorities should adopt session recording and just-in-time elevation to meet these timelines. This widens the base of customers buying privileged access controls through 2036.
France
France is placed fifth at an 11.2% CAGR with revenue moving from an assumed USD 157.5 million in 2026 to USD 455.3 million by 2036 and adding USD 297.8 million. Public sector exposure shapes this outlook. ANSSI (March 2026) recorded 1366 incidents in 2025. Education and research accounted for 34% of targeted sectors and ministries and local authorities for 24% and health for 10%. The panorama notes that France has begun transposing the NIS 2 Directive. It adds that the Cyber Resilience Act has entered into force. Universities and hospitals and municipal administrations hold many shared administrator accounts and these form natural first deployments for vaulting and approval workflows. Rising regulatory clarity should convert these pilots into multi-year contracts across the French public sector.
Japan
Japan closes the ranking at a 10.3% CAGR with revenue moving from an assumed USD 247.5 million in 2026 to USD 659.7 million by 2036. The addition of USD 412.2 million reflects a government led and mature buyer base. The Digital Agency (July 2026) builds its Government Solution Services platform on zero trust architecture that enforces least-privilege access control. The plan also provides guidance for local governments on adopting the zero-trust concept starting in fiscal 2026. By the end of fiscal 2025 about 70% of local government systems had migrated to standard compliance systems. Municipal offices and central ministries therefore move toward least-privilege administration as part of cloud migration. Demand should follow these project cycles and keep Japan on a steady path through 2036.
Competitive Environment and Notable Companies
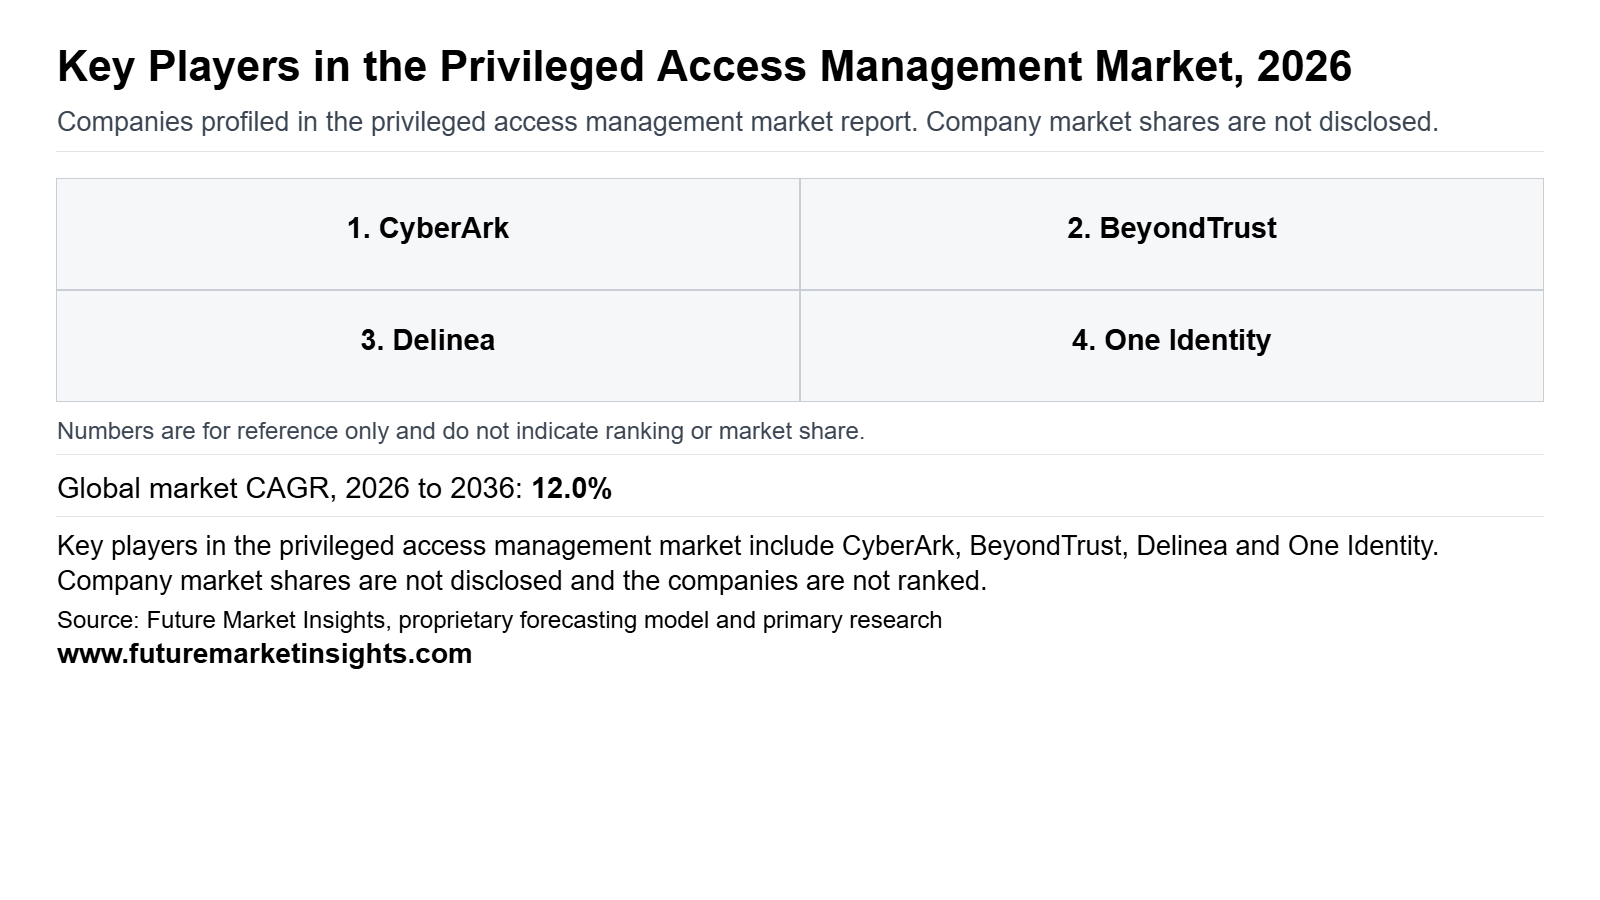
Notable companies operating in the global privileged access management market include CyberArk, BeyondTrust, Delinea, One Identity, Wallix, Netwrix, ManageEngine, Devolutions, Krontech, and Saviynt. Competition forms at two structural levels. Platform consolidators such as CyberArk inside Palo Alto Networks and Delinea with StrongDM bundle vaulting with runtime authorization for human and machine identities. Focused specialists such as Wallix and Devolutions win through sovereignty claims and mid-market simplicity. Large enterprises reward the broadest control plane and this concentrates value at the top.
How Are Companies Positioned in the Privileged Access Management Market?
Positioning splits between identity platform owners and privileged access specialists. Palo Alto Networks completed its CyberArk acquisition on 11 February 2026 to extend privilege controls from administrators to human and machine and AI identities (Palo Alto Networks, February 2026). Delinea closed StrongDM on 5 March 2026 and joined vaulting with runtime authorization (Delinea, March 2026). Scale advantages therefore flow to vendors that can bundle identity layers into one contract.
What Matters When a Buyer Selects a Privileged Access Management Supplier?
Buyers qualify suppliers on how quickly standing privileges can be removed because shared admin credentials remain a leading route for identity-led intrusions. Regulated and public sector buyers add certification demands to that test. Delinea (July 2026) secured FedRAMP High authorization for Secret Server and this opens federal procurement. Wallix (January 2026) aims its One Console at large and multi-site organizations and managed service providers and links it to NIS2 and ISO 27001 audit needs.
Which Capabilities Distinguish Product Offers?
Product offers diverge on how far privilege control reaches beyond human administrators. Credential vaulting remains the entry point and suppliers now differentiate through just-in-time access and control of machine and AI identities. BeyondTrust (February 2026) combines cloud entitlement management and identity threat detection and privileged access inside its Pathfinder platform. Saviynt (July 2026) launched Zuma with discovery and runtime access and governance components for AI agents and non-human identities.
How Does Geographic Reach Affect Competition?
Competition follows the regions where regulation and cloud migration create privileged access mandates. US federal and financial requirements anchor spending and European mandates favor suppliers that document compliance locally. Delinea (July 2026) addresses the first through FedRAMP High while Wallix (January 2026) addresses the second through NIS2 and ISO 27001 audit support. Licensing and reseller alliances therefore remain the main route to share outside the US base.
| Verified Company Evidence (2026) | Commercial Effect | Buyer Action |
|---|---|---|
| 11 February 2026 Palo Alto Networks completed its acquisition of CyberArk and made identity security a core pillar of its platform strategy [Palo Alto Networks (February 2026)]. | Places the share leader inside a broad security platform able to bundle privilege controls with network and cloud contracts. | Review renewal terms and bundle options across CyberArk and Palo Alto Networks accounts. |
| 5 March 2026 Delinea completed its StrongDM acquisition and unified privileged access with runtime authorization on one control plane [Delinea (March 2026)]. | Extends vaulting strength into just-in-time access for infrastructure and AI agents. | Test ephemeral access workflows across databases and containers before consolidating vendors. |
| 28 July 2026 Saviynt reported annual recurring revenue above USD 300 million and launched Zuma for AI agent and non-human identity security [Saviynt (July 2026)]. | Signals identity governance suppliers moving into runtime privilege control. | Compare agent governance scope against established PAM vendors during RFPs. |
Source: Verified corporate disclosures and Future Market Insights analysis, 2026.
| Company | Core Positioning | Verified Activity & Source Attribution |
|---|---|---|
| CyberArk | Identity security platform and privileged access leader | Acquired by Palo Alto Networks on 11 February 2026 (Palo Alto Networks, February 2026). |
| BeyondTrust | Privilege-centric identity security through the Pathfinder platform | Named Leader and Outperformer in the 2026 GigaOm Radar for CIEM on 26 February 2026 (BeyondTrust, February 2026). |
| Delinea | Secret Server vaulting with runtime authorization | Completed StrongDM on 5 March 2026 (Delinea, March 2026) and gained FedRAMP High authorization on 8 July 2026 (Delinea, July 2026). |
| One Identity | Safeguard privileged password and session management | Positioning only. Recent activity sits outside the source list. |
| Wallix | European privileged access vendor focused on digital sovereignty | Launched WALLIX One Console on 27 January 2026 (Wallix, January 2026). |
| Netwrix | Privileged access within an identity and data security portfolio | Positioning only. Recent activity sits outside the source list. |
| ManageEngine | PAM360 unified platform from the Zoho enterprise IT division | Positioning only. Recent activity sits outside the source list. |
| Devolutions | Privileged access for small and mid-market IT teams | Positioning only. Recent activity sits outside the source list. |
| Krontech | Turkey-based privileged access and non-human identity vendor | Positioning only. Recent activity sits outside the source list. |
| Saviynt | Identity governance extended into AI identity security | Launched Zuma on 28 July 2026 (Saviynt, July 2026). |
Source: Verified corporate disclosures and Future Market Insights analysis, 2026.
Privileged Access Management Market Report Scope and Research Methodology
FMI builds the privileged access management market from the count of protected privileged accounts in each country multiplied by the average annual contract value per account. National cybersecurity and identity software spending totals provide the cross-check. Credential vaulting anchors the model because it is the first purchase for most buyers and vendor licensing metrics track it closely. Subscription and perpetual and maintenance contracts convert to annualized revenue so every deployment model shares one value basis. Revenue is counted where the protected environment operates. Capability and country figures sum to the global total in every year. Company disclosures verify product positioning and customer mix rather than estimate proprietary company revenue.
| Coverage Field | Report Scope |
|---|---|
| Market definition | Revenue from software and services that vault credentials and monitor sessions and delegate privileges and manage endpoint privileges and secrets for human and machine accounts. |
| Product types | Credential vaulting / session management and monitoring / privilege elevation and delegation / endpoint privilege management / secrets management |
| Variants | Software as a service / on-premise / hybrid / self-hosted cloud |
| Ingredients or materials included | Password vaults and session recording engines and policy and approval workflows and just-in-time access controls and secrets stores |
| Packaging formats | Subscription licenses / perpetual licenses with maintenance / virtual appliances / hybrid bundles |
| Distribution channels | Direct enterprise sales / value-added resellers / managed security service providers / cloud marketplaces |
| End users | Banking and insurance / IT and telecom / government and defense / healthcare / energy and utilities |
| Exclusions | General identity governance and single sign-on without privileged controls / network firewalls / endpoint antivirus / consulting without a platform sale |
| Quantitative units | USD billion for value and privileged accounts for volume |
| Volume basis | Privileged accounts under management with seat-based and asset-based licenses converted to account equivalents |
| Value basis | Annualized revenue from customers in each country counted where the protected environment operates |
| Regions covered | North America / Latin America / Western Europe / Eastern Europe / East Asia / South Asia and Pacific / Middle East and Africa |
| National coverage | United States / United Kingdom / Germany / Japan / India / France / South Korea |
| Companies covered | CyberArk / BeyondTrust / Delinea / One Identity / Wallix / Netwrix / ManageEngine / Devolutions / Krontech / Saviynt |
Source: Future Market Insights analysis of the privileged access management market, 2026.
Research Sources and Bibliography
- Austrian Financial Market Authority. (2026). DORA: ICT Third-Party Risk. https://www.fma.gv.at/en/?p=158458
- BeyondTrust (February 2026). BeyondTrust Recognized as a Leader and Outperformer in the 2026 GigaOm Radar for Cloud Infrastructure Entitlement Management (CIEM) [Press release, 26 February 2026]. https://www.beyondtrust.com/press/2026-gigaom-radar-for-ciem
- Center for Internet Security. (2026). Cybersecurity Hygiene Reinforced by the 2026 Verizon DBIR. https://www.cisecurity.org/insights/blog/cybersecurity-hygiene-reinforced-by-the-2026-verizon-dbir
- CyberArk (November 2025). CyberArk Announces Strong Third Quarter 2025 Results [results release, November 6, 2025]. https://www.sec.gov/Archives/edgar/data/0001598110/000110465925107364/tm2530374d1_ex99-1.htm
- Cybersecurity and Infrastructure Security Agency (March 2026). CISA Urges Endpoint Management System Hardening After Cyberattack Against US Organization [alert bulletin, March 18, 2026]. https://content.govdelivery.com/accounts/USDHSCISA/bulletins/40ef439
- Delinea (July 2026). Delinea Achieves FedRAMP High Authorization for Secret Server [Press release, 8 July 2026]. https://delinea.com/news/delinea-achieves-fedramp-high-authorization-for-secret-server
- Delinea (March 2026). Delinea Completes StrongDM Acquisition to Secure AI Agents with Continuous Identity Authorization [Press release, 5 March 2026]. https://delinea.com/news/delinea-acquires-strongdm-to-secure-ai-with-continuous-authorization
- Department for Science Innovation and Technology (November 2025). Cyber Security and Resilience (Network and Information Systems) Bill: Summary of the Bill [factsheet, 12 November 2025]. https://www.gov.uk/government/publications/cyber-security-and-resilience-network-and-information-systems-bill-factsheets/summary-of-the-bill
- Digital Agency of Japan (July 2026). Priority Plan for the Advancement of the Digital Society [outline, provisional translation, 21 July 2026]. https://www.digital.go.jp/assets/contents/en/node/basic_page/field_ref_resources/5ecac8cc-50f1-4168-b989-2bcaabffe870/7a7ae67c/20260831_policies_priority_outline_en_02.pdf
- European Banking Authority. (January 2026). European Supervisory Authorities and UK financial regulators sign Memorandum of Understanding on oversight of critical ICT third-party service providers under DORA. https://www.eba.europa.eu/publications-and-media/press-releases/european-supervisory-authorities-and-uk-financial-regulators-sign-memorandum-understanding-oversight
- Federal Office for Information Security BSI (December 2025). Cybersicherheitsrecht: NIS-2-Umsetzungsgesetz ab morgen in Kraft [press release, 5 December 2025]. https://www.bsi.bund.de/DE/Service-Navi/Presse/Pressemitteilungen/Presse2025/251205_NIS-2-Umsetzungsgesetz_in_Kraft.html
- French National Cybersecurity Agency ANSSI (March 2026). Panorama de la cybermenace 2025 [threat overview, 11 March 2026]. https://cyber.gouv.fr/actualites/panorama-de-la-cybermenace-2025/
- Microsoft (April 2026). What is Privileged Identity Management? [product documentation, last updated April 23, 2026]. https://learn.microsoft.com/en-us/entra/id-governance/privileged-identity-management/pim-configure
- National Institute of Standards and Technology (September 2026). NIST Finalizes Guidelines on Protecting Online Identity and Access Tokens From Misuse [news release, 15 September 2026]. https://www.nist.gov/news-events/news/2026/09/nist-finalizes-guidelines-protecting-online-identity-and-access-tokens
- Palo Alto Networks (February 2026). Palo Alto Networks Completes Acquisition of CyberArk to Secure the AI Era [press release, February 11, 2026]. https://www.paloaltonetworks.com/company/press/2026/palo-alto-networks-completes-acquisition-of-cyberark-to-secure-the-ai-era
- Palo Alto Networks (September 2026). Palo Alto Networks Reports Fiscal Fourth Quarter and Fiscal Year 2026 Financial Results [results release, September 1, 2026]. https://www.paloaltonetworks.com/company/press/2026/palo-alto-networks-reports-fiscal-fourth-quarter-and-fiscal-year-2026-financial-results
- Personal Information Protection Commission, Republic of Korea (June 2026). The PIPC Sanctions Coupang and CFS for Data Breaches and Infringements on Privacy [press release, 11 June 2026]. https://pipc.go.kr/eng/user/ltn/new/noticeDetail.do?bbsId=BBSMSTR_000000000001&nttId=3071
- Saviynt (July 2026). Saviynt Exceeds $300 Million in ARR and Launches Zuma the Enterprise AI Identity Security Platform [Press release, 28 July 2026]. https://saviynt.com/press-release/saviynt-launches-zuma-ai-security-platform?hsLang=en
- Wallix (January 2026). WALLIX lance WALLIX One Console [Press release, 27 January 2026]. https://echanges.dila.gouv.fr/OPENDATA/AMF/ACT/2026/01/FCACT077993_20260127.pdf
Table of Content
- Key Takeaways
- Market Size and CAGR
- Top Growth Driver
- Fastest Growing Segment
- Leading Region
- Key Companies
- Emerging Opportunities
- Executive Summary
- Global Market Outlook
- Demand-side Trends
- Supply-side Trends
- Technology Roadmap Analysis
- Analysis and Recommendations
- Analyst Perspective (What is happening? Why now? What should investors know?)
- Key Questions Answered
- How large is the market?
- What is the CAGR?
- What are key trends?
- Which region dominates?
- Who are the leaders?
Read More...
- Market Overview
- Market Coverage / Taxonomy
- Market Definition / Scope / Limitations
- Research Methodology
- Chapter Orientation
- Analytical Lens and Working Hypotheses
- Market Structure, Signals, and Trend Drivers
- Benchmarking and Cross-market Comparability
- Market Sizing, Forecasting, and Opportunity Mapping
- Research Design and Evidence Framework
- Desk Research Programme (Secondary Evidence)
- Expert Input and Fieldwork (Primary Evidence)
- Tooling, Models, and Reference Databases
- Data Engineering and Model Build
- Quality Assurance and Audit Trail
- Market Background
- Market Dynamics (Drivers, Restraints, Opportunity, Trends)
- Scenario Forecast (Optimistic, Likely, Conservative)
- Impact Analysis
- AI Impact
- Sustainability Impact
- Regulatory Impact
- Technology Impact
- Consumer / Buyer Analysis
- Purchase Drivers
- Adoption Barriers
- Buyer Journey
- Opportunity Map Analysis
- Product Life Cycle Analysis
- Supply Chain Analysis
- Investment Feasibility Matrix
- Value Chain Analysis
- PESTLE and Porter's Analysis
- Regulatory Landscape
- Regional Parent Market Outlook
- Production and Consumption Statistics
- Import and Export Statistics
- Global Market Analysis and Forecast, 2021 to 2036
- Historical Market Size Value (USD Billion) Analysis, 2021 to 2025
- Current and Future Market Size Value (USD Billion) Projections, 2026 to 2036
- Y-o-Y Growth Trend Analysis
- Absolute $ Opportunity Analysis
- Global Market Pricing Analysis, 2021 to 2036
- Global Market Analysis and Forecast, By Capability, 2021 to 2036
- Introduction / Key Findings
- Historical Market Size Value (USD Billion) Analysis By Capability, 2021 to 2025
- Current and Future Market Size Value (USD Billion) Analysis and Forecast By Capability, 2026 to 2036
- Credential Vaulting
- Session Management and Monitoring
- Privilege Elevation and Delegation
- Endpoint Privilege Management
- Secrets Management
- Y-o-Y Growth Trend Analysis By Capability, 2021 to 2025
- Absolute $ Opportunity Analysis By Capability, 2026 to 2036
- Global Market Analysis and Forecast, By Deployment, 2021 to 2036
- Introduction / Key Findings
- Historical Market Size Value (USD Billion) Analysis By Deployment, 2021 to 2025
- Current and Future Market Size Value (USD Billion) Analysis and Forecast By Deployment, 2026 to 2036
- Software as a Service
- On-Premise
- Hybrid
- Self-Hosted Cloud
- Y-o-Y Growth Trend Analysis By Deployment, 2021 to 2025
- Absolute $ Opportunity Analysis By Deployment, 2026 to 2036
- Global Market Analysis and Forecast, By Customer Type, 2021 to 2036
- Introduction / Key Findings
- Historical Market Size Value (USD Billion) Analysis By Customer Type, 2021 to 2025
- Current and Future Market Size Value (USD Billion) Analysis and Forecast By Customer Type, 2026 to 2036
- Large Enterprises
- Upper Mid-Market
- Small and Medium Businesses
- Public Sector
- Y-o-Y Growth Trend Analysis By Customer Type, 2021 to 2025
- Absolute $ Opportunity Analysis By Customer Type, 2026 to 2036
- Global Market Analysis and Forecast, By End Use, 2021 to 2036
- Introduction / Key Findings
- Historical Market Size Value (USD Billion) Analysis By End Use, 2021 to 2025
- Current and Future Market Size Value (USD Billion) Analysis and Forecast By End Use, 2026 to 2036
- Banking and Insurance
- IT and Telecom
- Government and Defense
- Healthcare
- Energy and Utilities
- Y-o-Y Growth Trend Analysis By End Use, 2021 to 2025
- Absolute $ Opportunity Analysis By End Use, 2026 to 2036
- Global Market Analysis and Forecast, By Region, 2021 to 2036
- Introduction
- Historical Market Size Value (USD Billion) Analysis By Region, 2021 to 2025
- Current Market Size Value (USD Billion) Analysis and Forecast By Region, 2026 to 2036
- North America
- Latin America
- Western Europe
- Eastern Europe
- East Asia
- South Asia and Pacific
- Middle East and Africa
- Market Attractiveness Analysis By Region
- North America Market Analysis and Forecast, By Country, 2021 to 2036
- Historical Market Size Value (USD Billion) Trend Analysis By Market Taxonomy, 2021 to 2025
- Market Size Value (USD Billion) Forecast By Market Taxonomy, 2026 to 2036
- By Country
- United States
- Canada
- By Capability
- By Deployment
- By Customer Type
- By End Use
- By Country
- Market Attractiveness Analysis
- By Country
- By Capability
- By Deployment
- By Customer Type
- By End Use
- Key Takeaways
- Latin America Market Analysis and Forecast, By Country, 2021 to 2036
- Historical Market Size Value (USD Billion) Trend Analysis By Market Taxonomy, 2021 to 2025
- Market Size Value (USD Billion) Forecast By Market Taxonomy, 2026 to 2036
- By Country
- Brazil
- Mexico
- Argentina
- Chile
- By Capability
- By Deployment
- By Customer Type
- By End Use
- By Country
- Market Attractiveness Analysis
- By Country
- By Capability
- By Deployment
- By Customer Type
- By End Use
- Key Takeaways
- Western Europe Market Analysis and Forecast, By Country, 2021 to 2036
- Historical Market Size Value (USD Billion) Trend Analysis By Market Taxonomy, 2021 to 2025
- Market Size Value (USD Billion) Forecast By Market Taxonomy, 2026 to 2036
- By Country
- Germany
- France
- United Kingdom
- Italy
- Spain
- Benelux
- Nordics
- By Capability
- By Deployment
- By Customer Type
- By End Use
- By Country
- Market Attractiveness Analysis
- By Country
- By Capability
- By Deployment
- By Customer Type
- By End Use
- Key Takeaways
- Eastern Europe Market Analysis and Forecast, By Country, 2021 to 2036
- Historical Market Size Value (USD Billion) Trend Analysis By Market Taxonomy, 2021 to 2025
- Market Size Value (USD Billion) Forecast By Market Taxonomy, 2026 to 2036
- By Country
- Poland
- Czech Republic
- Romania
- Hungary
- By Capability
- By Deployment
- By Customer Type
- By End Use
- By Country
- Market Attractiveness Analysis
- By Country
- By Capability
- By Deployment
- By Customer Type
- By End Use
- Key Takeaways
- East Asia Market Analysis and Forecast, By Country, 2021 to 2036
- Historical Market Size Value (USD Billion) Trend Analysis By Market Taxonomy, 2021 to 2025
- Market Size Value (USD Billion) Forecast By Market Taxonomy, 2026 to 2036
- By Country
- China
- Japan
- South Korea
- By Capability
- By Deployment
- By Customer Type
- By End Use
- By Country
- Market Attractiveness Analysis
- By Country
- By Capability
- By Deployment
- By Customer Type
- By End Use
- Key Takeaways
- South Asia and Pacific Market Analysis and Forecast, By Country, 2021 to 2036
- Historical Market Size Value (USD Billion) Trend Analysis By Market Taxonomy, 2021 to 2025
- Market Size Value (USD Billion) Forecast By Market Taxonomy, 2026 to 2036
- By Country
- India
- ASEAN
- Australia and New Zealand
- By Capability
- By Deployment
- By Customer Type
- By End Use
- By Country
- Market Attractiveness Analysis
- By Country
- By Capability
- By Deployment
- By Customer Type
- By End Use
- Key Takeaways
- Middle East and Africa Market Analysis and Forecast, By Country, 2021 to 2036
- Historical Market Size Value (USD Billion) Trend Analysis By Market Taxonomy, 2021 to 2025
- Market Size Value (USD Billion) Forecast By Market Taxonomy, 2026 to 2036
- By Country
- GCC Countries
- South Africa
- Türkiye
- Israel
- By Capability
- By Deployment
- By Customer Type
- By End Use
- By Country
- Market Attractiveness Analysis
- By Country
- By Capability
- By Deployment
- By Customer Type
- By End Use
- Key Takeaways
- Key Countries Market Analysis
- United States
- Pricing Analysis
- Market Share Analysis, 2025
- By Capability
- By Deployment
- By Customer Type
- By End Use
- Canada
- Pricing Analysis
- Market Share Analysis, 2025
- By Capability
- By Deployment
- By Customer Type
- By End Use
- Brazil
- Pricing Analysis
- Market Share Analysis, 2025
- By Capability
- By Deployment
- By Customer Type
- By End Use
- Mexico
- Pricing Analysis
- Market Share Analysis, 2025
- By Capability
- By Deployment
- By Customer Type
- By End Use
- Argentina
- Pricing Analysis
- Market Share Analysis, 2025
- By Capability
- By Deployment
- By Customer Type
- By End Use
- Chile
- Pricing Analysis
- Market Share Analysis, 2025
- By Capability
- By Deployment
- By Customer Type
- By End Use
- Germany
- Pricing Analysis
- Market Share Analysis, 2025
- By Capability
- By Deployment
- By Customer Type
- By End Use
- France
- Pricing Analysis
- Market Share Analysis, 2025
- By Capability
- By Deployment
- By Customer Type
- By End Use
- United Kingdom
- Pricing Analysis
- Market Share Analysis, 2025
- By Capability
- By Deployment
- By Customer Type
- By End Use
- Italy
- Pricing Analysis
- Market Share Analysis, 2025
- By Capability
- By Deployment
- By Customer Type
- By End Use
- Spain
- Pricing Analysis
- Market Share Analysis, 2025
- By Capability
- By Deployment
- By Customer Type
- By End Use
- Benelux
- Pricing Analysis
- Market Share Analysis, 2025
- By Capability
- By Deployment
- By Customer Type
- By End Use
- Nordics
- Pricing Analysis
- Market Share Analysis, 2025
- By Capability
- By Deployment
- By Customer Type
- By End Use
- Poland
- Pricing Analysis
- Market Share Analysis, 2025
- By Capability
- By Deployment
- By Customer Type
- By End Use
- Czech Republic
- Pricing Analysis
- Market Share Analysis, 2025
- By Capability
- By Deployment
- By Customer Type
- By End Use
- Romania
- Pricing Analysis
- Market Share Analysis, 2025
- By Capability
- By Deployment
- By Customer Type
- By End Use
- Hungary
- Pricing Analysis
- Market Share Analysis, 2025
- By Capability
- By Deployment
- By Customer Type
- By End Use
- China
- Pricing Analysis
- Market Share Analysis, 2025
- By Capability
- By Deployment
- By Customer Type
- By End Use
- Japan
- Pricing Analysis
- Market Share Analysis, 2025
- By Capability
- By Deployment
- By Customer Type
- By End Use
- South Korea
- Pricing Analysis
- Market Share Analysis, 2025
- By Capability
- By Deployment
- By Customer Type
- By End Use
- India
- Pricing Analysis
- Market Share Analysis, 2025
- By Capability
- By Deployment
- By Customer Type
- By End Use
- ASEAN
- Pricing Analysis
- Market Share Analysis, 2025
- By Capability
- By Deployment
- By Customer Type
- By End Use
- Australia and New Zealand
- Pricing Analysis
- Market Share Analysis, 2025
- By Capability
- By Deployment
- By Customer Type
- By End Use
- GCC Countries
- Pricing Analysis
- Market Share Analysis, 2025
- By Capability
- By Deployment
- By Customer Type
- By End Use
- South Africa
- Pricing Analysis
- Market Share Analysis, 2025
- By Capability
- By Deployment
- By Customer Type
- By End Use
- Türkiye
- Pricing Analysis
- Market Share Analysis, 2025
- By Capability
- By Deployment
- By Customer Type
- By End Use
- Israel
- Pricing Analysis
- Market Share Analysis, 2025
- By Capability
- By Deployment
- By Customer Type
- By End Use
- United States
- Market Structure Analysis
- Competition Dashboard
- Competition Benchmarking
- Market Share Analysis of Top Players
- By Region
- By Capability
- By Deployment
- By Customer Type
- By End Use
- Emerging Startups
- Innovation Benchmarking
- Competition Analysis
- Competition Deep Dive
- CyberArk
- Overview
- Product Portfolio
- Profitability by Market Segments
- Sales Footprint
- Strategy Overview
- Marketing Strategy
- Product Strategy
- Channel Strategy
- BeyondTrust
- Delinea
- One Identity
- Wallix
- Netwrix
- ManageEngine
- Devolutions
- Krontech
- Saviynt
- CyberArk
- Case Studies
- Success Stories
- Recent Developments
- Competition Deep Dive
- Assumptions & Acronyms Used
List of Tables
- Table 1: Global Market Value (USD Billion) Forecast by Region, 2021 to 2036
- Table 2: Global Market Value (USD Billion) Forecast by Capability, 2021 to 2036
- Table 3: Global Market Value (USD Billion) Forecast by Deployment, 2021 to 2036
- Table 4: Global Market Value (USD Billion) Forecast by Customer Type, 2021 to 2036
- Table 5: Global Market Value (USD Billion) Forecast by End Use, 2021 to 2036
- Table 6: North America Market Value (USD Billion) Forecast by Country, 2021 to 2036
- Table 7: North America Market Value (USD Billion) Forecast by Capability, 2021 to 2036
- Table 8: North America Market Value (USD Billion) Forecast by Deployment, 2021 to 2036
- Table 9: North America Market Value (USD Billion) Forecast by Customer Type, 2021 to 2036
- Table 10: North America Market Value (USD Billion) Forecast by End Use, 2021 to 2036
- Table 11: Latin America Market Value (USD Billion) Forecast by Country, 2021 to 2036
- Table 12: Latin America Market Value (USD Billion) Forecast by Capability, 2021 to 2036
- Table 13: Latin America Market Value (USD Billion) Forecast by Deployment, 2021 to 2036
- Table 14: Latin America Market Value (USD Billion) Forecast by Customer Type, 2021 to 2036
- Table 15: Latin America Market Value (USD Billion) Forecast by End Use, 2021 to 2036
- Table 16: Western Europe Market Value (USD Billion) Forecast by Country, 2021 to 2036
- Table 17: Western Europe Market Value (USD Billion) Forecast by Capability, 2021 to 2036
- Table 18: Western Europe Market Value (USD Billion) Forecast by Deployment, 2021 to 2036
- Table 19: Western Europe Market Value (USD Billion) Forecast by Customer Type, 2021 to 2036
- Table 20: Western Europe Market Value (USD Billion) Forecast by End Use, 2021 to 2036
- Table 21: Eastern Europe Market Value (USD Billion) Forecast by Country, 2021 to 2036
- Table 22: Eastern Europe Market Value (USD Billion) Forecast by Capability, 2021 to 2036
- Table 23: Eastern Europe Market Value (USD Billion) Forecast by Deployment, 2021 to 2036
- Table 24: Eastern Europe Market Value (USD Billion) Forecast by Customer Type, 2021 to 2036
- Table 25: Eastern Europe Market Value (USD Billion) Forecast by End Use, 2021 to 2036
- Table 26: East Asia Market Value (USD Billion) Forecast by Country, 2021 to 2036
- Table 27: East Asia Market Value (USD Billion) Forecast by Capability, 2021 to 2036
- Table 28: East Asia Market Value (USD Billion) Forecast by Deployment, 2021 to 2036
- Table 29: East Asia Market Value (USD Billion) Forecast by Customer Type, 2021 to 2036
- Table 30: East Asia Market Value (USD Billion) Forecast by End Use, 2021 to 2036
- Table 31: South Asia and Pacific Market Value (USD Billion) Forecast by Country, 2021 to 2036
- Table 32: South Asia and Pacific Market Value (USD Billion) Forecast by Capability, 2021 to 2036
- Table 33: South Asia and Pacific Market Value (USD Billion) Forecast by Deployment, 2021 to 2036
- Table 34: South Asia and Pacific Market Value (USD Billion) Forecast by Customer Type, 2021 to 2036
- Table 35: South Asia and Pacific Market Value (USD Billion) Forecast by End Use, 2021 to 2036
- Table 36: Middle East and Africa Market Value (USD Billion) Forecast by Country, 2021 to 2036
- Table 37: Middle East and Africa Market Value (USD Billion) Forecast by Capability, 2021 to 2036
- Table 38: Middle East and Africa Market Value (USD Billion) Forecast by Deployment, 2021 to 2036
- Table 39: Middle East and Africa Market Value (USD Billion) Forecast by Customer Type, 2021 to 2036
- Table 40: Middle East and Africa Market Value (USD Billion) Forecast by End Use, 2021 to 2036
List of Figures
- Figure 1: Global Market Pricing Analysis
- Figure 2: Global Market Value (USD Billion) Forecast 2021-2036
- Figure 3: Global Market Value Share and BPS Analysis by Capability, 2026 and 2036
- Figure 4: Global Market Y-o-Y Growth Comparison by Capability, 2026-2036
- Figure 5: Global Market Attractiveness Analysis by Capability
- Figure 6: Global Market Value Share and BPS Analysis by Deployment, 2026 and 2036
- Figure 7: Global Market Y-o-Y Growth Comparison by Deployment, 2026-2036
- Figure 8: Global Market Attractiveness Analysis by Deployment
- Figure 9: Global Market Value Share and BPS Analysis by Customer Type, 2026 and 2036
- Figure 10: Global Market Y-o-Y Growth Comparison by Customer Type, 2026-2036
- Figure 11: Global Market Attractiveness Analysis by Customer Type
- Figure 12: Global Market Value Share and BPS Analysis by End Use, 2026 and 2036
- Figure 13: Global Market Y-o-Y Growth Comparison by End Use, 2026-2036
- Figure 14: Global Market Attractiveness Analysis by End Use
- Figure 15: Global Market Value (USD Billion) Share and BPS Analysis by Region, 2026 and 2036
- Figure 16: Global Market Y-o-Y Growth Comparison by Region, 2026-2036
- Figure 17: Global Market Attractiveness Analysis by Region
- Figure 18: North America Market Incremental Dollar Opportunity, 2026-2036
- Figure 19: Latin America Market Incremental Dollar Opportunity, 2026-2036
- Figure 20: Western Europe Market Incremental Dollar Opportunity, 2026-2036
- Figure 21: Eastern Europe Market Incremental Dollar Opportunity, 2026-2036
- Figure 22: East Asia Market Incremental Dollar Opportunity, 2026-2036
- Figure 23: South Asia and Pacific Market Incremental Dollar Opportunity, 2026-2036
- Figure 24: Middle East and Africa Market Incremental Dollar Opportunity, 2026-2036
- Figure 25: North America Market Value Share and BPS Analysis by Country, 2026 and 2036
- Figure 26: North America Market Value Share and BPS Analysis by Capability, 2026 and 2036
- Figure 27: North America Market Y-o-Y Growth Comparison by Capability, 2026-2036
- Figure 28: North America Market Attractiveness Analysis by Capability
- Figure 29: North America Market Value Share and BPS Analysis by Deployment, 2026 and 2036
- Figure 30: North America Market Y-o-Y Growth Comparison by Deployment, 2026-2036
- Figure 31: North America Market Attractiveness Analysis by Deployment
- Figure 32: North America Market Value Share and BPS Analysis by Customer Type, 2026 and 2036
- Figure 33: North America Market Y-o-Y Growth Comparison by Customer Type, 2026-2036
- Figure 34: North America Market Attractiveness Analysis by Customer Type
- Figure 35: North America Market Value Share and BPS Analysis by End Use, 2026 and 2036
- Figure 36: North America Market Y-o-Y Growth Comparison by End Use, 2026-2036
- Figure 37: North America Market Attractiveness Analysis by End Use
- Figure 38: Latin America Market Value Share and BPS Analysis by Country, 2026 and 2036
- Figure 39: Latin America Market Value Share and BPS Analysis by Capability, 2026 and 2036
- Figure 40: Latin America Market Y-o-Y Growth Comparison by Capability, 2026-2036
- Figure 41: Latin America Market Attractiveness Analysis by Capability
- Figure 42: Latin America Market Value Share and BPS Analysis by Deployment, 2026 and 2036
- Figure 43: Latin America Market Y-o-Y Growth Comparison by Deployment, 2026-2036
- Figure 44: Latin America Market Attractiveness Analysis by Deployment
- Figure 45: Latin America Market Value Share and BPS Analysis by Customer Type, 2026 and 2036
- Figure 46: Latin America Market Y-o-Y Growth Comparison by Customer Type, 2026-2036
- Figure 47: Latin America Market Attractiveness Analysis by Customer Type
- Figure 48: Latin America Market Value Share and BPS Analysis by End Use, 2026 and 2036
- Figure 49: Latin America Market Y-o-Y Growth Comparison by End Use, 2026-2036
- Figure 50: Latin America Market Attractiveness Analysis by End Use
- Figure 51: Western Europe Market Value Share and BPS Analysis by Country, 2026 and 2036
- Figure 52: Western Europe Market Value Share and BPS Analysis by Capability, 2026 and 2036
- Figure 53: Western Europe Market Y-o-Y Growth Comparison by Capability, 2026-2036
- Figure 54: Western Europe Market Attractiveness Analysis by Capability
- Figure 55: Western Europe Market Value Share and BPS Analysis by Deployment, 2026 and 2036
- Figure 56: Western Europe Market Y-o-Y Growth Comparison by Deployment, 2026-2036
- Figure 57: Western Europe Market Attractiveness Analysis by Deployment
- Figure 58: Western Europe Market Value Share and BPS Analysis by Customer Type, 2026 and 2036
- Figure 59: Western Europe Market Y-o-Y Growth Comparison by Customer Type, 2026-2036
- Figure 60: Western Europe Market Attractiveness Analysis by Customer Type
- Figure 61: Western Europe Market Value Share and BPS Analysis by End Use, 2026 and 2036
- Figure 62: Western Europe Market Y-o-Y Growth Comparison by End Use, 2026-2036
- Figure 63: Western Europe Market Attractiveness Analysis by End Use
- Figure 64: Eastern Europe Market Value Share and BPS Analysis by Country, 2026 and 2036
- Figure 65: Eastern Europe Market Value Share and BPS Analysis by Capability, 2026 and 2036
- Figure 66: Eastern Europe Market Y-o-Y Growth Comparison by Capability, 2026-2036
- Figure 67: Eastern Europe Market Attractiveness Analysis by Capability
- Figure 68: Eastern Europe Market Value Share and BPS Analysis by Deployment, 2026 and 2036
- Figure 69: Eastern Europe Market Y-o-Y Growth Comparison by Deployment, 2026-2036
- Figure 70: Eastern Europe Market Attractiveness Analysis by Deployment
- Figure 71: Eastern Europe Market Value Share and BPS Analysis by Customer Type, 2026 and 2036
- Figure 72: Eastern Europe Market Y-o-Y Growth Comparison by Customer Type, 2026-2036
- Figure 73: Eastern Europe Market Attractiveness Analysis by Customer Type
- Figure 74: Eastern Europe Market Value Share and BPS Analysis by End Use, 2026 and 2036
- Figure 75: Eastern Europe Market Y-o-Y Growth Comparison by End Use, 2026-2036
- Figure 76: Eastern Europe Market Attractiveness Analysis by End Use
- Figure 77: East Asia Market Value Share and BPS Analysis by Country, 2026 and 2036
- Figure 78: East Asia Market Value Share and BPS Analysis by Capability, 2026 and 2036
- Figure 79: East Asia Market Y-o-Y Growth Comparison by Capability, 2026-2036
- Figure 80: East Asia Market Attractiveness Analysis by Capability
- Figure 81: East Asia Market Value Share and BPS Analysis by Deployment, 2026 and 2036
- Figure 82: East Asia Market Y-o-Y Growth Comparison by Deployment, 2026-2036
- Figure 83: East Asia Market Attractiveness Analysis by Deployment
- Figure 84: East Asia Market Value Share and BPS Analysis by Customer Type, 2026 and 2036
- Figure 85: East Asia Market Y-o-Y Growth Comparison by Customer Type, 2026-2036
- Figure 86: East Asia Market Attractiveness Analysis by Customer Type
- Figure 87: East Asia Market Value Share and BPS Analysis by End Use, 2026 and 2036
- Figure 88: East Asia Market Y-o-Y Growth Comparison by End Use, 2026-2036
- Figure 89: East Asia Market Attractiveness Analysis by End Use
- Figure 90: South Asia and Pacific Market Value Share and BPS Analysis by Country, 2026 and 2036
- Figure 91: South Asia and Pacific Market Value Share and BPS Analysis by Capability, 2026 and 2036
- Figure 92: South Asia and Pacific Market Y-o-Y Growth Comparison by Capability, 2026-2036
- Figure 93: South Asia and Pacific Market Attractiveness Analysis by Capability
- Figure 94: South Asia and Pacific Market Value Share and BPS Analysis by Deployment, 2026 and 2036
- Figure 95: South Asia and Pacific Market Y-o-Y Growth Comparison by Deployment, 2026-2036
- Figure 96: South Asia and Pacific Market Attractiveness Analysis by Deployment
- Figure 97: South Asia and Pacific Market Value Share and BPS Analysis by Customer Type, 2026 and 2036
- Figure 98: South Asia and Pacific Market Y-o-Y Growth Comparison by Customer Type, 2026-2036
- Figure 99: South Asia and Pacific Market Attractiveness Analysis by Customer Type
- Figure 100: South Asia and Pacific Market Value Share and BPS Analysis by End Use, 2026 and 2036
- Figure 101: South Asia and Pacific Market Y-o-Y Growth Comparison by End Use, 2026-2036
- Figure 102: South Asia and Pacific Market Attractiveness Analysis by End Use
- Figure 103: Middle East and Africa Market Value Share and BPS Analysis by Country, 2026 and 2036
- Figure 104: Middle East and Africa Market Value Share and BPS Analysis by Capability, 2026 and 2036
- Figure 105: Middle East and Africa Market Y-o-Y Growth Comparison by Capability, 2026-2036
- Figure 106: Middle East and Africa Market Attractiveness Analysis by Capability
- Figure 107: Middle East and Africa Market Value Share and BPS Analysis by Deployment, 2026 and 2036
- Figure 108: Middle East and Africa Market Y-o-Y Growth Comparison by Deployment, 2026-2036
- Figure 109: Middle East and Africa Market Attractiveness Analysis by Deployment
- Figure 110: Middle East and Africa Market Value Share and BPS Analysis by Customer Type, 2026 and 2036
- Figure 111: Middle East and Africa Market Y-o-Y Growth Comparison by Customer Type, 2026-2036
- Figure 112: Middle East and Africa Market Attractiveness Analysis by Customer Type
- Figure 113: Middle East and Africa Market Value Share and BPS Analysis by End Use, 2026 and 2036
- Figure 114: Middle East and Africa Market Y-o-Y Growth Comparison by End Use, 2026-2036
- Figure 115: Middle East and Africa Market Attractiveness Analysis by End Use
- Figure 116: Global Market - Tier Structure Analysis
- Figure 117: Global Market - Company Share Analysis
Frequently Asked Questions
How big is the Privileged Access Management Market in 2026?
Future Market Insights estimates the global privileged access management market at USD 4.5 billion in 2026, up from USD 4.0 billion in 2025, and projects it to reach USD 14.0 billion by 2036.
How fast is the Privileged Access Management Market expected to grow through 2036?
FMI projects the market to expand at a 12.0% CAGR from 2026 to 2036, generating an incremental revenue opportunity of USD 9.5 billion over the forecast period.
Which capability leads the Privileged Access Management Market?
Credential vaulting leads the capability segment with a 28.0% share in 2026, projected to increase to 29.0% by 2036 at a 12.4% CAGR.
Which deployment model leads the Privileged Access Management Market?
Software as a Service leads the deployment segment with a 40.0% share in 2026 and is projected to grow at a 13.0% CAGR through 2036.
Which customer type and end use lead the Privileged Access Management Market?
Large enterprises lead the customer type segment with a 62.0% share in 2026, while banking and insurance account for the largest end-use share at 33.0%.
Which country and company lead the Privileged Access Management Market?
The USA represents the largest country market with a 40.0% share in 2026 and is projected to grow at an 11.8% CAGR through 2036.
Preview the report firsthand - request a free sample
Get SampleGet the brochure for pricing and purchase details.
Get PDF
