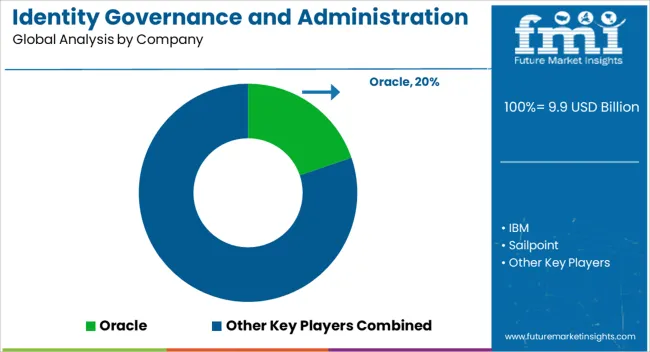
The Identity Governance and Administration Market is estimated to be valued at USD 9.9 billion in 2025 and is projected to reach USD 35.1 billion by 2035, registering a compound annual growth rate (CAGR) of 13.5% over the forecast period.
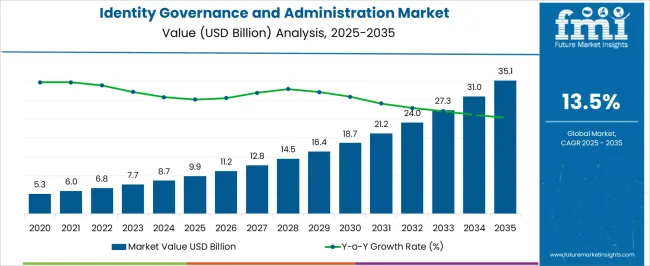
| Metric | Value |
|---|---|
| Identity Governance and Administration Market Estimated Value in (2025 E) | USD 9.9 billion |
| Identity Governance and Administration Market Forecast Value in (2035 F) | USD 35.1 billion |
| Forecast CAGR (2025 to 2035) | 13.5% |
The identity governance and administration market is advancing rapidly due to heightened regulatory pressures, increasing cybersecurity threats, and the growing complexity of IT environments. Enterprises are prioritizing identity management frameworks that safeguard sensitive data while ensuring compliance with evolving data protection mandates.
The adoption of AI powered analytics and automation within governance solutions is further strengthening operational efficiency and reducing manual intervention. The shift toward hybrid and multi cloud infrastructures has amplified the demand for robust identity lifecycle management tools that deliver secure access and policy enforcement across diverse systems.
With digital transformation initiatives accelerating, the market outlook remains strong as organizations place greater emphasis on risk mitigation, compliance, and secure digital identity frameworks.
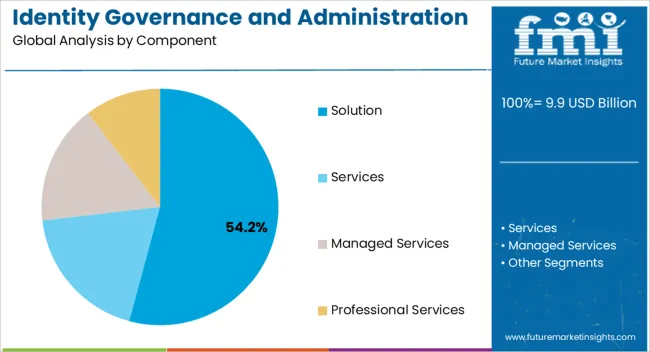
The solution segment is expected to account for 54.20% of total market revenue by 2025 within the component category, making it the leading segment. This dominance is driven by the rising need for automated identity lifecycle management, access certification, and compliance reporting.
Enterprises have increasingly relied on solutions that integrate seamlessly with diverse IT systems, enabling consistent governance across cloud and on premises applications. Continuous innovation in artificial intelligence and machine learning within solutions has improved anomaly detection and policy enforcement, strengthening their adoption.
As organizations face heightened risks from insider threats and unauthorized access, solutions have become critical to ensuring streamlined identity management, supporting their position as the most significant contributor within the component category.
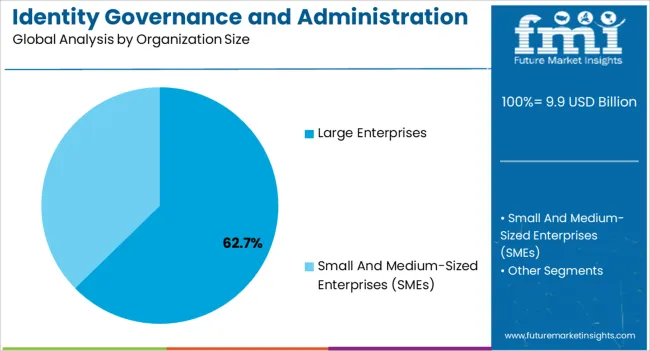
The large enterprises segment is projected to represent 62.70% of the overall revenue by 2025, establishing it as the dominant organization size category. This growth is being fueled by the significant security and compliance requirements of large scale organizations, which manage vast user bases and sensitive information assets.
These enterprises have been early adopters of advanced identity governance solutions due to their ability to handle complex IT infrastructures and global operations. Investment capacity, coupled with strong regulatory oversight, has further encouraged deployment of comprehensive identity governance frameworks.
Large enterprises continue to lead adoption trends as they prioritize risk mitigation, data integrity, and compliance with stringent international standards.
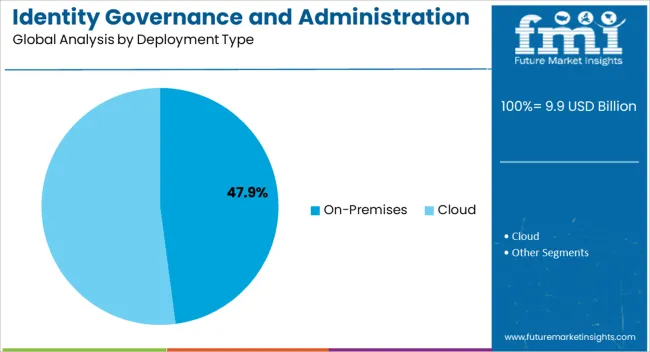
The on premises segment is anticipated to capture 47.90% of total market revenue by 2025 under the deployment type category, securing a leading position. Its growth is primarily linked to enterprises with strict data residency requirements, regulatory compliance obligations, and a preference for retaining full control over sensitive identity data.
On premises models have been favored in highly regulated sectors such as banking, healthcare, and government where security concerns outweigh the flexibility of cloud based systems. The ability to customize deployments according to organizational policies and integrate with legacy systems has reinforced its adoption.
Despite the growing trend toward cloud, on premises deployment remains a critical choice for enterprises seeking maximum data sovereignty and control.
Organizational deployment is required for the identity governance and administration program. The identity governance and administration rollout is problematic due to lockdowns and social distance. In the short term, the identity governance and administration industry is projected to see increased demand for identity governance and administration solutions due to work-from-home practices.
The identity governance and administration industry is being driven by an increase in regulatory compliance. Many businesses are now required to follow specific guidelines.
In any organization, keeping track of an employee's details from the time they join until the time they retire is a must, as a result, the demand for identity governance and administration solutions is anticipated to rise.
The organization's stringent compliance standards are a key driver for identity governance and the administration industry. Due to these factors, the identity governance and administration program has a high adoption rate.
The sales of identity governance and administration sales are predicted to increase as a result of the rising adoption rates. Furthermore, any organization can benefit from identity governance and administration programs' operational efficacy. It is another factor that influences the demand for identity governance and administration solutions. These apps make it very simple to keep track of, maintain, and use data.
Professional identity governance and administration services are also sought by some organizations. In the projected year 2025, both of these market categories are expected to be in high demand. Furthermore, identity governance and administration have several features, such as fraud prevention and security benefits.
Globalization is likely to present identity governance and the administration industry with significant growth prospects. Globalization has an impact on the size and growth of the identity governance and administration market. Identity governance and administration solutions are in high demand for large-scale entropies.
During the predicted period, globalization is likely to boost the identity governance and administration solution acceptance rate. In 2035, the identity governance and administration industry growth rate is anticipated to be at its peak. Globalization is likely to enable the identity governance and administration industry to expand in numerous regions.
Data is being used frequently. The majority of the company works with a large volume of data. The leading corporation has a lot of data on its employees. The market makes it simple to make effective use of these data. The increased usage of data in the workplace is projected to boost the market's growth prospects.
The development of hybrid identity governance and administration solutions is anticipated to expand the company's growth prospects. Cloud and other unique elements are included in the hybrid program.
By organization size, the SME segment is projected to dominate the market. Improved operational productivity encourages SMEs to embrace identity governance and administration solutions.
Identity governance and administration solutions enable businesses to improve the customer experience while strengthening security and reducing fraud. As a result, security is critical for any firm, regardless of its size. The SMEs segment is the significantly growing segment in the market, as cloud-based solutions and services help them improve business performance. However, due to the affordability and early adoption of emerging technologies, the large enterprise segment is expected to hold a notable share of the market.
| Category | By Component |
|---|---|
| Top Segment | Solution |
| Market Share in Percentage | 71.2% |
| Category | By Organization Size |
|---|---|
| Top Segment | Large Enterprises |
| Market Share in Percentage | 58.3% |
During the forecast period, the services category is expected to be a significant contributor to market growth.
Solution providers offer identity governance and administration services to help customers utilize and manage their identity governance and administration solutions efficiently. Identity management entails a variety of services that work together to proactively identify issues and offer the best approach for resolving them.
Vendors are constantly adding and offering new services, such as professional and managed services to broaden their customer base as the market is flexible. To provide access governance and control compliance, identity governance and administration services improve and automate identity management procedures.
| Regional Market Comparison | Global Market Share in Percentage |
|---|---|
| North America | 33.7% |
| Europe | 22.9% |
North America is predicted to be the key market share contributor by 2035 due to the growing adoption of identity governance and administration solutions and services across companies in the area. This trend is expected to continue during the projection period.
The region has been an early user of modern security systems and techniques, as well as several creative initiatives. Several leading identity governance and administration providers have a direct or indirect presence in this region through system integrators, distributors, and resellers.
| Regional Market Comparison | Global Market Share in Percentage |
|---|---|
| The United States | 22.7% |
| Germany | 8.1% |
| Japan | 6.2% |
| Australia | 1.9% |
Asia Pacific region is predicted to demonstrate the highest adoption of cloud identity and access management solutions due to several factors such as:
According to a VMware update, cloud adoption is predicted to increase consistently across all end-user industries in India. In addition, cloud-based identity governance and administration solutions are projected to gain traction in the region. Furthermore, many breaches in a variety of end-user sectors across the region are likely to drive up demand for advanced and upgraded identity governance and administration solutions.
| Regions | CAGR (2025 to 2035) |
|---|---|
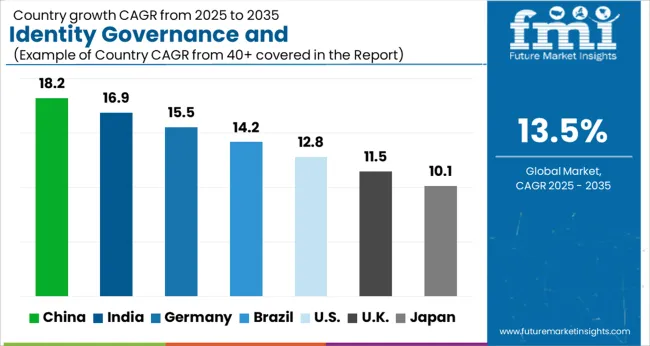
| The United States of America | 13.3% |
| The United Kingdom | 11.6% |
| China | 14.2% |
| Japan | 12% |
| South Korea | 11.2% |
| India | 17.7% |
Several provinces, such as China, are embracing WeChat personal IDs as an official national electronic individual ID to eliminate duplicate identities and avoid identity theft from government databases,
China is the country with the second high number of identity thefts worldwide. Due to the numerous growth potential in the area, multiple solution providers are extending their identity governance and administration solutions in the region as a substantial expansion policy to achieve maximum market share.
The market is moderately fragmented, with multiple global and regional competitors. The market, on the other hand, is turning toward the consolidation of small businesses. Several industry companies are using innovations to get a competitive advantage in the market.
Recent Developments in the Identity Governance and Administration Market
The global identity governance and administration market is estimated to be valued at USD 9.9 billion in 2025.
The market size for the identity governance and administration market is projected to reach USD 35.1 billion by 2035.
The identity governance and administration market is expected to grow at a 13.5% CAGR between 2025 and 2035.
The key product types in identity governance and administration market are solution, services, managed services and professional services.
In terms of organization size, large enterprises segment to command 62.7% share in the identity governance and administration market in 2025.


Our Research Products

The "Full Research Suite" delivers actionable market intel, deep dives on markets or technologies, so clients act faster, cut risk, and unlock growth.

The Leaderboard benchmarks and ranks top vendors, classifying them as Established Leaders, Leading Challengers, or Disruptors & Challengers.

Locates where complements amplify value and substitutes erode it, forecasting net impact by horizon

We deliver granular, decision-grade intel: market sizing, 5-year forecasts, pricing, adoption, usage, revenue, and operational KPIs—plus competitor tracking, regulation, and value chains—across 60 countries broadly.

Spot the shifts before they hit your P&L. We track inflection points, adoption curves, pricing moves, and ecosystem plays to show where demand is heading, why it is changing, and what to do next across high-growth markets and disruptive tech

Real-time reads of user behavior. We track shifting priorities, perceptions of today’s and next-gen services, and provider experience, then pace how fast tech moves from trial to adoption, blending buyer, consumer, and channel inputs with social signals (#WhySwitch, #UX).

Partner with our analyst team to build a custom report designed around your business priorities. From analysing market trends to assessing competitors or crafting bespoke datasets, we tailor insights to your needs.
Supplier Intelligence
Discovery & Profiling
Capacity & Footprint
Performance & Risk
Compliance & Governance
Commercial Readiness
Who Supplies Whom
Scorecards & Shortlists
Playbooks & Docs
Category Intelligence
Definition & Scope
Demand & Use Cases
Cost Drivers
Market Structure
Supply Chain Map
Trade & Policy
Operating Norms
Deliverables
Buyer Intelligence
Account Basics
Spend & Scope
Procurement Model
Vendor Requirements
Terms & Policies
Entry Strategy
Pain Points & Triggers
Outputs
Pricing Analysis
Benchmarks
Trends
Should-Cost
Indexation
Landed Cost
Commercial Terms
Deliverables
Brand Analysis
Positioning & Value Prop
Share & Presence
Customer Evidence
Go-to-Market
Digital & Reputation
Compliance & Trust
KPIs & Gaps
Outputs
Full Research Suite comprises of:
Market outlook & trends analysis
Interviews & case studies
Strategic recommendations
Vendor profiles & capabilities analysis
5-year forecasts
8 regions and 60+ country-level data splits
Market segment data splits
12 months of continuous data updates
DELIVERED AS:
PDF EXCEL ONLINE
Identity Verification Market Analysis - Size, Share, and Forecast 2025 to 2035
Identity Analytics Market Size and Share Forecast Outlook 2025 to 2035
Identity-as-a-Service (IDaaS) Market Outlook 2025 to 2035 by Access Type, Enterprise Size, Service Type, Application, Industry, and Region
Identity And Access Management As A Service (IAMaaS) Market Size and Share Forecast Outlook 2025 to 2035
Identity & Access Management Market Growth – Demand, Trends & Forecast 2025-2035
Cloud Identity Management Market
Bimodal Identity Management Solutions Market Size and Share Forecast Outlook 2025 to 2035
Digital Identity Services Market Size and Share Forecast Outlook 2025 to 2035
Understanding Market Share Trends in Travelers Identity Protection
Travelers Identity Protection Services Market Analysis by Service Type, by Subscription Model, by End User , by Nationality and by Region - Forecast for 2025 to 2035
Blockchain Identity Management Market Size and Share Forecast Outlook 2025 to 2035
e-Government Identity Management Market
Data Governance – AI-Driven Compliance & Security
Cloud Governance Platform Market – Compliance & Data Integrity
IoT Data Governance Market
Enterprise AI Governance and Compliance Market Analysis - Size, Share, and Forecast Outlook 2025 to 2035
Bank Regulatory & Governance Consulting Market Size and Share Forecast Outlook 2025 to 2035
Systems Administration Management Tools Market Size and Share Forecast Outlook 2025 to 2035
Third Party Administration (TPA) Service Market Size and Share Forecast Outlook 2025 to 2035
Android Automotive OS (AAOS) Market Size and Share Forecast Outlook 2025 to 2035

Thank you!
You will receive an email from our Business Development Manager. Please be sure to check your SPAM/JUNK folder too.
Chat With
MaRIA