
- Market Size (2026)
- USD 40.7 Bn
- Forecast (2036)
- USD 76.3 Bn
- CAGR (2026 to 2036)
- 6.5%
How Big Is the Professional Employer Organization Market in 2026?
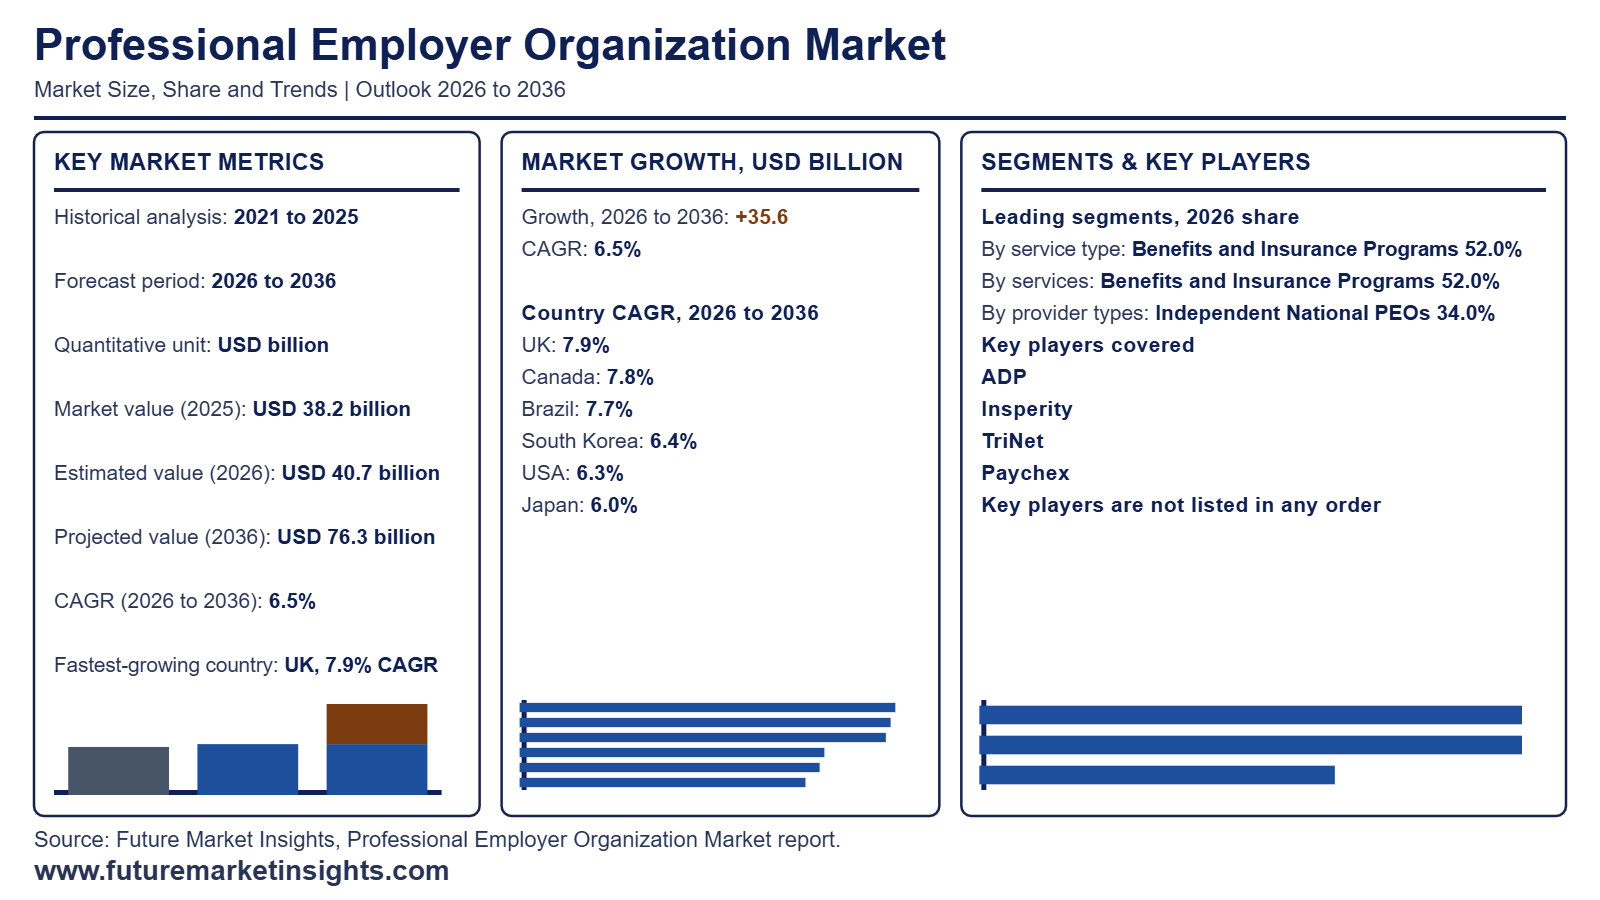
The global professional employer organization market is valued at USD 40.7 billion in 2026, up from USD 38.2 billion in 2025, and is projected by Future Market Insights (FMI) to reach USD 76.3 billion by 2036, expanding at a 6.5% CAGR over the 2026 to 2036 forecast period.
| Market Metric | Valuation / Share / Forecast Benchmark |
|---|---|
| 2025 Market Size (Historical) | USD 38.2 billion |
| 2026 Market Size (Estimated) | USD 40.7 billion |
| 2036 Market Size (Projected) | USD 76.3 billion |
| Compound Annual Growth Rate (2026 to 2036) | 6.5% CAGR |
| Incremental Dollar Opportunity (2026 to 2036) | USD 35.6 billion |
| Dominant Service Type (2026 to 2036 Share) | Benefits and Insurance Programs (52.0% in 2026, rising to 54.1% by 2036) |
| Leading & Fastest-Growing Services | Benefits and Insurance Programs (52.0% share in 2026; 6.9% CAGR) | HR Compliance and Advisory (7.2% CAGR) |
| Leading & Fastest-Growing Client Sizes | 10 to 49 Employees (38.0% share in 2026; 6.8% CAGR) | 1 to 9 Employees (7.1% CAGR) |
| Leading & Fastest-Growing Provider Types | Independent National PEOs (34.0% share in 2026; 6.7% CAGR) | Technology-Led PEOs (8.0% CAGR) |
| Largest Country Markets (2026 Global Share) | USA (72.0%), UK (6.0%), Canada (5.0%) |
| Fastest-Growing Country Markets (2026 to 2036) | UK (7.9% CAGR), Canada (7.8% CAGR), Brazil (7.7% CAGR) |
| Leading Tier-1 Companies | ADP, Insperity, TriNet, Paychex |
Source: Future Market Insights analysis of the professional employer organization market, 2026.
Executive Market Overview
Professional employer organizations grow because small employers need pooled scale to spread HR and benefits and payroll compliance costs while workers still expect competitive coverage. A PEO co-employs the staff and pools buying power for health plans and workers’ compensation and tax filing. Cost data shows the pressure since benefits make up 30.0% of private industry compensation or USD 14.07 of USD 46.89 per hour worked (Bureau of Labor Statistics 2026). The addressable base is wide as 6.4 million small employer firms provide jobs for about 62.3 million people (SBA Office of Advocacy 2026). This explains why Benefits and Insurance Programs holds 52.0% of Service revenue with a 6.9% CAGR while firms with 10 to 49 employees hold 38.0% of Client Size at 6.8%.
Client sensitivity to benefits repricing is the restraint specific to this market since small firms can switch providers at annual renewals when health plan costs rise. Voluntary IRS certification adds a quality signal because applicants need a history of financial responsibility and tax compliance (Internal Revenue Service 2026). Providers that bundle payroll with benefits hold the advantage as Independent National PEOs lead Provider Type at 34.0% with a 6.7% CAGR and Professional Services leads Client Industry at 29.0% with 6.8%. The UK is the fastest-growing country at a 7.9% CAGR ahead of Canada at 7.8% and Brazil at 7.7% as small employers outsource HR duties. South Korea at 6.4% and the USA at 6.3% sit above Japan at 6.0% within human capital management programs. Market sizing covers co-employment services and excludes standalone payroll software and temporary staffing.
Analyst Perspective
The professional employer organization market is growing as small and midsize businesses outsource payroll and benefits to manage complex labor regulations. Providers that integrate cloud HR platforms with compliance expertise will gain stronger client retention and expand service revenue across small business segments.
- Anurag Sharma, Principal Consultant, Future Market Insights.
Major Market Trends and Insights
- Higher Fees Per Employee Now Drive PEO Earnings Growth: Margin recovery in the PEO space is coming from what each worksite employee pays rather than from how many employees a provider enrolls. Benefit costs keep climbing so providers pass them through and pair the new fees with richer technology and advisory support. Insperity (October 2026) reports average paid worksite employees easing 2% to about 307 thousand while monthly revenue per worksite employee grew 4% and benefit cost per covered employee also grew 4%. Gross profit per worksite employee reached USD 225 a month. Providers that justify price with service depth are setting the pace for the whole market.
- Federal Joint Employer Proposal Gives PEO Contracts Firmer Ground: The US Department of Labor (April 2026) put forward a proposed rule on 22 April 2026 that would bring joint employer analysis under three federal laws into one framework with comments due 22 June 2026. PEOs live inside co-employment so a single test lets providers and clients allocate wage and leave duties with greater certainty. Service agreements and risk pricing can then follow one clear standard. The IRS (July 2026) already supports that confidence through its voluntary certified PEO program created by the Tax Increase Prevention Act of 2014. Certified providers can use the proposal to sharpen client conversations.
- TriNet Shows Claims Discipline Now Shapes PEO Client Mix: Pooled health and workers compensation programs generate much of a PEO billing base so claims experience now guides which clients a provider keeps and how it sells. Tighter selection protects margin and sets the stage for healthier growth. TriNet (October 2026) posted an insurance cost ratio of 89% against 90% a year earlier while total worksite employees settled near 295 thousand and revenues reached USD1.18 billion. Management said new sales returned to year over year growth and retention improved. Providers that keep insurance costs in range gain room to win accounts with confidence. That balance supports steadier earnings across the next planning cycle.
What Are the Main Drivers, Restraints, and Opportunities?
Pooled benefits buying keeps small employers inside PEO programs while insurance cost swings and shifting client counts test provider pricing and that contest favors independent national PEOs that bundle certified tax handling with compliance help for UK and professional services clients.
Driver: Pooled Benefits Programs Anchor Small Employer Demand
Group health and workers compensation cover costs less per head when many small employers share one pool and that pooling is what PEOs sell. Benefits and Insurance Programs therefore hold 52.0% of 2026 revenue with clients of 10 to 49 employees at 38.0%. Paychex (June 2026) booked PEO and Insurance Solutions revenue of USD 369.7 million in its fourth quarter up 9% on more average PEO worksite employees and higher insurance revenue. The Internal Revenue Service (September 2026) ties certification to bonding and tax compliance requirements. Independent national PEOs at 34.0% can turn that credential into wins against buyers of separate payroll and HR solutions.
Restraint: Benefits Cost Pass-Through Shapes Client Retention
Annual benefit renewals decide how much cost a PEO can pass on and some small clients weigh standalone HR software against co-employment when prices move. Insperity (October 2026) reported benefits cost per covered employee up 4% and average paid worksite employees down 2% to 307265 while revenue per worksite employee rose 4% on higher pricing. TriNet (October 2026) reported worksite employees down 11% to about 295000 with an insurance cost ratio of 89%. Providers can protect retention by pairing each repricing with human capital management tools that keep small clients engaged. Clear explanations of each change also matter at renewal.
Opportunity: Compliance Complexity Opens UK and Professional Services Demand
Shifting employment rules add paperwork for small employers and that lifts the value of compliance support bundled with payroll and benefits. Smaller firms rarely keep dedicated employment counsel so they lean on outside HR teams to read each rule change and that reliance supports renewals. The UK shows the clearest pull as the fastest growing country. GOV.UK (November 2026) updated its Employment Rights Act timetable to confirm October 2026 measures and detail 2027 commencement dates. Providers serving Professional Services clients at 29.0% can pair UK policy updates with Europe payroll and HR support to build stickier client relationships across Britain.
How Is the Professional Employer Organization Market Segmented?
The global professional employer organization market is analyzed through service and client size and client industry and provider type with each axis carrying its own share distribution and describing a separate commercial attribute.
| Segmentation Axis | Sub-Segments Covered | 2026 Leading Segment and Share | Main Growth Benchmark (2026 to 2036) |
|---|---|---|---|
| Service | Benefits and Insurance Programs / Payroll and Tax Administration / Risk Management and Workers’ Compensation / HR Compliance and Advisory / Recruiting and Training | Benefits and Insurance Programs (52.0% revenue share) | Benefits and Insurance Programs share rises to 53.0% by 2036 at 6.7% CAGR |
| Client Size | 10 to 49 Employees / 100 Employees and Above / 1 to 9 Employees / 50 to 99 Employees | 10 to 49 Employees (38.0% revenue share) | 10 to 49 Employees share rises to 38.4% by 2036 at 6.6% CAGR |
| Client Industry | Professional Services / Technology / Healthcare / Construction / Manufacturing | Professional Services (29.0% revenue share) | Professional Services grows at 6.4% CAGR to a 28.7% share by 2036 |
| Provider Type | Independent National PEOs / Payroll-Provider PEOs / Regional and Specialty PEOs / Technology-Led PEOs | Independent National PEOs (34.0% revenue share) | Independent National PEOs grow at 6.3% CAGR to a 33.4% share by 2036 |
| Region | North America / Latin America / Western Europe / Eastern Europe / East Asia / South Asia and Pacific / Middle East and Africa | North America (74.0% revenue share) | United Kingdom leads country growth at 7.9% CAGR |
Source. Future Market Insights analysis of the professional employer organization market 2026.
Why Do Benefits and Insurance Programs Lead by Service?
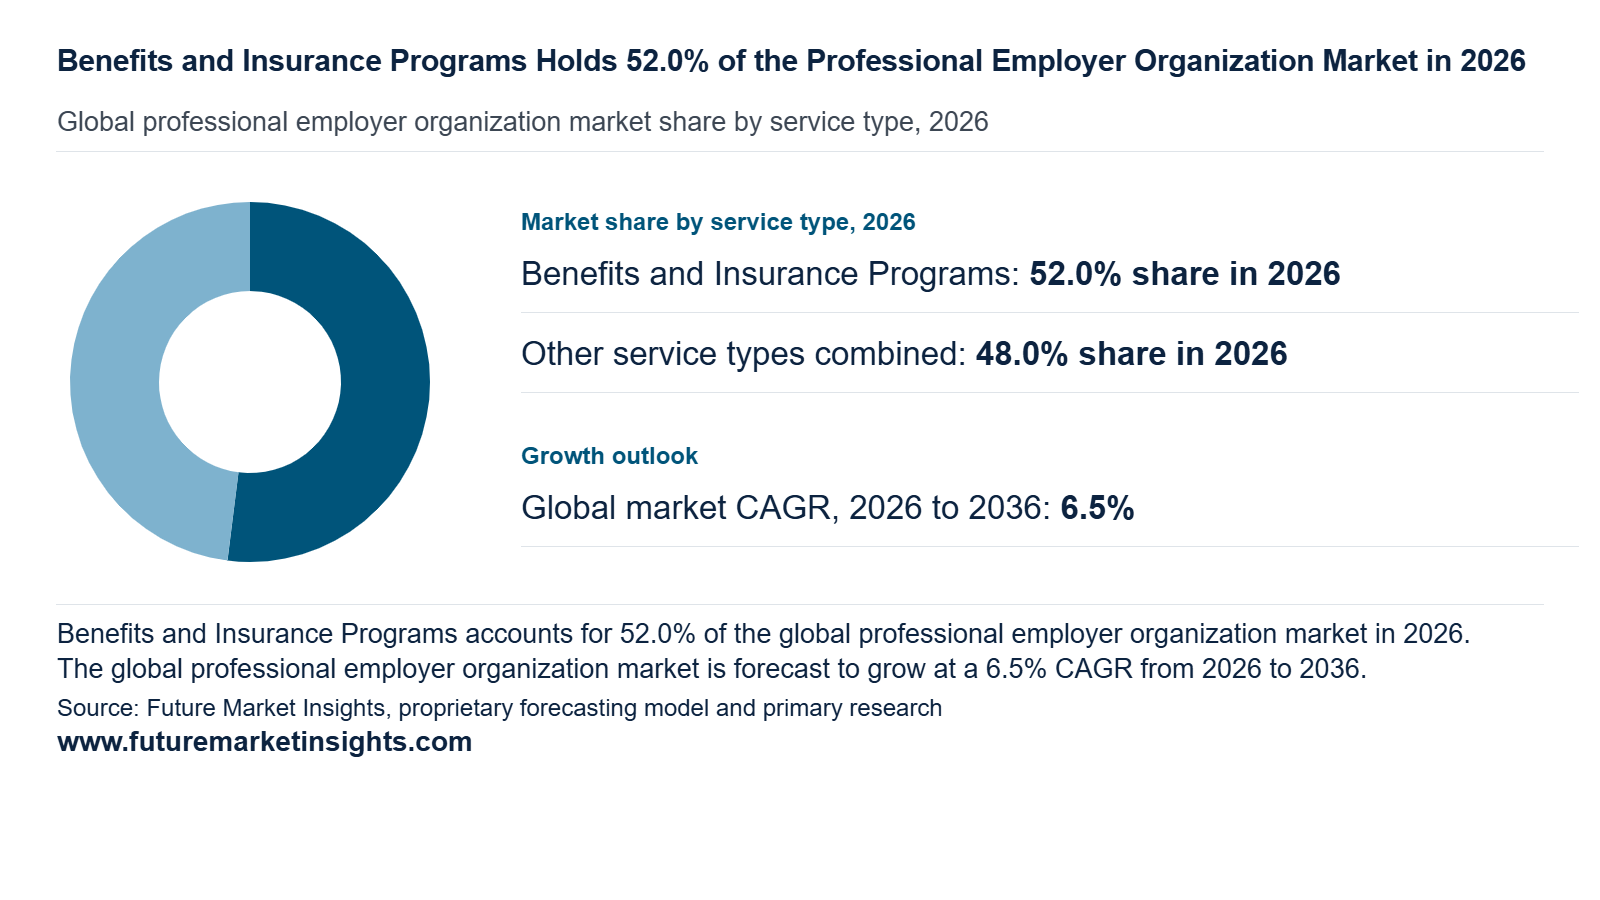
Benefits and insurance programs lead by service with a 52.0% share in 2026 and are projected to reach 53.0% by 2036 at a 6.7% CAGR. Small employers join a PEO mainly to reach pooled health plans and retirement offerings priced like those of much larger companies. Platform choices shape human capital management adoption inside client firms. ADP and Insperity and TriNet earn much of their revenue through benefits placement. Growing premium budgets push owners to outsource plan design and renewals to a co-employment partner. Payroll and tax administration and risk management and HR compliance and recruiting and training attach as add-on layers.
Why Does the 10 to 49 Employees Group Lead by Client Size?
Clients with 10 to 49 employees form the largest client size group with a 38.0% share in 2026 and are projected to reach 38.4% by 2036 at a 6.6% CAGR. Firms at this scale have outgrown owner-run payroll and rely on a PEO for compliance support and benefits access across multiple states. Justworks and Paychex and Vensure Employer Services target this band with bundled onboarding and mobile employee portals. Hiring across state lines raises payroll tax registrations and leave rules that a PEO files on the client’s behalf. Companies with 1 to 9 employees buy lighter packages while those with 50 employees and above negotiate tailored service levels.
Why Does Professional Services Lead by Client Industry?
Professional services lead client industry with a 29.0% share in 2026 and are projected to account for 28.7% by 2036 at a 6.4% CAGR. Accounting and legal and consulting and marketing firms employ skilled staff whose retention depends on competitive benefits and clean payroll operations. Partners prefer to spend time on billable work and hand administration to a PEO under a co-employment agreement. Remote and multi-state teams in these firms add tax filings and expense rules that PEO platforms standardize. Technology clients seek equity plan administration while healthcare and construction and manufacturing buyers focus on credential tracking and workers’ compensation and safety programs.
Why Do Independent National PEOs Lead by Provider Type?
Independent national PEOs lead provider type with a 34.0% share in 2026 and are projected to stand at 33.4% by 2036 while growing at a 6.3% CAGR. Insperity and TriNet and Vensure Employer Services operate multi-state licensing and carrier relationships that regional providers take years to build. Certified PEO status under the IRS program gives clients assurance on payroll tax liability. Payroll-provider PEOs such as ADP and Paychex lean on large payroll bases to cross-sell co-employment. Regional and specialty PEOs such as Barrett Business Services serve niches such as skilled trades while technology-led PEOs such as Rippling and Justworks win founders with software-first onboarding
Professional Employer Organization Market by Region and Country (2026 to 2036)
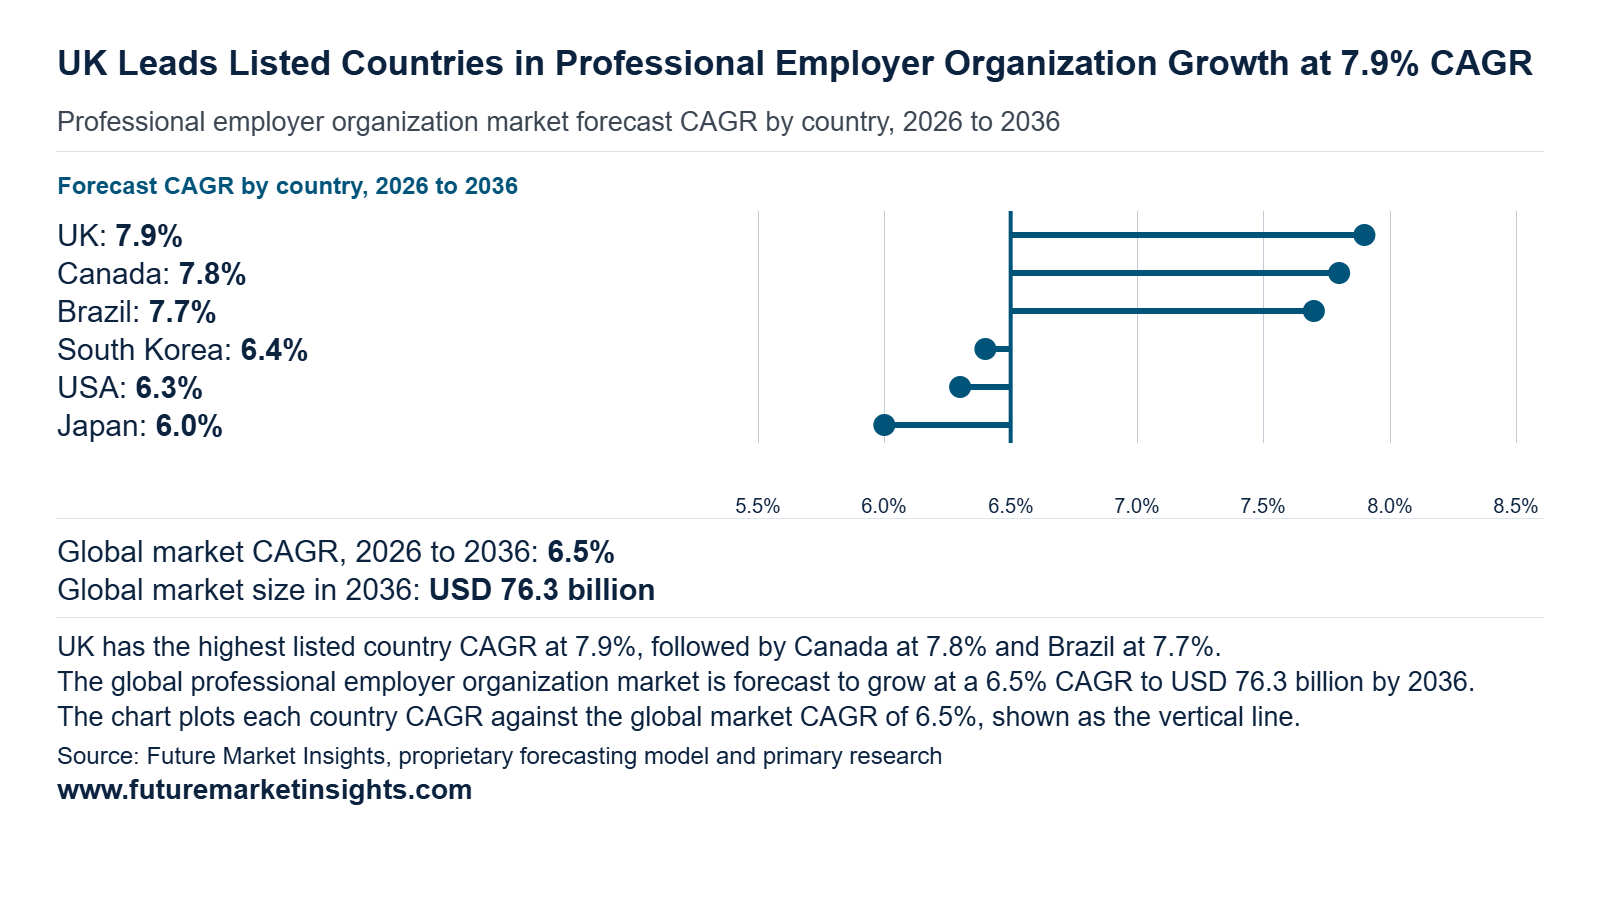
The six profiled countries hold about 65.5% of global professional employer organization revenue in 2026 and 63.5% by 2036 as markets outside the group scale slightly faster. Together they add USD 30.32 billion which equals about 61.5% of the USD 49.3 billion global increment. The UK leads the growth ranking at 7.9% while the USA contributes USD 20.15 billion of the gain. Employment law reform in the UK and subcontracting rules in South Korea show that compliance duties now push small employers toward outsourced HR and payroll.
| Country | 2026 Revenue | 2036 Revenue | 10-Year Addition | 2026 to 2036 CAGR | Global Share (2026 → 2036) |
|---|---|---|---|---|---|
| UK | USD 3.12 billion | USD 6.67 billion | +USD 3.55 billion | 7.9% | 6.0% → 6.6% |
| Canada | USD 1.82 billion | USD 3.86 billion | +USD 2.04 billion | 7.8% | 3.5% → 3.8% |
| Brazil | USD 1.30 billion | USD 2.73 billion | +USD 1.43 billion | 7.7% | 2.5% → 2.7% |
| South Korea | USD 1.04 billion | USD 1.93 billion | +USD 0.89 billion | 6.4% | 2.0% → 1.9% |
| USA | USD 23.92 billion | USD 44.07 billion | +USD 20.15 billion | 6.3% | 46.0% → 43.5% |
| Japan | USD 2.86 billion | USD 5.12 billion | +USD 2.26 billion | 6.0% | 5.5% → 5.1% |
| Rest of World | USD 17.94 billion | USD 36.96 billion | +USD 19.02 billion | 7.5% | 34.5% → 36.5% |
Source: Future Market Insights analysis of the professional employer organization market, 2026.
UK
The UK is the fastest-growing country in the professional employer organization market at a 7.9% CAGR. Revenue moves from an assumed USD 3.12 billion in 2026 to USD 6.67 billion by 2036 and adds USD 3.55 billion. A phased rewrite of employment law explains this pace. Acas (November 2026) notes that the Employment Rights Act 2025 became law on 18 December 2025. Holiday and pay records must be kept for at least 6 years and statutory sick pay starts on day one from 6 April 2026. The Fair Work Agency began enforcement on 7 April 2026 and tribunal time limits rose from 3 to 6 months on 1 October 2026. Small employers in hospitality and retail therefore seek outsourced HR and payroll compliance to manage record keeping and enforcement exposure. Flexible working and dismissal changes due in October 2027 should extend this demand.
Canada
Statistics Canada (August 2026) counted about 1.37 million employer businesses in June 2026 alongside 3.78 million non-employer businesses with annual revenues above 30 thousand dollars. Canada posts a 7.8% CAGR and ranks second among the profiled countries. Revenue rises from an assumed USD 1.82 billion in 2026 to USD 3.86 billion by 2036 and adds USD 2.04 billion. A broad base of small payroll employers underpins this momentum. A business counts as an employer once it files payroll deduction remittances with the Canada Revenue Agency. Many non-employer businesses are likely to cross that threshold as they hire their first staff. These first-time employers in Ontario and Quebec and Alberta and British Columbia look to shared HR and benefits and payroll platforms and this supports adoption through 2036.
Brazil
Brazil registers a 7.7% CAGR and holds third place among the profiled countries. Revenue moves from an assumed USD 1.30 billion in 2026 to USD 2.73 billion by 2036 and adds USD 1.43 billion. Payroll digitization shapes this outlook. The government eSocial platform (February 2026 manual) offers a simplified module that lets a microentrepreneur register employees and close monthly payroll and print payslips. It also covers vacation scheduling and terminations. The unified DAE slip has combined INSS and FGTS since January 2022 and is payable by the 20th of the following month since March 2024. Small employers that grow beyond the simplified module need support with calculation and filing. This opens room for outsourced employer services across Sao Paulo and Minas Gerais through 2036.
South Korea
South Korea advances at a 6.4% CAGR and ranks fourth among the profiled countries. Revenue moves from an assumed USD 1.04 billion in 2026 to USD 1.93 billion by 2036 and adds USD 0.89 billion. Subcontracting reform is reshaping employer responsibilities. Korea.net (October 2025) reports that the Yellow Envelope Act amended the Trade Union and Labor Relations Adjustment Act. It lets subcontracted workers negotiate with the primary contractors that control their working conditions. The law took effect on 10 March 2026 and the labor ministry planned guidelines and manuals ahead of that date. Manufacturers and construction contractors with layered supply chains now review who acts as the employer for each worker group. They look for outsourced employment administration that documents these relationships and this should lift adoption through 2036.
USA
The USA holds the largest position with an assumed 46.0% share in 2026 and a 6.3% CAGR that ranks fifth among the profiled countries. Revenue moves from an assumed USD 23.92 billion to USD 44.07 billion by 2036 and adds USD 20.15 billion. A federal certification route builds buyer confidence. The Internal Revenue Service (July 2026) requires each certified professional employer organization to apply through its Online Registration System and complete fingerprint based background checks for responsible individuals. The application carries a USD 1000 user fee. Small employers in states from Texas to Florida therefore gain a recognized benchmark for shifting payroll tax filing and benefits administration to a certified provider. This assurance supports steady renewals and gradual penetration among growing firms through 2036.
Japan
Japan closes the ranking at a 6.0% CAGR with revenue moving from an assumed USD 2.86 billion in 2026 to USD 5.12 billion by 2036. The addition of USD 2.26 billion reflects a labor supply constrained economy. METI (April 2026) reports that small and medium enterprises recorded their largest spring wage increases in nearly 30 years and that minimum wages are rising. The Cabinet approved white paper also expects the number of SME employees to shrink as Japan becomes a labor supply constrained society. Small enterprises with modest management resources benefit from cooperating with other businesses. This favors shared HR and payroll services among regional firms as wage planning and recruitment grow more demanding through 2036.
Competitive Environment and Notable Companies
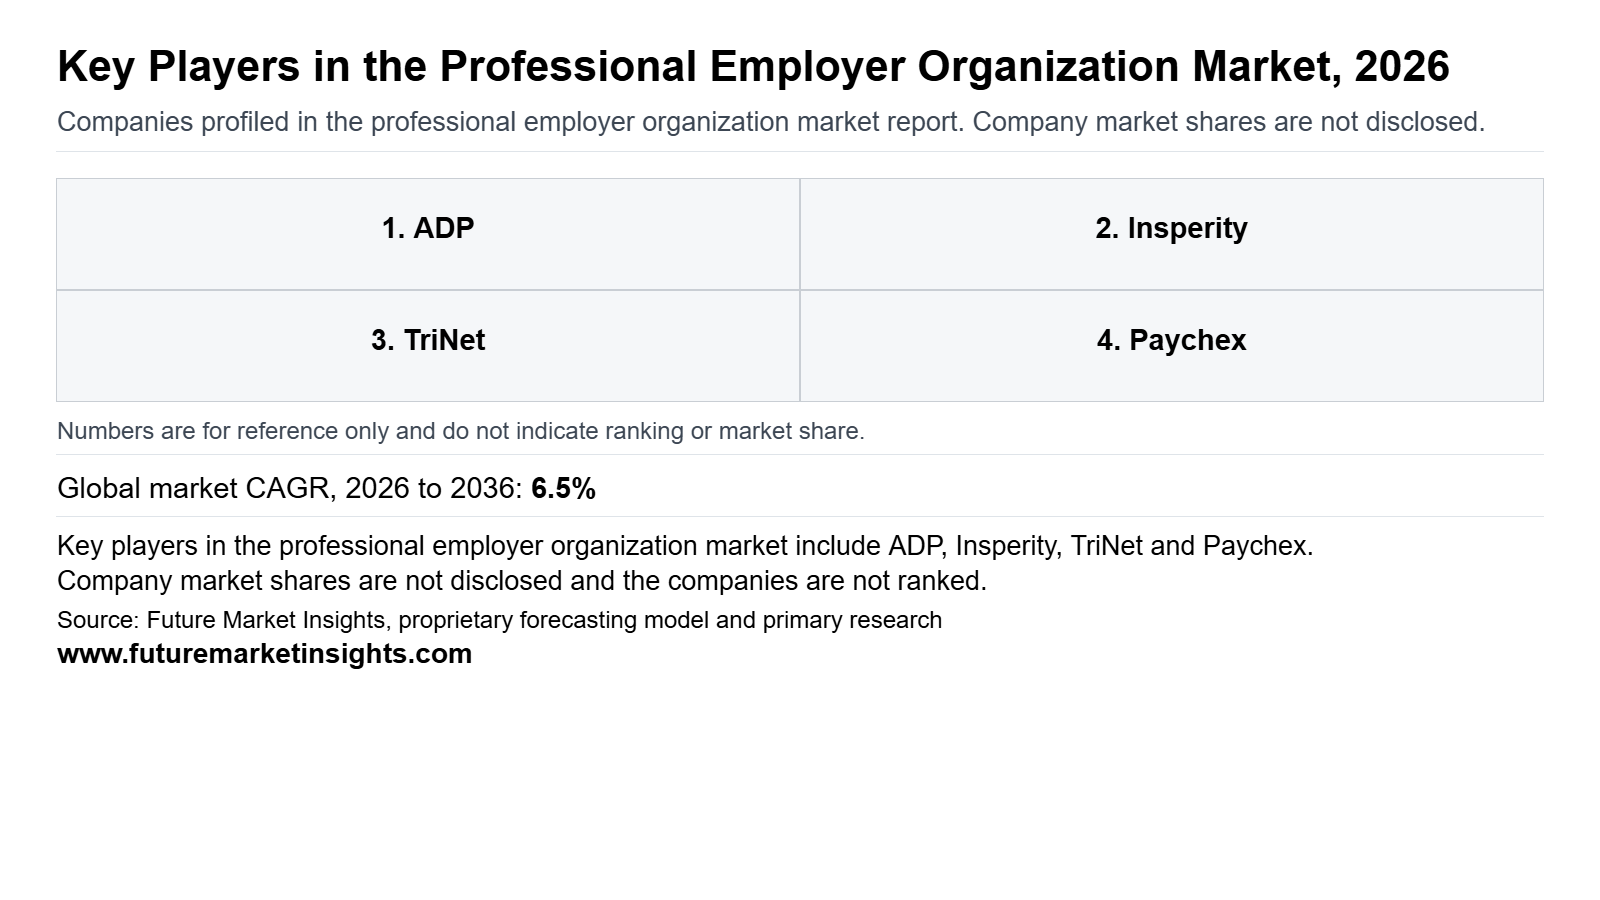
Notable companies operating in the global professional employer organization market include ADP, Insperity, TriNet, Paychex, Vensure Employer Services, Justworks, Barrett Business Services, and Rippling. Competition forms at two structural levels. Scaled full-service providers such as ADP and Paychex pair co-employment with payroll and benefits distribution across large client bases. Technology-led and niche specialists such as Rippling and Justworks and BBSI compete through platform design and risk-focused service. Small and midsize employers choose the partner that combines benefits purchasing power with compliance certainty and this keeps ADP as the leading company. Technology alliances and employer-of-record extensions offer the clearest partnership scope beyond the core US co-employment base.
How Are Companies Positioned in the Professional Employer Organization Market?
Positioning splits between payroll-anchored scale providers and focused specialists. ADP and Paychex sell co-employment into client bases that already run payroll with them and this lowers acquisition cost and deepens retention. Vensure Employer Services pursues scale through acquisition and completed its 108th deal in April 2026 (Vensure, April 2026). Paychex reported PEO and insurance solutions revenue growth of 9% to USD 397.5 million on higher average worksite employees (Paychex, March 2026). Scale therefore rewards providers able to bundle payroll and benefits and insurance under one contract.
What Matters When a Buyer Selects a Professional Employer Organization Supplier?
Small and midsize employers select a supplier on benefits access and compliance certainty because health plan pricing and payroll tax liability are the largest exposures that co-employment removes from their books. ADP states that TotalSource is both ESAC-accredited and an IRS-certified PEO and supports over 761 thousand employees (ADP, May 2026). The same release cites a Business.com ranking that names TotalSource best for benefits administration. Buyers should therefore compare carrier networks and accreditation status before price.
Which Capabilities Distinguish Product Offers?
Product offers now differ on how deeply technology sits inside the co-employment relationship. Insperity made HRScale generally available on 26 February 2026 as a comprehensive HR services and technology offering for small and midsized businesses built with Workday (Insperity, February 2026). TriNet is adding leave management through Cocoon and recruiting through JazzHR and payroll-linked spending to its platform (TriNet, October 2026). These additions raise switching costs because more workflows live on one employee record. BBSI advanced a number of IT initiatives to strengthen its technology platform (BBSI, May 2026).
How Does Geographic Reach Affect Competition?
Reach in this market depends on footprint breadth and acquired local books more than on cross-border expansion. BBSI works with more than 8200 PEO clients in all 50 states (BBSI, May 2026) and this coverage supports local service depth. Vensure added organizations across California and Arizona and Nevada and Washington and Texas and extended into Michigan and New York and Georgia and North Carolina (Vensure, April 2026). Acquisitions therefore let regional specialists convert local books into national scale.
| Verified Company Evidence (2026) | Commercial Effect | Buyer Action |
|---|---|---|
| 26 February 2026 Insperity announced general availability of HRScale built with Workday for small and midsized businesses [Insperity (February 2026)]. | Moves a co-employment provider toward enterprise-grade technology and widens its target client size. | Evaluate Workday-based deployment effort against standard PEO platforms. |
| 24 April 2026 Vensure completed its 8th acquisition of the year and reached 108 in total with more than 80 thousand worksite employees represented [Vensure (April 2026)]. | Consolidation lifts scale and adds regional books across the Western and Eastern states. | Confirm service continuity and plan terms when a provider changes ownership. |
| 13 October 2026 TriNet announced leave management through Cocoon and recruiting through JazzHR and a payroll-linked spending product [TriNet (October 2026)]. | Expands the platform footprint inside each client and raises switching costs. | Compare bundled modules against stand-alone tools before renewal. |
Source: Verified corporate disclosures and Future Market Insights analysis, 2026.
| Company | Core Positioning | Verified Activity & Source Attribution |
|---|---|---|
| ADP | Payroll-anchored full-service PEO through ADP TotalSource and the leading company | Cited a Business.com ranking naming TotalSource best for benefits administration on 18 May 2026 (ADP, May 2026). |
| Insperity | Full-service PEO with HR360 and HRScale | HRScale reached general availability on 26 February 2026 (Insperity, February 2026). |
| TriNet | PEO and HR platform for small and medium-size businesses | Expanded embedded HR and AI capabilities on 13 October 2026 (TriNet, October 2026). |
| Paychex | Payroll and HCM provider with PEO and insurance solutions | PEO and insurance solutions revenue rose 9% in the quarter ended 28 February 2026 (Paychex, March 2026). |
| Vensure Employer Services | Acquisition-led HR outsourcing group | Completed its 108th acquisition on 24 April 2026 (Vensure, April 2026). |
| Justworks | PEO and payroll for small businesses | Positioning only. Recent activity sits outside the source list. |
| Barrett Business Services | HR outsourcing combined with management consulting | Works with more than 8200 PEO clients in all 50 states (BBSI, May 2026). |
| Rippling | HR and IT and finance platform with a PEO offering | Positioning only. Recent activity sits outside the source list. |
Source: Verified corporate disclosures and Future Market Insights analysis, 2026.
Research Sources and Bibliography
- Acas (November 2026). Employment Rights Act 2025 [guidance page, updated 12 November 2026]. https://www.acas.org.uk/employment-rights-act-2025
- ADP (May 2026). Best PEO for Benefits Administration (ADP TotalSource®) [Press release, 18 May 2026]. https://mediacenter.adp.com/best-peo-for-benefits-administration-adp-totalsource
- BBSI (May 2026). BBSI Reports First Quarter 2026 Financial Results [Press release, 6 May 2026]. https://d1io3yog0oux5.cloudfront.net/_74212fc55c0ed015590504a486a8b208/bbsi/news/2026-05-06_BBSI_Reports_First_Quarter_2026_Financial_404.pdf
- Bureau of Labor Statistics (September 2026). Employer Costs for Employee Compensation, June 2026 [news release, September 9, 2026]. https://www.bls.gov/news.release/ecec.nr0.htm
- GOV.UK (November 2026). Implementing the Plan to Make Work Pay and Employment Rights Act [policy paper, last updated November 5, 2026]. https://www.gov.uk/government/publications/implementing-the-plan-to-make-work-pay-and-employment-rights-act
- Governo Federal do Brasil, eSocial (February 2026). Manual WEB MEI [user manual, 6 February 2026]. https://www.gov.br/esocial/pt-br/microempreendedor-individual/manual-web-mei
- Insperity (October 2026). Insperity Announces Third Quarter Results [results release, October 29, 2026]. https://www.sec.gov/Archives/edgar/data/0001000753/000100075326000101/a09302026-ex991earningsrel.htm
- Insperity (February 2026). Press Releases [Company website listing, 26 February 2026 entry]. https://www.insperity.com/all-news/press-releases/
- Internal Revenue Service (September 2026). About Certified Professional Employer Organization [program page, last reviewed September 10, 2026]. https://www.irs.gov/node/13750
- Internal Revenue Service (July 2026). Certified Professional Employer Organization [web page, last reviewed July 15, 2026]. https://www.irs.gov/tax-professionals/certified-professional-employer-organization
- Internal Revenue Service (July 2026). How do I apply for Professional Employer Organization certification? [web page, 14 July 2026]. https://www.irs.gov/tax-professionals/how-do-i-apply-for-professional-employer-organization-certification
- Korea.net (October 2025). Labor minister calls foreign workers ‘crucial to nat’l economy, society’ [government news article, 21 October 2025]. https://www.korea.net/NewsFocus/policies/view?articleId=280693
- Ministry of Economy Trade and Industry, Japan (April 2026). Cabinet Decision on the 2026 White Papers on Small and Medium Enterprises and Small Enterprises [press release, 24 April 2026]. https://www.meti.go.jp/english/press/2026/0424_003.html
- Paychex (June 2026). Paychex Reports Fourth Quarter and Full-Year 2026 Results [results release, June 24, 2026]. https://investor.paychex.com/news-events/press-releases/detail/838
- Paychex (March 2026). Paychex Reports Third Quarter Results [Press release, 25 March 2026]. https://investor.paychex.com/news-events/press-releases/detail/830
- SBA Office of Advocacy (February 2026). Frequently Asked Questions About Small Business 2026 [report, February 2026]. https://advocacy.sba.gov/wp-content/uploads/2026/02/FINAL_FAQsAboutSmallBusiness_2026_012826.pdf
- Statistics Canada (August 2026). Canadian business counts, June 2026 [The Daily release, 14 August 2026]. https://www150.statcan.gc.ca/n1/daily-quotidien/260814/dq260814d-eng.htm
- TriNet (October 2026). Third quarter 2026 results [results release, 29 October 2026]. https://stockhub.kr/en/newswire/prn/302923103
- TriNet (October 2026). TriNet Expands Embedded HR Solutions and AI Capabilities for Small and Medium-Size Businesses [Press release, 13 October 2026]. https://www.trinet.com/about-us/news-press/press-releases/trinet-expands-embedded-hr-solutions-and-ai-capabilities-for-small-and-medium-size-businesses
- Vensure (April 2026). Vensure Employer Solutions completes 108th Acquisition Following Latest Deal Closings, adding 80,000+ Worksite Employees [Press release, 24 April 2026]. https://vensure.com/resources/blog/vensure-employer-solutions-completes-108th-acquisition-following-latest-deal-closings-adding-80000-worksite-employees-2/
Table of Content
- Key Takeaways
- Market Size and CAGR
- Top Growth Driver
- Fastest Growing Segment
- Leading Region
- Key Companies
- Emerging Opportunities
- Executive Summary
- Global Market Outlook
- Demand-side Trends
- Supply-side Trends
- Technology Roadmap Analysis
- Analysis and Recommendations
- Analyst Perspective (What is happening? Why now? What should investors know?)
- Key Questions Answered
- How large is the market?
- What is the CAGR?
- What are key trends?
- Which region dominates?
- Who are the leaders?
Read More...
- Market Overview
- Market Coverage / Taxonomy
- Market Definition / Scope / Limitations
- Research Methodology
- Chapter Orientation
- Analytical Lens and Working Hypotheses
- Market Structure, Signals, and Trend Drivers
- Benchmarking and Cross-market Comparability
- Market Sizing, Forecasting, and Opportunity Mapping
- Research Design and Evidence Framework
- Desk Research Programme (Secondary Evidence)
- Expert Input and Fieldwork (Primary Evidence)
- Tooling, Models, and Reference Databases
- Data Engineering and Model Build
- Quality Assurance and Audit Trail
- Market Background
- Market Dynamics (Drivers, Restraints, Opportunity, Trends)
- Scenario Forecast (Optimistic, Likely, Conservative)
- Impact Analysis
- AI Impact
- Sustainability Impact
- Regulatory Impact
- Technology Impact
- Consumer / Buyer Analysis
- Purchase Drivers
- Adoption Barriers
- Buyer Journey
- Opportunity Map Analysis
- Product Life Cycle Analysis
- Supply Chain Analysis
- Investment Feasibility Matrix
- Value Chain Analysis
- PESTLE and Porter's Analysis
- Regulatory Landscape
- Regional Parent Market Outlook
- Production and Consumption Statistics
- Import and Export Statistics
- Global Market Analysis and Forecast, 2021 to 2036
- Historical Market Size Value (USD Billion) Analysis, 2021 to 2025
- Current and Future Market Size Value (USD Billion) Projections, 2026 to 2036
- Y-o-Y Growth Trend Analysis
- Absolute $ Opportunity Analysis
- Global Market Pricing Analysis, 2021 to 2036
- Global Market Analysis and Forecast, By Service, 2021 to 2036
- Introduction / Key Findings
- Historical Market Size Value (USD Billion) Analysis By Service, 2021 to 2025
- Current and Future Market Size Value (USD Billion) Analysis and Forecast By Service, 2026 to 2036
- Benefits and Insurance Programs
- Payroll and Tax Administration
- Risk Management and Workers' Compensation
- HR Compliance and Advisory
- Recruiting and Training
- Y-o-Y Growth Trend Analysis By Service, 2021 to 2025
- Absolute $ Opportunity Analysis By Service, 2026 to 2036
- Global Market Analysis and Forecast, By Client Size, 2021 to 2036
- Introduction / Key Findings
- Historical Market Size Value (USD Billion) Analysis By Client Size, 2021 to 2025
- Current and Future Market Size Value (USD Billion) Analysis and Forecast By Client Size, 2026 to 2036
- 10 to 49 Employees
- 100 Employees and Above
- 1 to 9 Employees
- 50 to 99 Employees
- Y-o-Y Growth Trend Analysis By Client Size, 2021 to 2025
- Absolute $ Opportunity Analysis By Client Size, 2026 to 2036
- Global Market Analysis and Forecast, By Client Industry, 2021 to 2036
- Introduction / Key Findings
- Historical Market Size Value (USD Billion) Analysis By Client Industry, 2021 to 2025
- Current and Future Market Size Value (USD Billion) Analysis and Forecast By Client Industry, 2026 to 2036
- Professional Services
- Technology
- Healthcare
- Construction
- Manufacturing
- Y-o-Y Growth Trend Analysis By Client Industry, 2021 to 2025
- Absolute $ Opportunity Analysis By Client Industry, 2026 to 2036
- Global Market Analysis and Forecast, By Provider Type, 2021 to 2036
- Introduction / Key Findings
- Historical Market Size Value (USD Billion) Analysis By Provider Type, 2021 to 2025
- Current and Future Market Size Value (USD Billion) Analysis and Forecast By Provider Type, 2026 to 2036
- Independent National PEOs
- Payroll-Provider PEOs
- Regional and Specialty PEOs
- Technology-Led PEOs
- Y-o-Y Growth Trend Analysis By Provider Type, 2021 to 2025
- Absolute $ Opportunity Analysis By Provider Type, 2026 to 2036
- Global Market Analysis and Forecast, By Region, 2021 to 2036
- Introduction
- Historical Market Size Value (USD Billion) Analysis By Region, 2021 to 2025
- Current Market Size Value (USD Billion) Analysis and Forecast By Region, 2026 to 2036
- North America
- Latin America
- Western Europe
- Eastern Europe
- East Asia
- South Asia and Pacific
- Middle East and Africa
- Market Attractiveness Analysis By Region
- North America Market Analysis and Forecast, By Country, 2021 to 2036
- Historical Market Size Value (USD Billion) Trend Analysis By Market Taxonomy, 2021 to 2025
- Market Size Value (USD Billion) Forecast By Market Taxonomy, 2026 to 2036
- By Country
- United States
- Canada
- By Service
- By Client Size
- By Client Industry
- By Provider Type
- By Country
- Market Attractiveness Analysis
- By Country
- By Service
- By Client Size
- By Client Industry
- By Provider Type
- Key Takeaways
- Latin America Market Analysis and Forecast, By Country, 2021 to 2036
- Historical Market Size Value (USD Billion) Trend Analysis By Market Taxonomy, 2021 to 2025
- Market Size Value (USD Billion) Forecast By Market Taxonomy, 2026 to 2036
- By Country
- Brazil
- Mexico
- Argentina
- Chile
- By Service
- By Client Size
- By Client Industry
- By Provider Type
- By Country
- Market Attractiveness Analysis
- By Country
- By Service
- By Client Size
- By Client Industry
- By Provider Type
- Key Takeaways
- Western Europe Market Analysis and Forecast, By Country, 2021 to 2036
- Historical Market Size Value (USD Billion) Trend Analysis By Market Taxonomy, 2021 to 2025
- Market Size Value (USD Billion) Forecast By Market Taxonomy, 2026 to 2036
- By Country
- Germany
- France
- United Kingdom
- Italy
- Spain
- Benelux
- Nordics
- By Service
- By Client Size
- By Client Industry
- By Provider Type
- By Country
- Market Attractiveness Analysis
- By Country
- By Service
- By Client Size
- By Client Industry
- By Provider Type
- Key Takeaways
- Eastern Europe Market Analysis and Forecast, By Country, 2021 to 2036
- Historical Market Size Value (USD Billion) Trend Analysis By Market Taxonomy, 2021 to 2025
- Market Size Value (USD Billion) Forecast By Market Taxonomy, 2026 to 2036
- By Country
- Poland
- Czech Republic
- Romania
- Hungary
- By Service
- By Client Size
- By Client Industry
- By Provider Type
- By Country
- Market Attractiveness Analysis
- By Country
- By Service
- By Client Size
- By Client Industry
- By Provider Type
- Key Takeaways
- East Asia Market Analysis and Forecast, By Country, 2021 to 2036
- Historical Market Size Value (USD Billion) Trend Analysis By Market Taxonomy, 2021 to 2025
- Market Size Value (USD Billion) Forecast By Market Taxonomy, 2026 to 2036
- By Country
- China
- Japan
- South Korea
- By Service
- By Client Size
- By Client Industry
- By Provider Type
- By Country
- Market Attractiveness Analysis
- By Country
- By Service
- By Client Size
- By Client Industry
- By Provider Type
- Key Takeaways
- South Asia and Pacific Market Analysis and Forecast, By Country, 2021 to 2036
- Historical Market Size Value (USD Billion) Trend Analysis By Market Taxonomy, 2021 to 2025
- Market Size Value (USD Billion) Forecast By Market Taxonomy, 2026 to 2036
- By Country
- India
- ASEAN
- Australia and New Zealand
- By Service
- By Client Size
- By Client Industry
- By Provider Type
- By Country
- Market Attractiveness Analysis
- By Country
- By Service
- By Client Size
- By Client Industry
- By Provider Type
- Key Takeaways
- Middle East and Africa Market Analysis and Forecast, By Country, 2021 to 2036
- Historical Market Size Value (USD Billion) Trend Analysis By Market Taxonomy, 2021 to 2025
- Market Size Value (USD Billion) Forecast By Market Taxonomy, 2026 to 2036
- By Country
- GCC Countries
- South Africa
- Türkiye
- Israel
- By Service
- By Client Size
- By Client Industry
- By Provider Type
- By Country
- Market Attractiveness Analysis
- By Country
- By Service
- By Client Size
- By Client Industry
- By Provider Type
- Key Takeaways
- Key Countries Market Analysis
- United States
- Pricing Analysis
- Market Share Analysis, 2025
- By Service
- By Client Size
- By Client Industry
- By Provider Type
- Canada
- Pricing Analysis
- Market Share Analysis, 2025
- By Service
- By Client Size
- By Client Industry
- By Provider Type
- Brazil
- Pricing Analysis
- Market Share Analysis, 2025
- By Service
- By Client Size
- By Client Industry
- By Provider Type
- Mexico
- Pricing Analysis
- Market Share Analysis, 2025
- By Service
- By Client Size
- By Client Industry
- By Provider Type
- Argentina
- Pricing Analysis
- Market Share Analysis, 2025
- By Service
- By Client Size
- By Client Industry
- By Provider Type
- Chile
- Pricing Analysis
- Market Share Analysis, 2025
- By Service
- By Client Size
- By Client Industry
- By Provider Type
- Germany
- Pricing Analysis
- Market Share Analysis, 2025
- By Service
- By Client Size
- By Client Industry
- By Provider Type
- France
- Pricing Analysis
- Market Share Analysis, 2025
- By Service
- By Client Size
- By Client Industry
- By Provider Type
- United Kingdom
- Pricing Analysis
- Market Share Analysis, 2025
- By Service
- By Client Size
- By Client Industry
- By Provider Type
- Italy
- Pricing Analysis
- Market Share Analysis, 2025
- By Service
- By Client Size
- By Client Industry
- By Provider Type
- Spain
- Pricing Analysis
- Market Share Analysis, 2025
- By Service
- By Client Size
- By Client Industry
- By Provider Type
- Benelux
- Pricing Analysis
- Market Share Analysis, 2025
- By Service
- By Client Size
- By Client Industry
- By Provider Type
- Nordics
- Pricing Analysis
- Market Share Analysis, 2025
- By Service
- By Client Size
- By Client Industry
- By Provider Type
- Poland
- Pricing Analysis
- Market Share Analysis, 2025
- By Service
- By Client Size
- By Client Industry
- By Provider Type
- Czech Republic
- Pricing Analysis
- Market Share Analysis, 2025
- By Service
- By Client Size
- By Client Industry
- By Provider Type
- Romania
- Pricing Analysis
- Market Share Analysis, 2025
- By Service
- By Client Size
- By Client Industry
- By Provider Type
- Hungary
- Pricing Analysis
- Market Share Analysis, 2025
- By Service
- By Client Size
- By Client Industry
- By Provider Type
- China
- Pricing Analysis
- Market Share Analysis, 2025
- By Service
- By Client Size
- By Client Industry
- By Provider Type
- Japan
- Pricing Analysis
- Market Share Analysis, 2025
- By Service
- By Client Size
- By Client Industry
- By Provider Type
- South Korea
- Pricing Analysis
- Market Share Analysis, 2025
- By Service
- By Client Size
- By Client Industry
- By Provider Type
- India
- Pricing Analysis
- Market Share Analysis, 2025
- By Service
- By Client Size
- By Client Industry
- By Provider Type
- ASEAN
- Pricing Analysis
- Market Share Analysis, 2025
- By Service
- By Client Size
- By Client Industry
- By Provider Type
- Australia and New Zealand
- Pricing Analysis
- Market Share Analysis, 2025
- By Service
- By Client Size
- By Client Industry
- By Provider Type
- GCC Countries
- Pricing Analysis
- Market Share Analysis, 2025
- By Service
- By Client Size
- By Client Industry
- By Provider Type
- South Africa
- Pricing Analysis
- Market Share Analysis, 2025
- By Service
- By Client Size
- By Client Industry
- By Provider Type
- Türkiye
- Pricing Analysis
- Market Share Analysis, 2025
- By Service
- By Client Size
- By Client Industry
- By Provider Type
- Israel
- Pricing Analysis
- Market Share Analysis, 2025
- By Service
- By Client Size
- By Client Industry
- By Provider Type
- United States
- Market Structure Analysis
- Competition Dashboard
- Competition Benchmarking
- Market Share Analysis of Top Players
- By Region
- By Service
- By Client Size
- By Client Industry
- By Provider Type
- Emerging Startups
- Innovation Benchmarking
- Competition Analysis
- Competition Deep Dive
- ADP
- Overview
- Product Portfolio
- Profitability by Market Segments
- Sales Footprint
- Strategy Overview
- Marketing Strategy
- Product Strategy
- Channel Strategy
- Insperity
- TriNet
- Paychex
- Vensure Employer Services
- Justworks
- Barrett Business Services
- Rippling
- ADP
- Case Studies
- Success Stories
- Recent Developments
- Competition Deep Dive
- Assumptions & Acronyms Used
List of Tables
- Table 1: Global Market Value (USD Billion) Forecast by Region, 2021 to 2036
- Table 2: Global Market Value (USD Billion) Forecast by Service, 2021 to 2036
- Table 3: Global Market Value (USD Billion) Forecast by Client Size, 2021 to 2036
- Table 4: Global Market Value (USD Billion) Forecast by Client Industry, 2021 to 2036
- Table 5: Global Market Value (USD Billion) Forecast by Provider Type, 2021 to 2036
- Table 6: North America Market Value (USD Billion) Forecast by Country, 2021 to 2036
- Table 7: North America Market Value (USD Billion) Forecast by Service, 2021 to 2036
- Table 8: North America Market Value (USD Billion) Forecast by Client Size, 2021 to 2036
- Table 9: North America Market Value (USD Billion) Forecast by Client Industry, 2021 to 2036
- Table 10: North America Market Value (USD Billion) Forecast by Provider Type, 2021 to 2036
- Table 11: Latin America Market Value (USD Billion) Forecast by Country, 2021 to 2036
- Table 12: Latin America Market Value (USD Billion) Forecast by Service, 2021 to 2036
- Table 13: Latin America Market Value (USD Billion) Forecast by Client Size, 2021 to 2036
- Table 14: Latin America Market Value (USD Billion) Forecast by Client Industry, 2021 to 2036
- Table 15: Latin America Market Value (USD Billion) Forecast by Provider Type, 2021 to 2036
- Table 16: Western Europe Market Value (USD Billion) Forecast by Country, 2021 to 2036
- Table 17: Western Europe Market Value (USD Billion) Forecast by Service, 2021 to 2036
- Table 18: Western Europe Market Value (USD Billion) Forecast by Client Size, 2021 to 2036
- Table 19: Western Europe Market Value (USD Billion) Forecast by Client Industry, 2021 to 2036
- Table 20: Western Europe Market Value (USD Billion) Forecast by Provider Type, 2021 to 2036
- Table 21: Eastern Europe Market Value (USD Billion) Forecast by Country, 2021 to 2036
- Table 22: Eastern Europe Market Value (USD Billion) Forecast by Service, 2021 to 2036
- Table 23: Eastern Europe Market Value (USD Billion) Forecast by Client Size, 2021 to 2036
- Table 24: Eastern Europe Market Value (USD Billion) Forecast by Client Industry, 2021 to 2036
- Table 25: Eastern Europe Market Value (USD Billion) Forecast by Provider Type, 2021 to 2036
- Table 26: East Asia Market Value (USD Billion) Forecast by Country, 2021 to 2036
- Table 27: East Asia Market Value (USD Billion) Forecast by Service, 2021 to 2036
- Table 28: East Asia Market Value (USD Billion) Forecast by Client Size, 2021 to 2036
- Table 29: East Asia Market Value (USD Billion) Forecast by Client Industry, 2021 to 2036
- Table 30: East Asia Market Value (USD Billion) Forecast by Provider Type, 2021 to 2036
- Table 31: South Asia and Pacific Market Value (USD Billion) Forecast by Country, 2021 to 2036
- Table 32: South Asia and Pacific Market Value (USD Billion) Forecast by Service, 2021 to 2036
- Table 33: South Asia and Pacific Market Value (USD Billion) Forecast by Client Size, 2021 to 2036
- Table 34: South Asia and Pacific Market Value (USD Billion) Forecast by Client Industry, 2021 to 2036
- Table 35: South Asia and Pacific Market Value (USD Billion) Forecast by Provider Type, 2021 to 2036
- Table 36: Middle East and Africa Market Value (USD Billion) Forecast by Country, 2021 to 2036
- Table 37: Middle East and Africa Market Value (USD Billion) Forecast by Service, 2021 to 2036
- Table 38: Middle East and Africa Market Value (USD Billion) Forecast by Client Size, 2021 to 2036
- Table 39: Middle East and Africa Market Value (USD Billion) Forecast by Client Industry, 2021 to 2036
- Table 40: Middle East and Africa Market Value (USD Billion) Forecast by Provider Type, 2021 to 2036
List of Figures
- Figure 1: Global Market Pricing Analysis
- Figure 2: Global Market Value (USD Billion) Forecast 2021-2036
- Figure 3: Global Market Value Share and BPS Analysis by Service, 2026 and 2036
- Figure 4: Global Market Y-o-Y Growth Comparison by Service, 2026-2036
- Figure 5: Global Market Attractiveness Analysis by Service
- Figure 6: Global Market Value Share and BPS Analysis by Client Size, 2026 and 2036
- Figure 7: Global Market Y-o-Y Growth Comparison by Client Size, 2026-2036
- Figure 8: Global Market Attractiveness Analysis by Client Size
- Figure 9: Global Market Value Share and BPS Analysis by Client Industry, 2026 and 2036
- Figure 10: Global Market Y-o-Y Growth Comparison by Client Industry, 2026-2036
- Figure 11: Global Market Attractiveness Analysis by Client Industry
- Figure 12: Global Market Value Share and BPS Analysis by Provider Type, 2026 and 2036
- Figure 13: Global Market Y-o-Y Growth Comparison by Provider Type, 2026-2036
- Figure 14: Global Market Attractiveness Analysis by Provider Type
- Figure 15: Global Market Value (USD Billion) Share and BPS Analysis by Region, 2026 and 2036
- Figure 16: Global Market Y-o-Y Growth Comparison by Region, 2026-2036
- Figure 17: Global Market Attractiveness Analysis by Region
- Figure 18: North America Market Incremental Dollar Opportunity, 2026-2036
- Figure 19: Latin America Market Incremental Dollar Opportunity, 2026-2036
- Figure 20: Western Europe Market Incremental Dollar Opportunity, 2026-2036
- Figure 21: Eastern Europe Market Incremental Dollar Opportunity, 2026-2036
- Figure 22: East Asia Market Incremental Dollar Opportunity, 2026-2036
- Figure 23: South Asia and Pacific Market Incremental Dollar Opportunity, 2026-2036
- Figure 24: Middle East and Africa Market Incremental Dollar Opportunity, 2026-2036
- Figure 25: North America Market Value Share and BPS Analysis by Country, 2026 and 2036
- Figure 26: North America Market Value Share and BPS Analysis by Service, 2026 and 2036
- Figure 27: North America Market Y-o-Y Growth Comparison by Service, 2026-2036
- Figure 28: North America Market Attractiveness Analysis by Service
- Figure 29: North America Market Value Share and BPS Analysis by Client Size, 2026 and 2036
- Figure 30: North America Market Y-o-Y Growth Comparison by Client Size, 2026-2036
- Figure 31: North America Market Attractiveness Analysis by Client Size
- Figure 32: North America Market Value Share and BPS Analysis by Client Industry, 2026 and 2036
- Figure 33: North America Market Y-o-Y Growth Comparison by Client Industry, 2026-2036
- Figure 34: North America Market Attractiveness Analysis by Client Industry
- Figure 35: North America Market Value Share and BPS Analysis by Provider Type, 2026 and 2036
- Figure 36: North America Market Y-o-Y Growth Comparison by Provider Type, 2026-2036
- Figure 37: North America Market Attractiveness Analysis by Provider Type
- Figure 38: Latin America Market Value Share and BPS Analysis by Country, 2026 and 2036
- Figure 39: Latin America Market Value Share and BPS Analysis by Service, 2026 and 2036
- Figure 40: Latin America Market Y-o-Y Growth Comparison by Service, 2026-2036
- Figure 41: Latin America Market Attractiveness Analysis by Service
- Figure 42: Latin America Market Value Share and BPS Analysis by Client Size, 2026 and 2036
- Figure 43: Latin America Market Y-o-Y Growth Comparison by Client Size, 2026-2036
- Figure 44: Latin America Market Attractiveness Analysis by Client Size
- Figure 45: Latin America Market Value Share and BPS Analysis by Client Industry, 2026 and 2036
- Figure 46: Latin America Market Y-o-Y Growth Comparison by Client Industry, 2026-2036
- Figure 47: Latin America Market Attractiveness Analysis by Client Industry
- Figure 48: Latin America Market Value Share and BPS Analysis by Provider Type, 2026 and 2036
- Figure 49: Latin America Market Y-o-Y Growth Comparison by Provider Type, 2026-2036
- Figure 50: Latin America Market Attractiveness Analysis by Provider Type
- Figure 51: Western Europe Market Value Share and BPS Analysis by Country, 2026 and 2036
- Figure 52: Western Europe Market Value Share and BPS Analysis by Service, 2026 and 2036
- Figure 53: Western Europe Market Y-o-Y Growth Comparison by Service, 2026-2036
- Figure 54: Western Europe Market Attractiveness Analysis by Service
- Figure 55: Western Europe Market Value Share and BPS Analysis by Client Size, 2026 and 2036
- Figure 56: Western Europe Market Y-o-Y Growth Comparison by Client Size, 2026-2036
- Figure 57: Western Europe Market Attractiveness Analysis by Client Size
- Figure 58: Western Europe Market Value Share and BPS Analysis by Client Industry, 2026 and 2036
- Figure 59: Western Europe Market Y-o-Y Growth Comparison by Client Industry, 2026-2036
- Figure 60: Western Europe Market Attractiveness Analysis by Client Industry
- Figure 61: Western Europe Market Value Share and BPS Analysis by Provider Type, 2026 and 2036
- Figure 62: Western Europe Market Y-o-Y Growth Comparison by Provider Type, 2026-2036
- Figure 63: Western Europe Market Attractiveness Analysis by Provider Type
- Figure 64: Eastern Europe Market Value Share and BPS Analysis by Country, 2026 and 2036
- Figure 65: Eastern Europe Market Value Share and BPS Analysis by Service, 2026 and 2036
- Figure 66: Eastern Europe Market Y-o-Y Growth Comparison by Service, 2026-2036
- Figure 67: Eastern Europe Market Attractiveness Analysis by Service
- Figure 68: Eastern Europe Market Value Share and BPS Analysis by Client Size, 2026 and 2036
- Figure 69: Eastern Europe Market Y-o-Y Growth Comparison by Client Size, 2026-2036
- Figure 70: Eastern Europe Market Attractiveness Analysis by Client Size
- Figure 71: Eastern Europe Market Value Share and BPS Analysis by Client Industry, 2026 and 2036
- Figure 72: Eastern Europe Market Y-o-Y Growth Comparison by Client Industry, 2026-2036
- Figure 73: Eastern Europe Market Attractiveness Analysis by Client Industry
- Figure 74: Eastern Europe Market Value Share and BPS Analysis by Provider Type, 2026 and 2036
- Figure 75: Eastern Europe Market Y-o-Y Growth Comparison by Provider Type, 2026-2036
- Figure 76: Eastern Europe Market Attractiveness Analysis by Provider Type
- Figure 77: East Asia Market Value Share and BPS Analysis by Country, 2026 and 2036
- Figure 78: East Asia Market Value Share and BPS Analysis by Service, 2026 and 2036
- Figure 79: East Asia Market Y-o-Y Growth Comparison by Service, 2026-2036
- Figure 80: East Asia Market Attractiveness Analysis by Service
- Figure 81: East Asia Market Value Share and BPS Analysis by Client Size, 2026 and 2036
- Figure 82: East Asia Market Y-o-Y Growth Comparison by Client Size, 2026-2036
- Figure 83: East Asia Market Attractiveness Analysis by Client Size
- Figure 84: East Asia Market Value Share and BPS Analysis by Client Industry, 2026 and 2036
- Figure 85: East Asia Market Y-o-Y Growth Comparison by Client Industry, 2026-2036
- Figure 86: East Asia Market Attractiveness Analysis by Client Industry
- Figure 87: East Asia Market Value Share and BPS Analysis by Provider Type, 2026 and 2036
- Figure 88: East Asia Market Y-o-Y Growth Comparison by Provider Type, 2026-2036
- Figure 89: East Asia Market Attractiveness Analysis by Provider Type
- Figure 90: South Asia and Pacific Market Value Share and BPS Analysis by Country, 2026 and 2036
- Figure 91: South Asia and Pacific Market Value Share and BPS Analysis by Service, 2026 and 2036
- Figure 92: South Asia and Pacific Market Y-o-Y Growth Comparison by Service, 2026-2036
- Figure 93: South Asia and Pacific Market Attractiveness Analysis by Service
- Figure 94: South Asia and Pacific Market Value Share and BPS Analysis by Client Size, 2026 and 2036
- Figure 95: South Asia and Pacific Market Y-o-Y Growth Comparison by Client Size, 2026-2036
- Figure 96: South Asia and Pacific Market Attractiveness Analysis by Client Size
- Figure 97: South Asia and Pacific Market Value Share and BPS Analysis by Client Industry, 2026 and 2036
- Figure 98: South Asia and Pacific Market Y-o-Y Growth Comparison by Client Industry, 2026-2036
- Figure 99: South Asia and Pacific Market Attractiveness Analysis by Client Industry
- Figure 100: South Asia and Pacific Market Value Share and BPS Analysis by Provider Type, 2026 and 2036
- Figure 101: South Asia and Pacific Market Y-o-Y Growth Comparison by Provider Type, 2026-2036
- Figure 102: South Asia and Pacific Market Attractiveness Analysis by Provider Type
- Figure 103: Middle East and Africa Market Value Share and BPS Analysis by Country, 2026 and 2036
- Figure 104: Middle East and Africa Market Value Share and BPS Analysis by Service, 2026 and 2036
- Figure 105: Middle East and Africa Market Y-o-Y Growth Comparison by Service, 2026-2036
- Figure 106: Middle East and Africa Market Attractiveness Analysis by Service
- Figure 107: Middle East and Africa Market Value Share and BPS Analysis by Client Size, 2026 and 2036
- Figure 108: Middle East and Africa Market Y-o-Y Growth Comparison by Client Size, 2026-2036
- Figure 109: Middle East and Africa Market Attractiveness Analysis by Client Size
- Figure 110: Middle East and Africa Market Value Share and BPS Analysis by Client Industry, 2026 and 2036
- Figure 111: Middle East and Africa Market Y-o-Y Growth Comparison by Client Industry, 2026-2036
- Figure 112: Middle East and Africa Market Attractiveness Analysis by Client Industry
- Figure 113: Middle East and Africa Market Value Share and BPS Analysis by Provider Type, 2026 and 2036
- Figure 114: Middle East and Africa Market Y-o-Y Growth Comparison by Provider Type, 2026-2036
- Figure 115: Middle East and Africa Market Attractiveness Analysis by Provider Type
- Figure 116: Global Market - Tier Structure Analysis
- Figure 117: Global Market - Company Share Analysis
Frequently Asked Questions
How big is the Professional Employer Organization Market in 2026?
Future Market Insights estimates the global professional employer organization market at USD 40.7 billion in 2026 and projects it to reach USD 76.3 billion by 2036.
How fast is the Professional Employer Organization Market expected to grow through 2036?
FMI projects the market to expand at a 6.5% CAGR from 2026 to 2036, reflecting the growing adoption of outsourced HR administration, payroll management, and employee benefits services.
Which service leads the Professional Employer Organization Market?
Benefits and insurance programs lead the service segment with a 52.0% share, supported by employer reliance on PEOs for employee benefits administration and insurance management.
Which client size accounts for the largest share of the Professional Employer Organization Market?
Businesses with 10 to 49 employees account for the largest client size segment with a 38.0% share, reflecting the importance of outsourced HR support for small and growing businesses.
Which countries are expected to record the fastest growth in the Professional Employer Organization Market?
The UK is projected to record the fastest growth at a 7.9% CAGR from 2026 to 2036, followed by Canada at 7.8% and Brazil at 7.7%.
Who are the leading players in the Professional Employer Organization Market?
Key players in the professional employer organization market include ADP, Insperity, TriNet, Paychex, Vensure Employer Services, Justworks, Barrett Business Services, and Rippling.
Preview the report firsthand - request a free sample
Get SampleGet the brochure for pricing and purchase details.
Get PDF
