Protective Packaging Market Size, Share, and Forecast Outlook 2025 to 2035

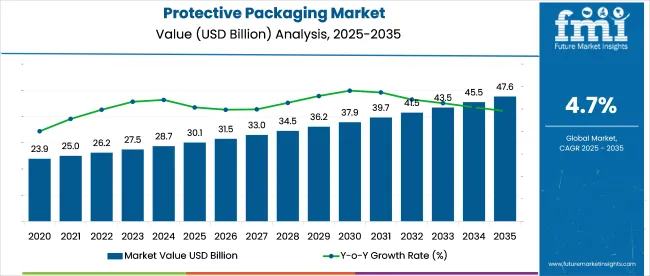
The protective packaging market expands from USD 30.1 billion in 2025 to USD 47.6 billion in 2035 at a CAGR of 4.7%. Early-phase expansion is moderate, reaching USD 31.5 billion in 2026 and USD 33 billion in 2027, driven by increased e-commerce logistics and protective needs in the electronics and food sectors.
Quick Stats of the Protective Packaging Market

  • Market Value (2025): USD 30.1 billion
  • Forecast Value (2035): USD 47.6 billion
  • Forecast CAGR: 4.7%
  • Product Leader in 2025: Foam protective packaging (42.3% share)
  • Top Distribution Channel: Logistics & Transportation (36% end-use demand)
  • Key Growth Region: India (6.0% CAGR, highest globally)
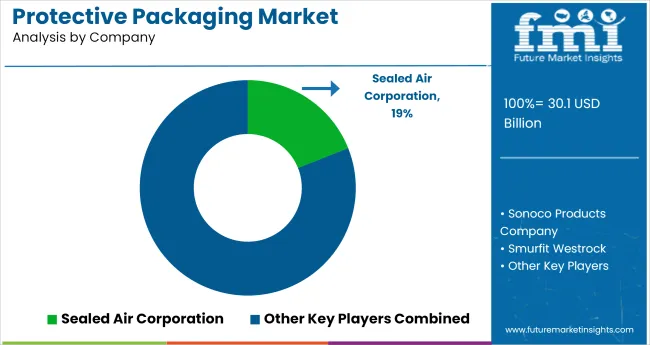
  • Leading Player: Sealed Air Corporation (19% industry share)

Protective Packaging Market Market Value Analysis

Key Industry Attributes

Metric Value
Industry Size (2025E) USD 30.1 Billion
Industry Value (2035F) USD 47.6 Billion
CAGR (2025 to 2035) 4.7%

Growth of 4.6% in 2026 reflects baseline demand stabilization across omnichannel retail, while 2027's 4.8% marks acceleration due to rising fulfillment volumes in Asia Pacific and North America.

From 2033 to 2035, the market pivoted toward green and automated solutions. It rises from USD 43.5 billion in 2033 to USD 45.5 billion in 2034 and ultimately reaches USD 47.6 billion in 2035. The 4.6%-4.9% YoY increases during this phase reflect a shift to ESG-aligned, recyclable protective materials and integration of sensor-based packaging for transit tracking.

As of 2025, the protective packaging market accounts for varying shares across its parent markets. It represents approximately 20-25% of the overall packaging industry, driven by rising demand for damage-free shipping. Within the industrial packaging market, it holds a 30-35% share, largely due to its use in machinery, electronics, and automotive goods.

In the e-commerce packaging market, protective packaging captures about 35-40%, reflecting its critical role in product safety during transit. It forms around 15-20% of the logistics and supply chain solutions market, and roughly 10-15% of the manufacturing and industrial goods market, where it supports operational efficiency and product integrity.

In a July 2024 earnings call covered by Packaging Dive, Dustin Semach, President and Chief Financial Officer at Sealed Air (now SEE), acknowledged persistent challenges in the protective packaging segment. He stated that “the weakness in our protective volumes is fully offsetting the strength in our food business,” citing excess capacity in the void fill market as a core issue.

Semach further noted that the company does not anticipate a near-term catalyst for volume recovery in this segment, projecting continued softness into 2025. This reflects ongoing headwinds in the sector, particularly amid slower industrial activity and an evolving mix of packaging demands.

Analyzing Protective Packaging Market by Top Investment Segments

In 2025, over 70% of protective packaging demand is concentrated across plastic materials, corrugated box formats, and logistics-related end use. Plastic leads due to its adaptable cost-performance profile. Boxes dominate the structural segment, while logistics and transportation drive downstream usage through expanding B2B and e-commerce distribution channels.
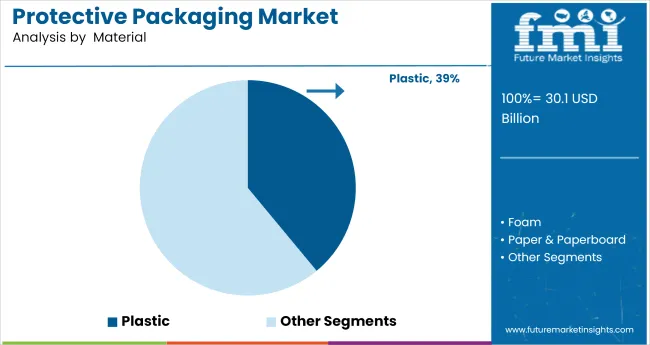
Plastic Leads Material Demand with a 39% Share in 2025

Protective Packaging Market Analysis By Material

Plastic is forecasted to hold USD 14.3 billion in global protective packaging revenue in 2025, commanding 39% of material-based demand. Companies such as Sealed Air, Pregis, and Amcor deploy high-resilience plastic solutions including air pillows, shrink films, and bubble wraps across cold chain logistics, electronics, and FMCG sectors. Thermoplastics dominate due to ease of thermoforming and compatibility with automated packaging lines.
  • 63% of cross-border pharmaceutical shipments use plastic cushioning or thermal wraps.
  • Flexible polyethylene (PE) formats hold 61% share of total plastic protective units.
  • Plastic formats are used in 87% of single-use protective layers in consumer electronics exports.

Boxes Dominate Packaging Format with 31% Market Share

Protective Packaging Market Analysis By Packaging Format

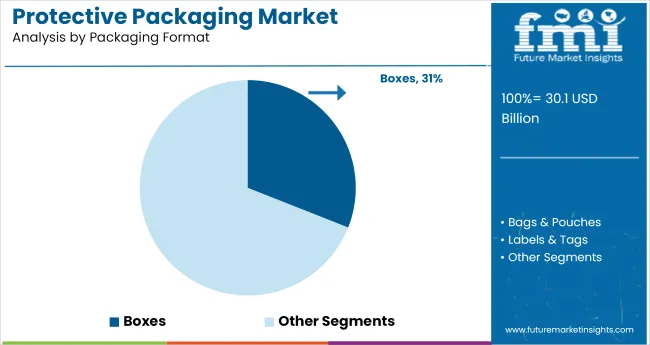
Boxes, mainly corrugated and die-cut, hold a 31% market share, equivalent to USD 11.4 billion in 2025. Corrugated units remain indispensable for durable, stackable, and scalable transport packaging. Global manufacturers including International Paper, WestRock, and DS Smith report steady growth in box shipments, especially to 3PL and direct-to-retail platforms. E-commerce accounts for 38% of all box shipments globally.
  • Corrugated board grades such as C-flute and E-flute cover over 72% of volume shipped.
  • Unit load optimization with double-wall boxes reduces breakage by up to 21% in B2B logistics.
  • Box-based packaging holds 44% share in consumer appliance shipments across Europe and North America.

Logistics & Transportation Drive 36% of End Use Demand

Protective Packaging Market Analysis By End Use

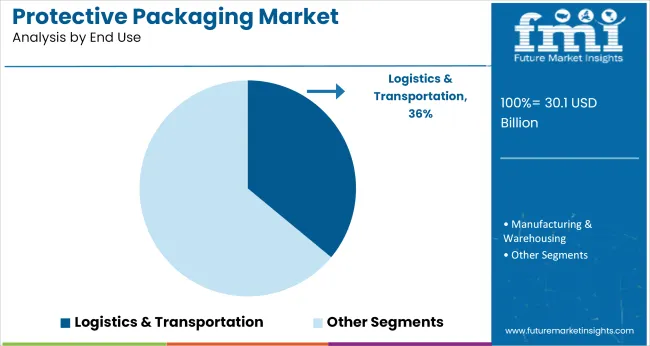
End-use from logistics and transportation represent USD 13.2 billion of global protective packaging value in 2025, comprising 36% of total market share. Major service providers like DHL, UPS, and FedEx are key demand aggregators, especially for secondary protective formats like foam inserts, stretch films, and padded mailers. Reverse logistics and cross-docking applications are central drivers of this growth.

  • Return shipments and exchanges account for 12-14% of parcel volume, increasing demand for re-sealable protective formats.
  • 3PL providers spend an average USD 0.86/unit on protective packaging in global last-mile shipping.
  • Protective material failure rates above 1.2% in freight-sensitive sectors trigger annual packaging redesigns in 47% of firms.

Top Protective Packaging Market Dynamics

Protective packaging demand is growing due to e-commerce expansion and stricter return loss targets. Suppliers are shifting to recyclable and fiber-based formats in response to regulatory changes. Compliance costs and damage mitigation metrics are now shaping procurement decisions, with recycled-content solutions accounting for nearly half of the EU market by mid-2025.

Volume Growth Linked to B2C Shipping and Return Loss Mitigation

Protective packaging consumption rose by 8.7% YoY globally in H1 2025, primarily fueled by e-commerce parcel growth and contract packaging volumes. USA-based 3PL operators processed over 1.4 billion protective-packed shipments in Q2 alone, with air cushion usage up 19% from the previous year.

Damage claim rates dropped by 13-18% across apparel and consumer electronics sectors after switching to form-fitting molded pulp and corrugated interior solutions. In Germany, 62% of electronics shipped direct-to-consumer now include corner crush protection inserts, reducing return-related write-offs by €44 million in the 12-month period ending June 2025. Omnichannel retailers are allocating 11-14% of outbound packaging budgets to impact-mitigation formats, up from 9% in 2023.

Compliance-Driven Material Substitution Alters Supply Contracts

Substrate choices are shifting in response to PPWR Phase II rollout and landfill fee hikes. Recycled-content protective formats made up 48% of all protective packaging sold in Western Europe as of Q2 2025, compared to 34% two years prior. EPS and non-recyclable foams declined by 27% in market share across regulated zones.

In France, starch-based protective wrap usage expanded by 22% YoY, supported by national plastic taxation rules introduced in January 2025. In Asia-Pacific, paper honeycomb liners gained 15% share within grocery cold-chain shipments, displacing multi-layer film-based insulation.

Audit data from five EU packaging compliance schemes showed that protective packaging SKUs with end-of-life certification had 1.6× faster uptake in private label procurement contracts. Material conversion cycles are also shortening, with 7 out of 10 large FMCG brands renegotiating packaging terms to phase out fossil-derived polymers in transit packaging before 2027.
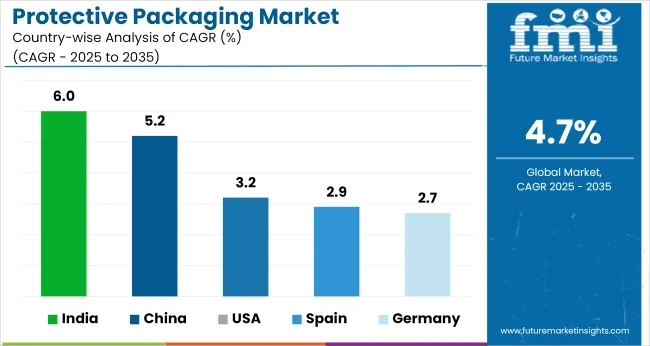
Top Countries Manufacturing, Adopting, And Distributing Protective Packaging Formats Across Consumer and Industrial Applications

Protective Packaging Market Cagr Analysis By Country

Country CAGR (2025 to 2035)
India 6.0%
China 5.2%
USA 3.2%
Spain 2.9%
Germany 2.7%

The global protective packaging market is projected to grow at a CAGR of 4.7% from 2025 to 2035. India (BRICS) leads among the profiled countries at 6.0%, exceeding the global average by 1.3% points. China (BRICS) follows at 5.2% (+0.5%), while the United States (OECD) trails at 3.2% (-1.5%), Spain (OECD) at 2.9% (-1.8%), and Germany (OECD) at 2.7% (-2.0%).

These differences reflect varying degrees of infrastructure scaling, e-commerce packaging integration, and domestic logistics performance. BRICS economies are seeing faster development, driven by regional industrial expansion and material availability. In contrast, several OECD countries exhibit slower growth tied to supply chain rationalization and limited capital deployment for packaging innovation.

The report covers detailed analysis of 40+ countries, with the top five countries shared as a reference
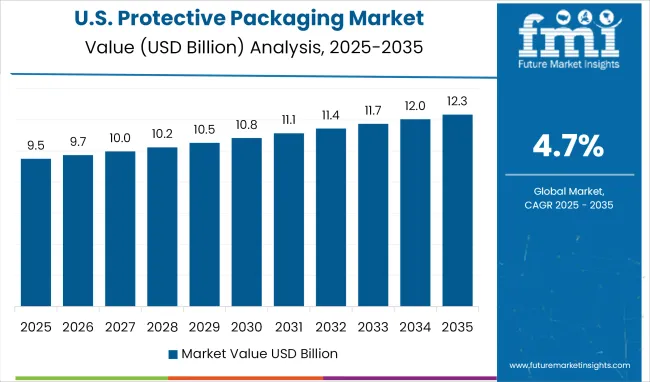
Market Assessment of Protective Packaging in the United States

Protective Packaging Market Country Value Analysis

From 2020 to 2024, demand in the United States was dominated by e-commerce expansion and third-party logistics growth. Protective mailers and bubble wrap products were widely used in electronics and consumer goods shipments. Between 2025 and 2035, the market is forecast to grow at a CAGR of 3.2%, driven by packaging automation in warehousing, demand for lightweight materials, and stricter landfill reduction targets.

Environmental pressures are pushing adoption of recyclable and paper-based formats, particularly in retail and medical fulfillment. Logistics firms are increasingly investing in integrated protective packaging lines for greater throughput and waste minimization.

  • E-commerce accounted for over 45% of protective packaging volume in 2023
  • Retailers are shifting from plastic cushions to kraft-based air pillows
  • Cold chain logistics adopt fiber-based thermal insulation wraps

Market Insights into Protective Packaging in Germany

The market grew moderately during 2020 to 2024, supported by industrial machinery, automotive parts exports, and electronic goods. Molded pulp and fiber-based edge protection were preferred by B2B exporters adhering to EU packaging waste directives. With a projected CAGR of 2.7% through 2035, growth will focus on durability and returnable packaging solutions.

Robotics and precision assembly sectors are pushing for anti-static and shock-absorbent inner packaging systems. Regulatory tightening under the Packaging Act (VerpackG) is accelerating material innovation, especially in reducing EPS and polymer-based foams. Tier 1 suppliers are investing in design optimization for reusable transport packaging.

  • Recyclable molded pulp adoption rose 13% between 2021 and 2024
  • Over 70% of B2B packaging in automotive uses hybrid protection systems
  • EPS usage declined 18% in industrial exports between 2020 and 2024

Demand Evolution of Protective Packaging in China

The protective packaging market in china is expected to post a CAGR of 5.2% through 2035. From 2020 to 2024, growth stemmed from electronics exports, high-frequency parcel shipping, and surge in mobile phone manufacturing. Air column bags, foam pouches, and corrugated inserts were widely used across coastal industrial zones.

Over the next decade, demand is shifting toward biodegradable and paper-pulp solutions, supported by national plastic reduction policies and rising automation in e-commerce logistics. The government’s green packaging mandates are influencing procurement by large OEMs and 3PL players. Tiered warehousing infrastructure is accelerating demand for scalable protective systems.

  • Electronics exports accounted for 39% of protective packaging use in 2023
  • Over 400 million biodegradable mailers deployed by Chinese e-retailers in 2024
  • Corrugated protective formats are replacing expanded PE foam in 3PL hubs

Protective Packaging Market Overview in Spain

The protective packaging industry in Spain grew modestly at the consumer level during 2020 to 2024, with growth driven by artisan goods, wines, olive oil, and ceramics exports. Traditional foam inserts and multilayer cartons dominated use. The market is projected to expand at a CAGR of 2.9% from 2025 to 2035, supported by eco-design mandates under EU waste policy and increasing SME digitalization.

Eco-packaging is becoming standard among direct-to-consumer brands. Paper honeycomb, molded cellulose inserts, and compostable film wraps are replacing legacy plastics. Growth in B2C exports is further driving demand for cushioning that meets cross-border green benchmarks.

  • Direct-to-consumer e-commerce rose 21% in 2020 to 2024, fueling packaging demand
  • Molded paper cushioning grew 17% CAGR in artisan exports
  • SMEs adopting modular paper wraps for subscription shipments

Growth Analysis of Protective Packaging in India

India is set to lead market expansion with a CAGR of 6.0% between 2025 and 2035. From 2020 to 2024, demand surged with growth in mobile manufacturing, pharma exports, and e-grocery deliveries. Foam wraps, laminated films, and paper-based fillers were widely used.

Moving forward, demand is expected from cold chain logistics, consumer electronics, and fulfillment centers in Tier 2 cities. Government incentives for electronics and medtech exports are pushing companies to adopt globally compliant protective formats. Paper-plastic hybrids, anti-static cushioning, and renewable-based films are gaining traction in high-speed packing environments.
  • Over 60% of electronics shipped from India now use tamper-evident protective packs
  • Food delivery sector drove 23% rise in paper-based void fill use (2020 to 2024)
  • Cold chain logistics investing in thermal insulation systems

Leading Protective Packaging Manufacturers, Suppliers, Distributors

Protective Packaging Market Analysis By Company

Leading manufacturers include prominent names such as Sealed Air Corporation, Smurfit Kappa, Sonoco Products Company, and Pregis LLC. These companies maintain competitive strength through consistent product development, capacity expansion, and strategic acquisitions.

For example, Sealed Air introduced a new range of protective mailers tailored for e-commerce packaging, enhancing its presence across retail supply chains. Smurfit Kappa continues to invest in advanced corrugated packaging solutions to improve durability and efficiency for logistics-intensive sectors.

Emerging players are gradually entering the market by targeting niche applications and low-cost alternatives, particularly in Asia-Pacific. The high capital requirements, established distributor networks, and regulatory compliance standards pose significant entry barriers for new entrants. R&D capabilities and long-term contracts with industrial clients further strengthen the position of incumbents.

Recent Industry News

  • In 2024, International Paper completed a USD 7.2 billion acquisition of DS Smith, marking one of the largest consolidation moves in the global protective packaging sector. This acquisition strengthened International Paper’s position in corrugated packaging by enhancing its production network and expanding its reach in retail-ready and industrial shipping solutions.
  • In 2025, Macfarlane Group executed a Euro 18 million acquisition of Pitreavie Group, its most significant purchase since 2001. This deal expanded Macfarlane’s capabilities in foam and corrugated packaging, especially across food & beverage and industrial supply chains in the UK and Ireland.

Leading Players

  • Sealed Air Corporation
  • Sonoco Products Company
  • Smurfit Westrock
  • DS Smith plc
  • Schur Flexibles Holding GesmbH
  • 3M Company
  • Intertape Polymer Group Inc
  • Storopack Hans Reichenecker GmbH
  • International Paper Company
  • Elsons International

Report Scope of Protective Packaging Market

Report Attributes Details
Market Size (2025) USD 30.1 billion
Projected Market Size (2035) USD 47.6 billion
CAGR (2025 to 2035) 4.7%
Base Year 2024
Historical Analysis 2020 to 2024
Forecast Period 2025 to 2035
Quantitative Units USD billion (revenue), million units (volume)
Material Segmentation Paper & Paperboard, Plastic, Foam, Others (Wood, Metal, Fabric)
Packaging Format Boxes, Bags & Pouches, Labels & Tags, Tapes, Wraps & Rolls, Envelopes & Mailers, Other Formats (Packaging Peanuts, End Caps, Edge Protectors)
End Use Manufacturing & Warehousing (Food, Beverages, Pharmaceuticals, Personal Care & Cosmetics, Homecare & Toiletries, Electrical & Electronics, Chemicals & Fertilizers), Logistics & Transportation
Regions Covered North America, Latin America, East Asia, South Asia and Pacific, Western Europe, Eastern Europe, Middle East and Africa
Countries Covered United States, Canada, Germany, France, United Kingdom, China, India, Japan, Brazil, GCC countries
Leading Playerd Sealed Air Corporation, Sonoco Products Company, Smurfit Westrock, DS Smith plc, Schur Flexibles Holding GesmbH, 3M Company, Intertape Polymer Group Inc, Storopack Hans Reichenecker GmbH, International Paper Company, Elsons International
Additional Attributes Dollar sales, share by material and end-use, packaging innovations in cold chain logistics and e-commerce, regional growth in warehousing activity, market consolidation trends

Key Segmentation

By Material:

  • Paper & Paperboard
  • Plastic
  • Foam
  • Others (Wood, Metal, Fabric)

By Packaging Format:

  • Boxes
  • Bags & Pouches
  • Labels & Tags
  • Tapes
  • Wraps & Rolls
  • Envelopes & Mailers
  • Other Formats (Packaging Peanuts, End Caps, Edge Protectors)

By End Use:

  • Manufacturing & Warehousing
    • Food
    • Beverages
    • Pharmaceuticals
    • Personal Care & Cosmetics
    • Homecare & Toiletries
    • Electrical & Electronics
    • Chemical & Fertilizers
    • Other Industrial
  • Logistics & Transportation

By Region:

  • North America
  • Latin America
  • East Asia
  • South Asia and Pacific
  • Western Europe
  • Eastern Europe
  • Middle East and Africa

Table of Content

  1. Executive Summary
    • Global Market Outlook
    • Demand-side Trends
    • Supply-side Trends
    • Technology Roadmap Analysis
    • Analysis and Recommendations
  2. Market Overview
    • Market Coverage / Taxonomy
    • Market Definition / Scope / Limitations
  3. Market Background
    • Market Dynamics
      • Drivers
      • Restraints
      • Opportunity
      • Trends
    • Scenario Forecast
      • Demand in Optimistic Scenario
      • Demand in Likely Scenario
      • Demand in Conservative Scenario
    • Opportunity Map Analysis
    • Product Life Cycle Analysis
    • Supply Chain Analysis
      • Supply Side Participants and their Roles
        • Producers
        • Mid-Level Participants (Traders/ Agents/ Brokers)
        • Wholesalers and Distributors
      • Value Added and Value Created at Node in the Supply Chain
      • List of Raw Material Suppliers
      • List of Existing and Potential Buyer’s
    • Investment Feasibility Matrix
    • Value Chain Analysis
      • Profit Margin Analysis
      • Wholesalers and Distributors
      • Retailers
    • PESTLE and Porter’s Analysis
    • Regulatory Landscape
      • By Key Regions
      • By Key Countries
    • Regional Parent Market Outlook
    • Production and Consumption Statistics
    • Import and Export Statistics
  4. Global Market Analysis 2020 to 2024 and Forecast, 2025 to 2035
    • Historical Market Size Value (USD Billion) & Volume (MT) Analysis, 2020 to 2024
    • Current and Future Market Size Value (USD Billion) & Volume (MT) Projections, 2025 to 2035
      • Y-o-Y Growth Trend Analysis
      • Absolute $ Opportunity Analysis
  5. Global Market Pricing Analysis 2020 to 2024 and Forecast 2025 to 2035
  6. Global Market Analysis 2020 to 2024 and Forecast 2025 to 2035, By Material
    • Introduction / Key Findings
    • Historical Market Size Value (USD Billion) & Volume (MT) Analysis By Material, 2020 to 2024
    • Current and Future Market Size Value (USD Billion) & Volume (MT) Analysis and Forecast By Material, 2025 to 2035
      • Paper & Paperboard
      • Plastic
      • Foam
      • Others (Wood, Metal, Fabric)
    • Y-o-Y Growth Trend Analysis By Material, 2020 to 2024
    • Absolute $ Opportunity Analysis By Material, 2025 to 2035
  7. Global Market Analysis 2020 to 2024 and Forecast 2025 to 2035, By Packaging Format
    • Introduction / Key Findings
    • Historical Market Size Value (USD Billion) & Volume (MT) Analysis By Packaging Format, 2020 to 2024
    • Current and Future Market Size Value (USD Billion) & Volume (MT) Analysis and Forecast By Packaging Format, 2025 to 2035
      • Boxes
      • Bags & Pouches
      • Labels & Tags
      • Tapes
      • Wraps & Rolls
      • Envelopes & Mailers
      • Other Formats (Packaging Peanuts, End Caps, Edge Protectors)
    • Y-o-Y Growth Trend Analysis By Packaging Format, 2020 to 2024
    • Absolute $ Opportunity Analysis By Packaging Format, 2025 to 2035
  8. Global Market Analysis 2020 to 2024 and Forecast 2025 to 2035, By End Use
    • Introduction / Key Findings
    • Historical Market Size Value (USD Billion) & Volume (MT) Analysis By End Use, 2020 to 2024
    • Current and Future Market Size Value (USD Billion) & Volume (MT) Analysis and Forecast By End Use, 2025 to 2035
      • Manufacturing & Warehousing
        • Food
        • Beverages
        • Pharmaceuticals
        • Personal Care & Cosmetics
        • Homecare & Toiletries
        • Electrical & Electronics
        • Chemical & Fertilizers
        • Other Industrial
      • Logistics & Transportation
    • Y-o-Y Growth Trend Analysis By End Use, 2020 to 2024
    • Absolute $ Opportunity Analysis By End Use, 2025 to 2035
  9. Global Market Analysis 2020 to 2024 and Forecast 2025 to 2035, By Region
    • Introduction
    • Historical Market Size Value (USD Billion) & Volume (MT) Analysis By Region, 2020 to 2024
    • Current Market Size Value (USD Billion) & Volume (MT) Analysis and Forecast By Region, 2025 to 2035
      • North America
      • Latin America
      • Western Europe
      • Eastern Europe
      • East Asia
      • South Asia & Pacific
      • Middle East and Africa
    • Market Attractiveness Analysis By Region
  10. North America Market Analysis 2020 to 2024 and Forecast 2025 to 2035, By Country
    • Historical Market Size Value (USD Billion) & Volume (MT) Trend Analysis By Market Taxonomy, 2020 to 2024
    • Market Size Value (USD Billion) & Volume (MT) Forecast By Market Taxonomy, 2025 to 2035
      • By Country
        • USA
        • Canada
        • Mexico
      • By Material
      • By Packaging Format
      • By End Use
    • Market Attractiveness Analysis
      • By Country
      • By Material
      • By Packaging Format
      • By End Use
    • Key Takeaways
  11. Latin America Market Analysis 2020 to 2024 and Forecast 2025 to 2035, By Country
    • Historical Market Size Value (USD Billion) & Volume (MT) Trend Analysis By Market Taxonomy, 2020 to 2024
    • Market Size Value (USD Billion) & Volume (MT) Forecast By Market Taxonomy, 2025 to 2035
      • By Country
        • Brazil
        • Argentina
        • Rest of LATAM
      • By Material
      • By Packaging Format
      • By End Use
    • Market Attractiveness Analysis
      • By Country
      • By Material
      • By Packaging Format
      • By End Use
    • Key Takeaways
  12. Western Europe Market Analysis 2020 to 2024 and Forecast 2025 to 2035, By Country
    • Historical Market Size Value (USD Billion) & Volume (MT) Trend Analysis By Market Taxonomy, 2020 to 2024
    • Market Size Value (USD Billion) & Volume (MT) Forecast By Market Taxonomy, 2025 to 2035
      • By Country
        • Germany
        • Italy
        • France
        • UK
        • Spain
        • BENELUX
        • Nordic
        • Rest of W.Europe
      • By Material
      • By Packaging Format
      • By End Use
    • Market Attractiveness Analysis
      • By Country
      • By Material
      • By Packaging Format
      • By End Use
    • Key Takeaways
  13. Eastern Europe Market Analysis 2020 to 2024 and Forecast 2025 to 2035, By Country
    • Historical Market Size Value (USD Billion) & Volume (MT) Trend Analysis By Market Taxonomy, 2020 to 2024
    • Market Size Value (USD Billion) & Volume (MT) Forecast By Market Taxonomy, 2025 to 2035
      • By Country
        • Russia
        • Hungary
        • Poland
        • Balkan & Baltics
        • Rest of E. Europe
      • By Material
      • By Packaging Format
      • By End Use
    • Market Attractiveness Analysis
      • By Country
      • By Material
      • By Packaging Format
      • By End Use
    • Key Takeaways
  14. East Asia Market Analysis 2020 to 2024 and Forecast 2025 to 2035, By Country
    • Historical Market Size Value (USD Billion) & Volume (MT) Trend Analysis By Market Taxonomy, 2020 to 2024
    • Market Size Value (USD Billion) & Volume (MT) Forecast By Market Taxonomy, 2025 to 2035
      • By Country
        • China
        • Japan
        • South Korea
      • By Material
      • By Packaging Format
      • By End Use
    • Market Attractiveness Analysis
      • By Country
      • By Material
      • By Packaging Format
      • By End Use
    • Key Takeaways
  15. South Asia & Pacific Market Analysis 2020 to 2024 and Forecast 2025 to 2035, By Country
    • Historical Market Size Value (USD Billion) & Volume (MT) Trend Analysis By Market Taxonomy, 2020 to 2024
    • Market Size Value (USD Billion) & Volume (MT) Forecast By Market Taxonomy, 2025 to 2035
      • By Country
        • India
        • Australia & New Zealand
        • ASEAN
        • Rest of SAP
      • By Material
      • By Packaging Format
      • By End Use
    • Market Attractiveness Analysis
      • By Country
      • By Material
      • By Packaging Format
      • By End Use
    • Key Takeaways
  16. Middle East and Africa Market Analysis 2020 to 2024 and Forecast 2025 to 2035, By Country
    • Historical Market Size Value (USD Billion) & Volume (MT) Trend Analysis By Market Taxonomy, 2020 to 2024
    • Market Size Value (USD Billion) & Volume (MT) Forecast By Market Taxonomy, 2025 to 2035
      • By Country
        • GCC Countries
        • Northern Africa
        • South Africa
        • Turkiye
        • Rest of MEA
      • By Material
      • By Packaging Format
      • By End Use
    • Market Attractiveness Analysis
      • By Country
      • By Material
      • By Packaging Format
      • By End Use
    • Key Takeaways
  17. Key Countries Market Analysis
    • USA
      • Pricing Analysis
      • Market Share Analysis, 2024
        • By Material
        • By Packaging Format
        • By End Use
    • Canada
      • Pricing Analysis
      • Market Share Analysis, 2024
        • By Material
        • By Packaging Format
        • By End Use
    • Brazil
      • Pricing Analysis
      • Market Share Analysis, 2024
        • By Material
        • By Packaging Format
        • By End Use
    • Mexico
      • Pricing Analysis
      • Market Share Analysis, 2024
        • By Material
        • By Packaging Format
        • By End Use
    • Argentina
      • Pricing Analysis
      • Market Share Analysis, 2024
        • By Material
        • By Packaging Format
        • By End Use
  18. Market Structure Analysis
    • Competition Dashboard
    • Competition Benchmarking
    • Market Share Analysis of Top Players
      • By Regional
      • By Material
      • By Packaging Format
      • By End Use
  19. Competition Analysis
    • Competition Deep Dive
      • Sealed Air Corporation
        • Overview
        • Product Portfolio
        • Profitability by Market Segments (Product/Age /Sales Channel/Region)
        • Sales Footprint
        • Strategy Overview
          • Marketing Strategy
          • Product Strategy
          • Channel Strategy
      • Sonoco Products Company
        • Overview
        • Product Portfolio
        • Profitability by Market Segments (Product/Age /Sales Channel/Region)
        • Sales Footprint
        • Strategy Overview
          • Marketing Strategy
          • Product Strategy
          • Channel Strategy
      • Smurfit Westrock
        • Overview
        • Product Portfolio
        • Profitability by Market Segments (Product/Age /Sales Channel/Region)
        • Sales Footprint
        • Strategy Overview
          • Marketing Strategy
          • Product Strategy
          • Channel Strategy
      • DS Smith plc
        • Overview
        • Product Portfolio
        • Profitability by Market Segments (Product/Age /Sales Channel/Region)
        • Sales Footprint
        • Strategy Overview
          • Marketing Strategy
          • Product Strategy
          • Channel Strategy
      • Schur Flexibles Holding GesmbH
        • Overview
        • Product Portfolio
        • Profitability by Market Segments (Product/Age /Sales Channel/Region)
        • Sales Footprint
        • Strategy Overview
          • Marketing Strategy
          • Product Strategy
          • Channel Strategy
      • 3M Company
        • Overview
        • Product Portfolio
        • Profitability by Market Segments (Product/Age /Sales Channel/Region)
        • Sales Footprint
        • Strategy Overview
          • Marketing Strategy
          • Product Strategy
          • Channel Strategy
      • Intertape Polymer Group Inc
        • Overview
        • Product Portfolio
        • Profitability by Market Segments (Product/Age /Sales Channel/Region)
        • Sales Footprint
        • Strategy Overview
          • Marketing Strategy
          • Product Strategy
          • Channel Strategy
      • Storopack Hans Reichenecker GmbH
        • Overview
        • Product Portfolio
        • Profitability by Market Segments (Product/Age /Sales Channel/Region)
        • Sales Footprint
        • Strategy Overview
          • Marketing Strategy
          • Product Strategy
          • Channel Strategy
      • International Paper Company
        • Overview
        • Product Portfolio
        • Profitability by Market Segments (Product/Age /Sales Channel/Region)
        • Sales Footprint
        • Strategy Overview
          • Marketing Strategy
          • Product Strategy
          • Channel Strategy
      • Elsons International
        • Overview
        • Product Portfolio
        • Profitability by Market Segments (Product/Age /Sales Channel/Region)
        • Sales Footprint
        • Strategy Overview
          • Marketing Strategy
          • Product Strategy
          • Channel Strategy
  20. Assumptions & Acronyms Used
  21. Research Methodology

List of Tables

  • Table 1: Global Market Value (USD Billion) Forecast by Region, 2020-2035
  • Table 2: Global Market Volume (MT) Forecast by Region, 2020-2035
  • Table 3: Global Market Value (USD Billion) Forecast by Material, 2020-2035
  • Table 4: Global Market Volume (MT) Forecast by Material, 2020-2035
  • Table 5: Global Market Value (USD Billion) Forecast by Packaging Format, 2020-2035
  • Table 6: Global Market Volume (MT) Forecast by Packaging Format, 2020-2035
  • Table 7: Global Market Value (USD Billion) Forecast by End Use, 2020-2035
  • Table 8: Global Market Volume (MT) Forecast by End Use, 2020-2035
  • Table 9: North America Market Value (USD Billion) Forecast by Country, 2020-2035
  • Table 10: North America Market Volume (MT) Forecast by Country, 2020-2035
  • Table 11: North America Market Value (USD Billion) Forecast by Material, 2020-2035
  • Table 12: North America Market Volume (MT) Forecast by Material, 2020-2035
  • Table 13: North America Market Value (USD Billion) Forecast by Packaging Format, 2020-2035
  • Table 14: North America Market Volume (MT) Forecast by Packaging Format, 2020-2035
  • Table 15: North America Market Value (USD Billion) Forecast by End Use, 2020-2035
  • Table 16: North America Market Volume (MT) Forecast by End Use, 2020-2035
  • Table 17: Latin America Market Value (USD Billion) Forecast by Country, 2020-2035
  • Table 18: Latin America Market Volume (MT) Forecast by Country, 2020-2035
  • Table 19: Latin America Market Value (USD Billion) Forecast by Material, 2020-2035
  • Table 20: Latin America Market Volume (MT) Forecast by Material, 2020-2035
  • Table 21: Latin America Market Value (USD Billion) Forecast by Packaging Format, 2020-2035
  • Table 22: Latin America Market Volume (MT) Forecast by Packaging Format, 2020-2035
  • Table 23: Latin America Market Value (USD Billion) Forecast by End Use, 2020-2035
  • Table 24: Latin America Market Volume (MT) Forecast by End Use, 2020-2035
  • Table 25: Western Europe Market Value (USD Billion) Forecast by Country, 2020-2035
  • Table 26: Western Europe Market Volume (MT) Forecast by Country, 2020-2035
  • Table 27: Western Europe Market Value (USD Billion) Forecast by Material, 2020-2035
  • Table 28: Western Europe Market Volume (MT) Forecast by Material, 2020-2035
  • Table 29: Western Europe Market Value (USD Billion) Forecast by Packaging Format, 2020-2035
  • Table 30: Western Europe Market Volume (MT) Forecast by Packaging Format, 2020-2035
  • Table 31: Western Europe Market Value (USD Billion) Forecast by End Use, 2020-2035
  • Table 32: Western Europe Market Volume (MT) Forecast by End Use, 2020-2035
  • Table 33: Eastern Europe Market Value (USD Billion) Forecast by Country, 2020-2035
  • Table 34: Eastern Europe Market Volume (MT) Forecast by Country, 2020-2035
  • Table 35: Eastern Europe Market Value (USD Billion) Forecast by Material, 2020-2035
  • Table 36: Eastern Europe Market Volume (MT) Forecast by Material, 2020-2035
  • Table 37: Eastern Europe Market Value (USD Billion) Forecast by Packaging Format, 2020-2035
  • Table 38: Eastern Europe Market Volume (MT) Forecast by Packaging Format, 2020-2035
  • Table 39: Eastern Europe Market Value (USD Billion) Forecast by End Use, 2020-2035
  • Table 40: Eastern Europe Market Volume (MT) Forecast by End Use, 2020-2035
  • Table 41: East Asia Market Value (USD Billion) Forecast by Country, 2020-2035
  • Table 42: East Asia Market Volume (MT) Forecast by Country, 2020-2035
  • Table 43: East Asia Market Value (USD Billion) Forecast by Material, 2020-2035
  • Table 44: East Asia Market Volume (MT) Forecast by Material, 2020-2035
  • Table 45: East Asia Market Value (USD Billion) Forecast by Packaging Format, 2020-2035
  • Table 46: East Asia Market Volume (MT) Forecast by Packaging Format, 2020-2035
  • Table 47: East Asia Market Value (USD Billion) Forecast by End Use, 2020-2035
  • Table 48: East Asia Market Volume (MT) Forecast by End Use, 2020-2035
  • Table 49: South Asia & Pacific Market Value (USD Billion) Forecast by Country, 2020-2035
  • Table 50: South Asia & Pacific Market Volume (MT) Forecast by Country, 2020-2035
  • Table 51: South Asia & Pacific Market Value (USD Billion) Forecast by Material, 2020-2035
  • Table 52: South Asia & Pacific Market Volume (MT) Forecast by Material, 2020-2035
  • Table 53: South Asia & Pacific Market Value (USD Billion) Forecast by Packaging Format, 2020-2035
  • Table 54: South Asia & Pacific Market Volume (MT) Forecast by Packaging Format, 2020-2035
  • Table 55: South Asia & Pacific Market Value (USD Billion) Forecast by End Use, 2020-2035
  • Table 56: South Asia & Pacific Market Volume (MT) Forecast by End Use, 2020-2035
  • Table 57: Middle East and Africa Market Value (USD Billion) Forecast by Country, 2020-2035
  • Table 58: Middle East and Africa Market Volume (MT) Forecast by Country, 2020-2035
  • Table 59: Middle East and Africa Market Value (USD Billion) Forecast by Material, 2020-2035
  • Table 60: Middle East and Africa Market Volume (MT) Forecast by Material, 2020-2035
  • Table 61: Middle East and Africa Market Value (USD Billion) Forecast by Packaging Format, 2020-2035
  • Table 62: Middle East and Africa Market Volume (MT) Forecast by Packaging Format, 2020-2035
  • Table 63: Middle East and Africa Market Value (USD Billion) Forecast by End Use, 2020-2035
  • Table 64: Middle East and Africa Market Volume (MT) Forecast by End Use, 2020-2035

List of Figures

  • Figure 1: Global Market Volume (MT) Forecast 2020-2035
  • Figure 2: Global Market Pricing Analysis
  • Figure 3: Global Market Value (USD Billion) Forecast 2020-2035
  • Figure 4: Global Market Value Share and BPS Analysis by Material, 2025 and 2035
  • Figure 5: Global Market Y-o-Y Growth Comparison by Material, 2025-2035
  • Figure 6: Global Market Attractiveness Analysis by Material
  • Figure 7: Global Market Value Share and BPS Analysis by Packaging Format, 2025 and 2035
  • Figure 8: Global Market Y-o-Y Growth Comparison by Packaging Format, 2025-2035
  • Figure 9: Global Market Attractiveness Analysis by Packaging Format
  • Figure 10: Global Market Value Share and BPS Analysis by End Use, 2025 and 2035
  • Figure 11: Global Market Y-o-Y Growth Comparison by End Use, 2025-2035
  • Figure 12: Global Market Attractiveness Analysis by End Use
  • Figure 13: Global Market Value (USD Billion) Share and BPS Analysis by Region, 2025 and 2035
  • Figure 14: Global Market Y-o-Y Growth Comparison by Region, 2025-2035
  • Figure 15: Global Market Attractiveness Analysis by Region
  • Figure 16: North America Market Incremental $ Opportunity, 2025-2035
  • Figure 17: Latin America Market Incremental $ Opportunity, 2025-2035
  • Figure 18: Western Europe Market Incremental $ Opportunity, 2025-2035
  • Figure 19: Eastern Europe Market Incremental $ Opportunity, 2025-2035
  • Figure 20: East Asia Market Incremental $ Opportunity, 2025-2035
  • Figure 21: South Asia & Pacific Market Incremental $ Opportunity, 2025-2035
  • Figure 22: Middle East and Africa Market Incremental $ Opportunity, 2025-2035
  • Figure 23: North America Market Value Share and BPS Analysis by Country, 2025 and 2035
  • Figure 24: North America Market Value Share and BPS Analysis by Material, 2025 and 2035
  • Figure 25: North America Market Y-o-Y Growth Comparison by Material, 2025-2035
  • Figure 26: North America Market Attractiveness Analysis by Material
  • Figure 27: North America Market Value Share and BPS Analysis by Packaging Format, 2025 and 2035
  • Figure 28: North America Market Y-o-Y Growth Comparison by Packaging Format, 2025-2035
  • Figure 29: North America Market Attractiveness Analysis by Packaging Format
  • Figure 30: North America Market Value Share and BPS Analysis by End Use, 2025 and 2035
  • Figure 31: North America Market Y-o-Y Growth Comparison by End Use, 2025-2035
  • Figure 32: North America Market Attractiveness Analysis by End Use
  • Figure 33: Latin America Market Value Share and BPS Analysis by Country, 2025 and 2035
  • Figure 34: Latin America Market Value Share and BPS Analysis by Material, 2025 and 2035
  • Figure 35: Latin America Market Y-o-Y Growth Comparison by Material, 2025-2035
  • Figure 36: Latin America Market Attractiveness Analysis by Material
  • Figure 37: Latin America Market Value Share and BPS Analysis by Packaging Format, 2025 and 2035
  • Figure 38: Latin America Market Y-o-Y Growth Comparison by Packaging Format, 2025-2035
  • Figure 39: Latin America Market Attractiveness Analysis by Packaging Format
  • Figure 40: Latin America Market Value Share and BPS Analysis by End Use, 2025 and 2035
  • Figure 41: Latin America Market Y-o-Y Growth Comparison by End Use, 2025-2035
  • Figure 42: Latin America Market Attractiveness Analysis by End Use
  • Figure 43: Western Europe Market Value Share and BPS Analysis by Country, 2025 and 2035
  • Figure 44: Western Europe Market Value Share and BPS Analysis by Material, 2025 and 2035
  • Figure 45: Western Europe Market Y-o-Y Growth Comparison by Material, 2025-2035
  • Figure 46: Western Europe Market Attractiveness Analysis by Material
  • Figure 47: Western Europe Market Value Share and BPS Analysis by Packaging Format, 2025 and 2035
  • Figure 48: Western Europe Market Y-o-Y Growth Comparison by Packaging Format, 2025-2035
  • Figure 49: Western Europe Market Attractiveness Analysis by Packaging Format
  • Figure 50: Western Europe Market Value Share and BPS Analysis by End Use, 2025 and 2035
  • Figure 51: Western Europe Market Y-o-Y Growth Comparison by End Use, 2025-2035
  • Figure 52: Western Europe Market Attractiveness Analysis by End Use
  • Figure 53: Eastern Europe Market Value Share and BPS Analysis by Country, 2025 and 2035
  • Figure 54: Eastern Europe Market Value Share and BPS Analysis by Material, 2025 and 2035
  • Figure 55: Eastern Europe Market Y-o-Y Growth Comparison by Material, 2025-2035
  • Figure 56: Eastern Europe Market Attractiveness Analysis by Material
  • Figure 57: Eastern Europe Market Value Share and BPS Analysis by Packaging Format, 2025 and 2035
  • Figure 58: Eastern Europe Market Y-o-Y Growth Comparison by Packaging Format, 2025-2035
  • Figure 59: Eastern Europe Market Attractiveness Analysis by Packaging Format
  • Figure 60: Eastern Europe Market Value Share and BPS Analysis by End Use, 2025 and 2035
  • Figure 61: Eastern Europe Market Y-o-Y Growth Comparison by End Use, 2025-2035
  • Figure 62: Eastern Europe Market Attractiveness Analysis by End Use
  • Figure 63: East Asia Market Value Share and BPS Analysis by Country, 2025 and 2035
  • Figure 64: East Asia Market Value Share and BPS Analysis by Material, 2025 and 2035
  • Figure 65: East Asia Market Y-o-Y Growth Comparison by Material, 2025-2035
  • Figure 66: East Asia Market Attractiveness Analysis by Material
  • Figure 67: East Asia Market Value Share and BPS Analysis by Packaging Format, 2025 and 2035
  • Figure 68: East Asia Market Y-o-Y Growth Comparison by Packaging Format, 2025-2035
  • Figure 69: East Asia Market Attractiveness Analysis by Packaging Format
  • Figure 70: East Asia Market Value Share and BPS Analysis by End Use, 2025 and 2035
  • Figure 71: East Asia Market Y-o-Y Growth Comparison by End Use, 2025-2035
  • Figure 72: East Asia Market Attractiveness Analysis by End Use
  • Figure 73: South Asia & Pacific Market Value Share and BPS Analysis by Country, 2025 and 2035
  • Figure 74: South Asia & Pacific Market Value Share and BPS Analysis by Material, 2025 and 2035
  • Figure 75: South Asia & Pacific Market Y-o-Y Growth Comparison by Material, 2025-2035
  • Figure 76: South Asia & Pacific Market Attractiveness Analysis by Material
  • Figure 77: South Asia & Pacific Market Value Share and BPS Analysis by Packaging Format, 2025 and 2035
  • Figure 78: South Asia & Pacific Market Y-o-Y Growth Comparison by Packaging Format, 2025-2035
  • Figure 79: South Asia & Pacific Market Attractiveness Analysis by Packaging Format
  • Figure 80: South Asia & Pacific Market Value Share and BPS Analysis by End Use, 2025 and 2035
  • Figure 81: South Asia & Pacific Market Y-o-Y Growth Comparison by End Use, 2025-2035
  • Figure 82: South Asia & Pacific Market Attractiveness Analysis by End Use
  • Figure 83: Middle East and Africa Market Value Share and BPS Analysis by Country, 2025 and 2035
  • Figure 84: Middle East and Africa Market Value Share and BPS Analysis by Material, 2025 and 2035
  • Figure 85: Middle East and Africa Market Y-o-Y Growth Comparison by Material, 2025-2035
  • Figure 86: Middle East and Africa Market Attractiveness Analysis by Material
  • Figure 87: Middle East and Africa Market Value Share and BPS Analysis by Packaging Format, 2025 and 2035
  • Figure 88: Middle East and Africa Market Y-o-Y Growth Comparison by Packaging Format, 2025-2035
  • Figure 89: Middle East and Africa Market Attractiveness Analysis by Packaging Format
  • Figure 90: Middle East and Africa Market Value Share and BPS Analysis by End Use, 2025 and 2035
  • Figure 91: Middle East and Africa Market Y-o-Y Growth Comparison by End Use, 2025-2035
  • Figure 92: Middle East and Africa Market Attractiveness Analysis by End Use
  • Figure 93: Global Market - Tier Structure Analysis
  • Figure 94: Global Market - Company Share Analysis

Frequently Asked Questions

What is the projected market size of the protective packaging industry by 2035?

The industry is expected to reach USD 47.6 billion by 2035, growing from USD 30.1 billion in 2025.

What is the compound annual growth rate (CAGR) of the protective packaging market during 2025 to 2035?

The industry is forecast to expand at a CAGR of 4.7% between 2025 and 2035.

Which material type leads demand in 2025 in protective packaging?

Plastic leads with a 39% share.

Which end-use segment accounts for the largest share in 2025?

Logistics and transportation contribute 36% of total demand.

Who is the leading player in the global protective packaging market in 2025?

Sealed Air Corporation holds the highest market share at 19% in 2025.

Explore Similar Insights

Future Market Insights

Protective Packaging Market