

- Market Size (2026)
- USD 116.5 Mn
- Forecast (2036)
- USD 231.3 Mn
- CAGR (2026 to 2036)
- 7.1%
How Big is the Pumpkin Puree Market in 2026?
The pumpkin puree market is estimated at USD 116.5 million in 2026.
The global pumpkin puree market was valued at USD 108.8 million in 2025 and is estimated to reach USD 116.5 million in 2026. The market is projected to reach USD 231.3 million by 2036, expanding at a compound annual growth rate (CAGR) of 7.1% between 2026 and 2036. Standard grade accounted for the largest share of the market, contributing 42.0% of total revenue in 2026. Demand is supported by seasonal and year-round bakery products that use pumpkin for its colour, flavour and moisture. Raw material supply is concentrated in the United States. According to the United States Department of Agriculture (USDA) Economic Research Service, total US pumpkin production reached 1.47 billion pounds in 2025, up about 4.0% from 2024 but 7.0% below the 2022 to 2024 average of 1.58 billion pounds[1]. Illinois, the main source of processing pumpkins, produced about 533 million pounds, and nearly 70.0% of its pumpkin acreage is devoted to processing into products such as puree[1]. The value of US pumpkin production declined from USD 286.0 million in 2022 to USD 259.0 million in 2025[1].
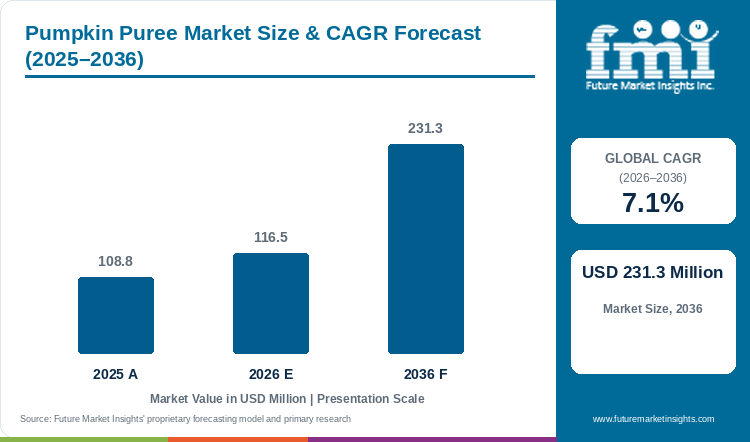
Table 1: Pumpkin Puree Market Size and Forecast (USD million), 2025 to 2036
| Market size and forecast | Value |
|---|---|
| 2025 market size | USD 108.8 million |
| Estimated market size in 2026 | USD 116.5 million |
| Projected market size by 2036 | USD 231.3 million |
| CAGR (2026-2036) | 7.1% |
| Added revenue, 2026 to 2036 | USD 114.8 million |
Key Market Trends & Insights
- By Product Type: The Standard grade segment accounted for the largest share of the pumpkin puree market in 2026, representing 42.0% of total market revenue.
- By Form: Powder / dry products held the leading market position with a share of 48.0% in 2026.
- By Application: Bread & rolls remained the largest application segment, accounting for 32.0% of the market in 2026.
Regional Highlights
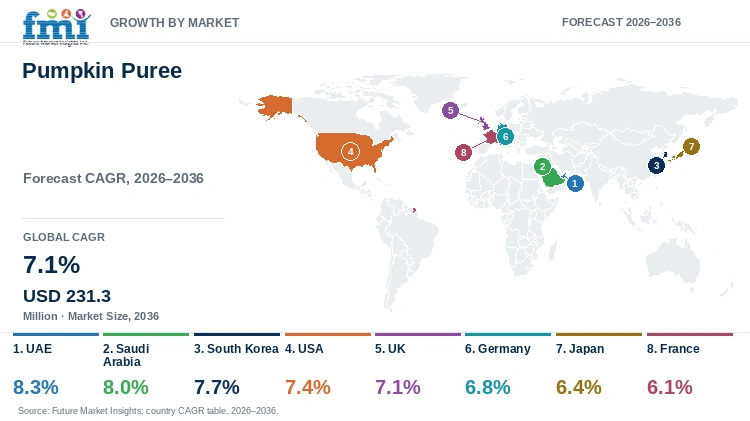
- Fastest-growing country: The UAE is expected to record the highest growth rate among the eight profiled countries, with a projected CAGR of 8.3% between 2026 and 2036.
- Growth across other countries: Saudi Arabia is projected to expand at a CAGR of 8.0%, followed by South Korea at 7.7% and the USA at 7.4%. France is expected to register comparatively slower growth, with a CAGR of 6.1% during the forecast period.
The availability of processing pumpkins remains the most important factor influencing puree supply. USDA reports that Illinois harvested 14,800 acres in 2025, nearly twice as many as any other leading state, and grew an average of about 37,000 pounds per acre over 2022 to 2025, mainly pie varieties for processing[1]. Illinois also accounts for nearly 15.0% of the 959 processing pumpkin farms in the United States[1]. Prices for processing pumpkins are low compared with fresh and ornamental varieties. Illinois reported an average price of USD 48.0 per 1,000 pounds in 2025, compared with about USD 269.0 in Pennsylvania[1]. This low farm price means that processing, packaging and distribution account for most of the cost of puree supplied to bakery ingredient assortments.
Other bakery input costs are rising. The Food and Agriculture Organization of the United Nations (FAO) Sugar Price Index stood 14.7% above its year-earlier level in September 2026, while its Cereal Price Index was 17.2% higher[5]. In the United States, prices for sugar and sweets are forecast to rise by 6.6% in 2026, while egg prices, which affect pumpkin pie and custard recipes, are forecast to fall by 29.4%[6]. Format choice also affects use. A 2024 study examined how maltodextrin concentration affects the properties of spray-dried pumpkin powder[3], so dry ingredients require a comparison of pumpkin solids and carrier content. Wet puree supplies a different balance of water and solids and requires separate handling.
Packaging is part of the purchasing decision. Seneca offers pumpkin in aseptic commercial formats, including large totes and bag-in-box packs[4], and pack selection affects unloading, storage and the rate at which opened material is used. A seasonal run and a continuing product can require different order quantities even when they use the same puree. Certified sourcing adds another condition, as USDA's Strengthening Organic Enforcement rule, implemented in March 2024, addresses records and organic import certificates[2]. Per-capita pumpkin availability in the United States was 5.2 pounds in 2025[1], which indicates steady consumer demand for pumpkin products.
Table 2: Supporting Industry Indicators for the Pumpkin Puree Market, 2022 to 2026
| Indicator | Data point | Why it matters | Source |
|---|---|---|---|
| US production | US pumpkin production reached 1.47 billion pounds in 2025, up about 4.0% from 2024 but 7.0% below the 2022 to 2024 average. | Total production sets the upstream supply context for puree. | [1] |
| Production value | The value of US pumpkin production fell from USD 286.0 million in 2022 to USD 259.0 million in 2025. | Lower farm values indicate falling raw material prices. | [1] |
| Illinois output | Illinois produced about 533 million pounds of pumpkins on 14,800 acres in 2025. | Illinois is the main source of processing pumpkins. | [1] |
| Processing share | Nearly 70.0% of Illinois pumpkin acreage is devoted to processing. | Processing acreage determines puree raw material supply. | [1] |
| Farm price | Illinois reported the lowest average pumpkin price in 2025, at USD 48.0 per 1,000 pounds. | Low farm prices mean processing dominates puree cost. | [1] |
| Consumer availability | US per-capita pumpkin availability was 5.2 pounds in 2025. | Steady availability indicates stable consumer demand. | [1] |
| Sugar prices | The FAO Sugar Price Index stood 14.7% above its year-earlier level in September 2026. | Sugar is a major input in pumpkin bakery products. | [5] |
| Egg prices | US egg prices are forecast to fall by 29.4% in 2026. | Lower egg costs reduce the cost of pumpkin custard and pie recipes. | [6] |
| Organic records | USDA implemented Strengthening Organic Enforcement in March 2024. | Certified purchasing requires aligned documentation. | [2] |
| Powder research | A 2024 study examined maltodextrin concentration in spray-dried pumpkin powder. | Carrier content shapes the dry ingredient specification. | [3] |
| Pack formats | Seneca lists aseptic pumpkin in large totes and bag-in-box formats. | Pack scale affects handling and stock rotation. | [4] |
Demand Intensity Analysis
A comparison of FMI's market estimate with US farm data provides a measure of value added by processing. Illinois produced about 533 million pounds of pumpkins in 2025 at an average price of USD 48.0 per 1,000 pounds[1], which implies a farm value of approximately USD 25.6 million. FMI estimated the global pumpkin puree market at USD 108.8 million in 2025, which is approximately 4.3 times the farm value of the Illinois crop. The comparison indicates that processing, packaging and distribution account for most of the value of puree used in bakery.
The national figures provide another reference point. The total value of US pumpkin production was USD 259.0 million in 2025[1], and FMI's market estimate is equivalent to approximately 42.0% of that value. Since most US pumpkins are sold for fresh and ornamental use, the processing segment represents only a part of the national crop value.
A similar comparison can be made between projected market growth and pumpkin supply. US pumpkin production in 2025 was 7.0% below the 2022 to 2024 average, while the value of production fell by approximately 9.4% between 2022 and 2025[1]. FMI expects the pumpkin puree market to grow at a CAGR of 7.1% between 2026 and 2036, which implies that growth will rely on new bakery applications and dry formats rather than on growth in pumpkin production.
Segment values show where demand is concentrated. Powder / dry accounted for USD 55.9 million of Form revenue in 2026, while Standard grade represented USD 48.9 million on the Product Type axis. Bread & rolls accounted for USD 37.3 million of Application revenue, and Direct to industrial bakeries represented USD 53.6 million.
FMI projects added revenue of USD 114.8 million between 2026 and 2036, taking the market to 2.0 times its 2026 value. The recurring ingredient requirement depends on how many accepted recipes can retain a stable pumpkin specification through seasonal and regular production.
Table 3: Demand Intensity Metrics for the Pumpkin Puree Market, 2025 Farm Data Against 2025 and 2026 Market Values
| Demand intensity metric | Value | Basis |
|---|---|---|
| FMI market value, 2025 | USD 108.8 million | FMI estimate of pumpkin puree revenue. |
| Illinois pumpkin production, 2025 | 533 million pounds | USDA ERS. |
| Illinois average farm price, 2025 | USD 48.0 per 1,000 pounds | USDA ERS. |
| Implied Illinois farm value, 2025 | Approximately USD 25.6 million | 533 million pounds multiplied by USD 48.0 per 1,000 pounds. |
| FMI value as a multiple of Illinois farm value | Approximately 4.3 times | USD 108.8 million divided by USD 25.6 million. |
| US pumpkin production value, 2025 | USD 259.0 million | USDA ERS. |
| FMI value as a share of US production value | Approximately 42.0% | USD 108.8 million divided by USD 259.0 million. |
| Change in US production value, 2022 to 2025 | Approximately -9.4% | USD 286.0 million to USD 259.0 million. |
| FMI value CAGR, 2026 to 2036 | 7.1% | FMI market forecast. |
| Powder / dry revenue, 2026 | USD 55.9 million | 48.0% of the market. |
| Direct industrial bakery revenue, 2026 | USD 53.6 million | 46.0% of the market. |
| Market expansion multiple | 2.0 times | Projected 2036 market value relative to 2026. |
Analyst Perspective
"Processing pumpkins are cheap at the farm gate, so the value in this market is in turning one autumn harvest into a puree or powder that bakeries can use the same way all year."
- Nandini Roy Choudhury, Principal Analyst at Future Market Insights
How is the pumpkin puree market segmented?
The pumpkin puree market is segmented by product type, form, application, claim and sales channel. Product Type comprises Standard grade, Premium / specialty grade, Organic certified and Clean label grade. Form comprises Powder / dry, Liquid, Paste / semi-solid and Granules / pieces. Application comprises Bread & rolls, Cakes & muffins, Biscuits & cookies, Viennoiserie & pastry and Other bakery & snacks. Claim comprises Conventional, Clean label, Organic and Non-GMO / identity preserved. Sales Channel comprises Direct to industrial bakeries, Ingredient distributors, Foodservice & artisan supply and Online B2B.
Why does Standard grade anchor the Product Type mix?
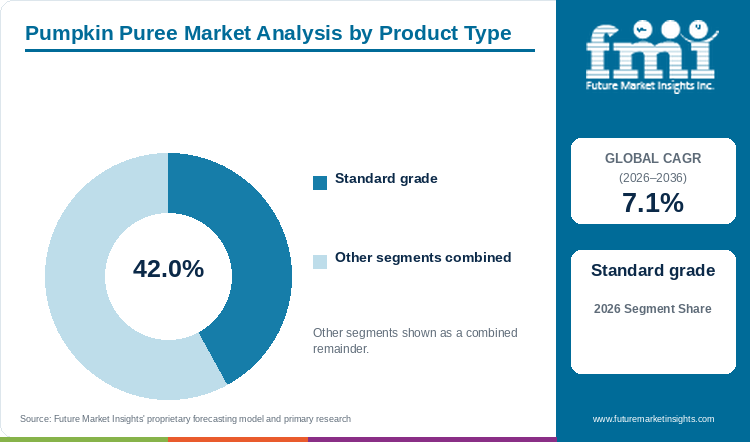
Standard grade represents 42.0% of Product Type revenue in 2026.
An accepted bread or cake recipe depends on the colour, solids and consistency of the pumpkin grade, and Standard grade generated approximately USD 48.9 million in 2026. A standard specification preserves these properties as a common reference for later deliveries. Since Illinois, which grows mainly pie varieties for processing, produces more pumpkins than the next four states combined[1], harvest conditions in a single region can affect the material delivered. Premium or certified preparations introduce further distinctions while remaining subject to the same formulation requirements. Routine purchasing benefits from a stable grade that limits adjustment across incoming lots.
- Standard grade represents 42.0% of Product Type revenue in 2026.
- The colour and consistency agreed during the recipe trial become the reference for later deliveries.
What makes Powder / dry the principal Form?
Powder / dry holds 48.0% of Form revenue in 2026.
Bakeries using dry pumpkin preparations can add vegetable solids separately from the recipe's water, which helps explain why Powder / dry accounted for approximately USD 55.9 million in 2026. Powder can also be stored year-round, which reduces dependence on a single autumn harvest. A 2024 study examined how maltodextrin concentration affected spray-dried pumpkin powder[3], so carrier content matters alongside pumpkin solids when comparing powders or evaluating them against wet puree. Dispersion, colour and liquid requirements determine the usable dose in the complete recipe.
- Powder / dry holds 48.0% of Form revenue in 2026.
- Carrier content and pumpkin solids determine the starting point for hydration and dosing.
Why do Bread & rolls set the pace for Application?
Bread & rolls represent 32.0% of Application revenue in 2026.
Pumpkin breads and rolls accounted for approximately USD 37.3 million of revenue in 2026. Pumpkin puree changes a bread dough's balance of water and solids, so mixing and shaping must be assessed with those changes in place, followed by the crumb's appearance and eating texture after normal storage. A dry preparation provides another route but needs a separate hydration method. The full loaf or roll shows whether the desired mild vegetable character is present and whether the dough remains manageable. Once settled, the same specification may be used across several sizes.
- Bread & rolls represent 32.0% of Application revenue in 2026.
- Mixing, shaping and stored crumb texture show the effect of pumpkin on the complete dough.
How does Conventional lead the Claim classification?
Conventional accounts for 53.0% of Claim revenue in 2026.
Conventional products accounted for 53.0% of Claim revenue in 2026. Plain puree and a sweetened or compounded preparation leave different formulation decisions to the bakery, which matters even where neither carries an additional claim. Organic procurement adds certification and traceability requirements, and USDA's Strengthening Organic Enforcement rule, implemented in March 2024, addresses recordkeeping and organic import certificates[2]. Across both routes, the declared composition must remain aligned with the actual recipe.
- Conventional accounts for 53.0% of Claim revenue in 2026.
- Certification and traceability records need to follow the ingredient through any organic purchasing route.
Why is Direct to industrial bakeries the leading Sales Channel?
Direct to industrial bakeries contributes 46.0% of Sales Channel revenue in 2026.
For an industrial bakery, pack size often determines whether direct processor supply is practical, and direct sales accounted for approximately USD 53.6 million in 2026. Seneca's aseptic pumpkin range includes large totes and bag-in-box formats[4]. The plant needs to accommodate unloading and storage, then use opened material within its normal schedule. Direct discussions connect these requirements with consistency limits and expected seasonal orders, which is especially important because processing pumpkins are harvested once a year[1]. Smaller bakeries may obtain puree through distributors.
- Direct to industrial bakeries contributes 46.0% of Sales Channel revenue in 2026.
- Unloading capacity and opened-pack consumption help determine the practical supply format.
What are the drivers, restraints and opportunities in the pumpkin puree market?
Pumpkin can move from a seasonal launch into a repeat recipe, although harvest concentration restrains supply flexibility, while format development can broaden the customers a processor serves.
Pumpkin can move from a seasonal launch into a repeat recipe
Seasonal pumpkin products create an initial requirement for an ingredient that can be handled efficiently within a defined menu period. Its later role depends on the texture obtained in dough or batter and the amount usable from an opened pack. With US per-capita pumpkin availability at 5.2 pounds in 2025[1], consumer familiarity supports the extension of pumpkin products beyond the autumn season. Spice and flavor ingredients can change the surrounding sensory profile while leaving the underlying pumpkin preparation in place. A grade that works across compatible sizes or recipes can support purchasing beyond a single short run.
Harvest concentration restrains supply flexibility
Processing pumpkin supply is concentrated in Illinois, which produced about 533 million pounds in 2025, more than the combined output of the other four leading states[1]. A poor harvest in this region would affect puree availability across the industry. US production in 2025 was also 7.0% below the 2022 to 2024 average[1]. Changes in solids or texture between harvests can alter liquid requirements and dough handling, which makes the accepted specification important. Alternative material can require another application assessment before it enters an established recipe, so sufficient planning time and inventory are needed ahead of seasonal production.
Format development can broaden the customers a processor serves
Different bakery processes create room for more than one pumpkin format. A wet puree fits liquid handling, while a dry preparation can enter a flour blend or a separate hydration step, with carrier composition affecting powder properties[3]. Low farm prices for processing pumpkins, at USD 48.0 per 1,000 pounds in Illinois in 2025[1], give processors room to invest in higher-value formats. Further formulation into pumpkin bakery fillings adds control over sweetness and texture. Packaging needs to follow the rate of use, as a modest launch and an established run may need the same grade in different quantities.
Which country CAGRs are profiled in the pumpkin puree market?
Table 4: Country growth outlook for the pumpkin puree market
| Country | CAGR |
|---|---|
| UAE | 8.3% |
| Saudi Arabia | 8.0% |
| South Korea | 7.7% |
| USA | 7.4% |
| UK | 7.1% |
| Germany | 6.8% |
| Japan | 6.4% |
| France | 6.1% |
UAE
- The UAE is the fastest-growing market among the profiled countries, with a forecast CAGR of 8.3% from 2026 to 2036. For UAE hotel and specialty bakery production, the rate at which an opened pack is used determines the practical scale of pumpkin purchasing. Seasonal cakes, loaves and pastry centres can begin with limited quantities, so can size or a larger aseptic format matters. Consistency in colour and solids preserves the formula when the product returns to the menu.
Saudi Arabia
- In Saudi sweet-roll and cake recipes, pumpkin puree changes the liquid balance in different ways, so addition sequence and finished texture determine the specification for each use. Saudi Arabia is projected to grow at a CAGR of 8.0% from 2026 to 2036. Smaller distributor orders support initial development, while larger packs become relevant as use increases. A consistent composition allows accepted recipes to continue as order quantities change.
South Korea
- With a forecast CAGR of 7.7% for 2026 to 2036, South Korea ranks third among the profiled countries. Pumpkin blended through a soft bread is prepared differently from a centre for a filled bun or cream-based pastry, so information on sweetness and water contribution helps distinguish these uses. Small quantities allow the bakery to compare several recipes before committing to one, and the preparation's consistency then allows the product to move into a regular schedule.
USA
- The United States is the main source of processing pumpkins, with Illinois producing about 533 million pounds in 2025[1]. The USA is forecast to grow at a CAGR of 7.4% from 2026 to 2036. Seneca's industrial offerings show that puree is available at different pack scales[4]. Selecting among those formats requires an understanding of consumption rate and the point at which puree enters the recipe. Discussing seasonal orders early helps align the supply plan with expected use, given that the crop is harvested once a year.
UK
- UK loaf and muffin recipes need pumpkin's flavour, colour and texture to remain balanced with spice and liquid addition. The UK is forecast to grow at a CAGR of 7.1% from 2026 to 2036. Manageable order quantities give specialty producers room to establish the formula without holding excessive stock, and continued distributor availability becomes relevant when the product enters a regular menu.
Germany
- German bakeries can compare pumpkin formats on water, solids and mixing time. A dry preparation may fit the existing weighing sequence, while a wet puree requires a separate addition and storage arrangement. Germany is projected to grow at a CAGR of 6.8% from 2026 to 2036. Organic preparations can serve a particular product position when sourcing records are maintained under rules such as USDA's Strengthening Organic Enforcement for US-origin material[2].
Japan
- In Japanese bakery products, the amount of pumpkin in each portion shapes ingredient selection, as a small smooth centre needs a different intensity from puree blended through dough. Japan is projected to grow at a CAGR of 6.4% for 2026 to 2036. Trial samples and clear information about water and solids help establish that difference, and packaging needs to fit the actual consumption rate as well as the development plan.
France
- France is expected to register the slowest growth among the profiled countries, with a forecast CAGR of 6.1% from 2026 to 2036. A plain puree lets a French pastry kitchen set its own sweetness and seasoning in creams or small cakes, while a larger bakery places more weight on viscosity and consistent mechanical dosing. Development work needs to follow the actual recipe and storage conditions to establish whether pumpkin contributes enough flavour and texture for the item to stay in the range after its seasonal launch.
Who are the notable companies in the pumpkin puree market?
Nestlé / Libby’s; Seneca Foods; SVZ; Ariza; Farmer’s Market Foods
Nestlé / Libby's and Seneca Foods supply identifiable pumpkin products, alongside puree options from SVZ, Ariza and Farmer's Market Foods. US supply depends heavily on Illinois, which accounts for nearly 15.0% of the country's 959 processing pumpkin farms, and devotes nearly 70.0% of its pumpkin acreage to processing[1]. Seneca's industrial packs show how one ingredient category can serve several production scales[4].
The grade itself remains the useful unit of comparison. Variety, colour, consistency and declared ingredients affect the recipe, while packaging determines handling. Maintaining these properties across harvests reduces the adjustment needed when new supplies enter production.
Competitive Benchmarking: Pumpkin Puree Market
Table 5: Company capabilities in the pumpkin puree market
| Company | Relevant offering | Purchasing consideration |
|---|---|---|
| Nestlé / Libby’s | Canned 100.0% pure pumpkin in foodservice packs | Match can size and opened-product handling to use |
| Seneca Foods | Pumpkin puree in canned and aseptic industrial formats | Choose between cans, bag-in-box and large totes |
| SVZ | Orange and white pumpkin single-strength purees | Select variety and color for the finished product |
| Ariza | Organic pumpkin puree in professional formats | Align organic sourcing with the desired application |
| Farmer’s Market Foods | Organic unsweetened pumpkin puree | Plan pack use around small-batch production |
Key Developments in the Pumpkin Puree Market
- In September 2026, USDA ERS reported US pumpkin production of 1.47 billion pounds in 2025, with Illinois producing about 533 million pounds and devoting nearly 70.0% of its pumpkin acreage to processing[1].
- In 2024, a study in the Journal of Tropical Agriculture examined maltodextrin concentration in spray-dried pumpkin powder[3].
- In September 2026, USDA forecast that US sugar and sweets prices would rise by 6.6% in 2026, while egg prices would fall by 29.4%[6].
- In October 2026, the FAO reported that its Sugar Price Index was 14.7% higher than a year earlier[5].
Key Players in the Pumpkin Puree Market
- Nestlé / Libby’s
- Seneca Foods
- SVZ
- Ariza
- Farmer’s Market Foods
Pumpkin Puree Market - Report Scope
Table 6: Report scope for the pumpkin puree market
| Coverage field | Report scope |
|---|---|
| Market breakdown | Product Type; Form; Application; Claim; Sales Channel |
| Quantitative Units | USD Million |
| Market Definition | Revenue from pumpkin puree and qualifying dehydrated or concentrated pumpkin preparations sold within the named bakery ingredient segments. Excludes finished bread and pastry revenue, generic pumpkin spice mixes without puree, pumpkin seeds, extracts, alternative vegetable preparations and unrelated coatings. For bundled products, only the separately attributable qualifying pumpkin preparation is in scope. |
| Regions Covered | North America; Latin America; Western Europe; Eastern Europe; East Asia; South Asia and Pacific; Middle East and Africa |
| Countries Covered | UAE; Saudi Arabia; South Korea; USA; UK; Germany; Japan; France |
| Key Companies Profiled | Nestlé / Libby’s; Seneca Foods; SVZ; Ariza; Farmer’s Market Foods |
| Forecast Period | 2026 to 2036 |
| Approach | Market assessment supported by official technical and regulatory publications, company product information and country operating conditions. |
Pumpkin Puree Market - Research Methodology
Table 7: Research approach for the pumpkin puree market
| Method | Approach |
|---|---|
| Market definition | The assessment separates qualifying ingredient revenue from finished bakery products and unrelated formulation inputs. |
| Secondary evidence | Government publications, regulatory material, technical literature and first-party product documentation establish the operating context. |
| Commercial assessment | Product performance, supply continuity and customer qualification requirements are considered within each segment and country profile. |
| Comparability | Market values, segment shares and country forecasts use the stated revenue boundary, units and forecast period. |
Pumpkin Puree Market by Segments
Product Type
- Standard grade
- Premium / specialty grade
- Organic certified
- Clean label grade
Form
- Powder / dry
- Liquid
- Paste / semi-solid
- Granules / pieces
Application
- Bread & rolls
- Cakes & muffins
- Biscuits & cookies
- Viennoiserie & pastry
- Other bakery & snacks
Claim
- Conventional
- Clean label
- Organic
- Non-GMO / identity preserved
Sales Channel
- Direct to industrial bakeries
- Ingredient distributors
- Foodservice & artisan supply
- Online B2B
Pumpkin Puree Market by Region
- North America
- United States
- Canada
- Latin America
- Brazil
- Mexico
- Argentina
- Chile
- Western Europe
- Germany
- France
- United Kingdom
- Italy
- Spain
- Benelux
- Nordics
- Eastern Europe
- Poland
- Czech Republic
- Romania
- Hungary
- East Asia
- China
- Japan
- South Korea
- South Asia and Pacific
- India
- ASEAN
- Australia and New Zealand
- Middle East and Africa
- GCC Countries
- South Africa
- Türkiye
- Israel
Research Sources and Bibliography
- [1] U.S. Department of Agriculture, Economic Research Service. (2026, September 29). Pumpkins: Background & statistics.
- [2] U.S. Department of Agriculture, Agricultural Marketing Service. (2024). Strengthening Organic Enforcement.
- [3] Swathi, B. S., & Mini, C. (2024). Influence of maltodextrin concentration on physico-chemical characteristics of spray dried pumpkin (Cucurbita moschata L.) powder.
- [4] Seneca Foods. (n.d.). Pumpkin.
- [5] Food and Agriculture Organization of the United Nations. (2026, October 2). FAO Food Price Index.
- [6] USDA Economic Research Service. (2026, September 25). Food price outlook: Summary findings.
Future Market Insights. (2026). Pumpkin Puree Market: Global Industry Analysis and Opportunity Assessment 2036.
This Report Answers
- What are the pumpkin puree market values in 2026 and 2036?
- How do pumpkin solids and texture influence bakery purchasing?
- Why does Standard grade lead Product Type in 2026?
- How should a bakery compare wet and dry pumpkin preparations?
- What are the forecast CAGRs in the eight profiled countries?
- Which suppliers offer identifiable pumpkin puree products?
Frequently Asked Questions
How big is the pumpkin puree market in 2026, and what is forecast for 2036?
The market is valued at USD 116.5 million in 2026 and is forecast to reach USD 231.3 million by 2036.
What is the pumpkin puree market CAGR from 2026 to 2036?
The market is forecast to grow at a CAGR of 7.1% from 2026 to 2036.
Which Product Type segment leads in 2026?
Standard grade leads with 42.0% in 2026, supported by recipes that require a reproducible specification.
Which Form segment has the highest share?
Powder / dry leads with 48.0% in 2026, and buyers should examine pumpkin solids and hydration requirements when selecting it.
Which profiled country has the fastest forecast growth?
The UAE leads at 8.3%, followed by Saudi Arabia at 8.0% and South Korea at 7.7% from 2026 to 2036.
Which companies are profiled?
The report profiles Nestlé / Libby's, Seneca Foods, SVZ, Ariza and Farmer's Market Foods.
Preview the report firsthand - request a free sample
Get SampleGet the brochure for pricing and purchase details.
Get PDFTable of Content
- Key Takeaways
- Market Size and CAGR
- Top Growth Driver
- Fastest Growing Segment
- Leading Region
- Key Companies
- Emerging Opportunities
- Executive Summary
- Global Market Outlook
- Demand-side Trends
- Supply-side Trends
- Technology Roadmap Analysis
- Analysis and Recommendations
- Analyst Perspective (What is happening? Why now? What should investors know?)
- Key Questions Answered
- How large is the market?
- What is the CAGR?
- What are key trends?
- Which region dominates?
- Who are the leaders?
- Market Overview
- Market Coverage / Taxonomy
- Market Definition / Scope / Limitations
- Research Methodology
- Chapter Orientation
- Analytical Lens and Working Hypotheses
- Market Structure, Signals, and Trend Drivers
- Benchmarking and Cross-market Comparability
- Market Sizing, Forecasting, and Opportunity Mapping
- Research Design and Evidence Framework
- Desk Research Programme (Secondary Evidence)
- Expert Input and Fieldwork (Primary Evidence)
- Tooling, Models, and Reference Databases
- Data Engineering and Model Build
- Quality Assurance and Audit Trail
- Market Background
- Market Dynamics (Drivers, Restraints, Opportunity, Trends)
- Scenario Forecast (Optimistic, Likely, Conservative)
- Impact Analysis
- AI Impact
- Sustainability Impact
- Regulatory Impact
- Technology Impact
- Consumer / Buyer Analysis
- Purchase Drivers
- Adoption Barriers
- Buyer Journey
- Opportunity Map Analysis
- Product Life Cycle Analysis
- Supply Chain Analysis
- Investment Feasibility Matrix
- Value Chain Analysis
- PESTLE and Porter's Analysis
- Regulatory Landscape
- Regional Parent Market Outlook
- Production and Consumption Statistics
- Import and Export Statistics
- Global Market Analysis and Forecast, 2021 to 2036
- Historical Market Size Value (USD Million) Analysis, 2021 to 2025
- Current and Future Market Size Value (USD Million) Projections, 2026 to 2036
- Y-o-Y Growth Trend Analysis
- Absolute $ Opportunity Analysis
- Global Market Pricing Analysis, 2021 to 2036
- Global Market Analysis and Forecast, By Product Type, 2021 to 2036
- Introduction / Key Findings
- Historical Market Size Value (USD Million) Analysis By Product Type, 2021 to 2025
- Current and Future Market Size Value (USD Million) Analysis and Forecast By Product Type, 2026 to 2036
- Standard grade
- Premium / specialty grade
- Organic certified
- Clean label grade
- Y-o-Y Growth Trend Analysis By Product Type, 2021 to 2025
- Absolute $ Opportunity Analysis By Product Type, 2026 to 2036
- Global Market Analysis and Forecast, By Form, 2021 to 2036
- Introduction / Key Findings
- Historical Market Size Value (USD Million) Analysis By Form, 2021 to 2025
- Current and Future Market Size Value (USD Million) Analysis and Forecast By Form, 2026 to 2036
- Powder / dry
- Liquid
- Paste / semi-solid
- Granules / pieces
- Y-o-Y Growth Trend Analysis By Form, 2021 to 2025
- Absolute $ Opportunity Analysis By Form, 2026 to 2036
- Global Market Analysis and Forecast, By Application, 2021 to 2036
- Introduction / Key Findings
- Historical Market Size Value (USD Million) Analysis By Application, 2021 to 2025
- Current and Future Market Size Value (USD Million) Analysis and Forecast By Application, 2026 to 2036
- Bread & rolls
- Cakes & muffins
- Biscuits & cookies
- Viennoiserie & pastry
- Other bakery & snacks
- Y-o-Y Growth Trend Analysis By Application, 2021 to 2025
- Absolute $ Opportunity Analysis By Application, 2026 to 2036
- Global Market Analysis and Forecast, By Claim, 2021 to 2036
- Introduction / Key Findings
- Historical Market Size Value (USD Million) Analysis By Claim, 2021 to 2025
- Current and Future Market Size Value (USD Million) Analysis and Forecast By Claim, 2026 to 2036
- Conventional
- Clean label
- Organic
- Non-GMO / identity preserved
- Y-o-Y Growth Trend Analysis By Claim, 2021 to 2025
- Absolute $ Opportunity Analysis By Claim, 2026 to 2036
- Global Market Analysis and Forecast, By Sales Channel, 2021 to 2036
- Introduction / Key Findings
- Historical Market Size Value (USD Million) Analysis By Sales Channel, 2021 to 2025
- Current and Future Market Size Value (USD Million) Analysis and Forecast By Sales Channel, 2026 to 2036
- Direct to industrial bakeries
- Ingredient distributors
- Foodservice & artisan supply
- Online B2B
- Y-o-Y Growth Trend Analysis By Sales Channel, 2021 to 2025
- Absolute $ Opportunity Analysis By Sales Channel, 2026 to 2036
- Global Market Analysis and Forecast, By Region, 2021 to 2036
- Introduction
- Historical Market Size Value (USD Million) Analysis By Region, 2021 to 2025
- Current Market Size Value (USD Million) Analysis and Forecast By Region, 2026 to 2036
- North America
- Latin America
- Western Europe
- Eastern Europe
- East Asia
- South Asia and Pacific
- Middle East and Africa
- Market Attractiveness Analysis By Region
- North America Market Analysis and Forecast, By Country, 2021 to 2036
- Historical Market Size Value (USD Million) Trend Analysis By Market Taxonomy, 2021 to 2025
- Market Size Value (USD Million) Forecast By Market Taxonomy, 2026 to 2036
- By Country
- United States
- Canada
- By Product Type
- By Form
- By Application
- By Claim
- By Sales Channel
- By Country
- Market Attractiveness Analysis
- By Country
- By Product Type
- By Form
- By Application
- By Claim
- By Sales Channel
- Key Takeaways
- Latin America Market Analysis and Forecast, By Country
- Historical Market Size Value (USD Million) Trend Analysis By Market Taxonomy, 2021 to 2025
- Market Size Value (USD Million) Forecast By Market Taxonomy, 2026 to 2036
- By Country
- Brazil
- Mexico
- Argentina
- Chile
- By Product Type
- By Form
- By Application
- By Claim
- By Sales Channel
- By Country
- Market Attractiveness Analysis
- By Country
- By Product Type
- By Form
- By Application
- By Claim
- By Sales Channel
- Key Takeaways
- Western Europe Market Analysis and Forecast, By Country
- Historical Market Size Value (USD Million) Trend Analysis By Market Taxonomy, 2021 to 2025
- Market Size Value (USD Million) Forecast By Market Taxonomy, 2026 to 2036
- By Country
- Germany
- France
- United Kingdom
- Italy
- Spain
- Benelux
- Nordics
- By Product Type
- By Form
- By Application
- By Claim
- By Sales Channel
- By Country
- Market Attractiveness Analysis
- By Country
- By Product Type
- By Form
- By Application
- By Claim
- By Sales Channel
- Key Takeaways
- Eastern Europe Market Analysis and Forecast, By Country
- Historical Market Size Value (USD Million) Trend Analysis By Market Taxonomy, 2021 to 2025
- Market Size Value (USD Million) Forecast By Market Taxonomy, 2026 to 2036
- By Country
- Poland
- Czech Republic
- Romania
- Hungary
- By Product Type
- By Form
- By Application
- By Claim
- By Sales Channel
- By Country
- Market Attractiveness Analysis
- By Country
- By Product Type
- By Form
- By Application
- By Claim
- By Sales Channel
- Key Takeaways
- East Asia Market Analysis and Forecast, By Country
- Historical Market Size Value (USD Million) Trend Analysis By Market Taxonomy, 2021 to 2025
- Market Size Value (USD Million) Forecast By Market Taxonomy, 2026 to 2036
- By Country
- China
- Japan
- South Korea
- By Product Type
- By Form
- By Application
- By Claim
- By Sales Channel
- By Country
- Market Attractiveness Analysis
- By Country
- By Product Type
- By Form
- By Application
- By Claim
- By Sales Channel
- Key Takeaways
- South Asia and Pacific Market Analysis and Forecast, By Country
- Historical Market Size Value (USD Million) Trend Analysis By Market Taxonomy, 2021 to 2025
- Market Size Value (USD Million) Forecast By Market Taxonomy, 2026 to 2036
- By Country
- India
- ASEAN
- Australia and New Zealand
- By Product Type
- By Form
- By Application
- By Claim
- By Sales Channel
- By Country
- Market Attractiveness Analysis
- By Country
- By Product Type
- By Form
- By Application
- By Claim
- By Sales Channel
- Key Takeaways
- Middle East and Africa Market Analysis and Forecast, By Country
- Historical Market Size Value (USD Million) Trend Analysis By Market Taxonomy, 2021 to 2025
- Market Size Value (USD Million) Forecast By Market Taxonomy, 2026 to 2036
- By Country
- GCC Countries
- South Africa
- Türkiye
- Israel
- By Product Type
- By Form
- By Application
- By Claim
- By Sales Channel
- By Country
- Market Attractiveness Analysis
- By Country
- By Product Type
- By Form
- By Application
- By Claim
- By Sales Channel
- Key Takeaways
- Key Countries Market Analysis
- United States
- Pricing Analysis
- Market Share Analysis, 2025
- By Product Type
- By Form
- By Application
- By Claim
- By Sales Channel
- Canada
- Pricing Analysis
- Market Share Analysis, 2025
- By Product Type
- By Form
- By Application
- By Claim
- By Sales Channel
- Mexico
- Pricing Analysis
- Market Share Analysis, 2025
- By Product Type
- By Form
- By Application
- By Claim
- By Sales Channel
- Brazil
- Pricing Analysis
- Market Share Analysis, 2025
- By Product Type
- By Form
- By Application
- By Claim
- By Sales Channel
- Chile
- Pricing Analysis
- Market Share Analysis, 2025
- By Product Type
- By Form
- By Application
- By Claim
- By Sales Channel
- Germany
- Pricing Analysis
- Market Share Analysis, 2025
- By Product Type
- By Form
- By Application
- By Claim
- By Sales Channel
- United Kingdom
- Pricing Analysis
- Market Share Analysis, 2025
- By Product Type
- By Form
- By Application
- By Claim
- By Sales Channel
- Italy
- Pricing Analysis
- Market Share Analysis, 2025
- By Product Type
- By Form
- By Application
- By Claim
- By Sales Channel
- Spain
- Pricing Analysis
- Market Share Analysis, 2025
- By Product Type
- By Form
- By Application
- By Claim
- By Sales Channel
- France
- Pricing Analysis
- Market Share Analysis, 2025
- By Product Type
- By Form
- By Application
- By Claim
- By Sales Channel
- India
- Pricing Analysis
- Market Share Analysis, 2025
- By Product Type
- By Form
- By Application
- By Claim
- By Sales Channel
- ASEAN
- Pricing Analysis
- Market Share Analysis, 2025
- By Product Type
- By Form
- By Application
- By Claim
- By Sales Channel
- Australia and New Zealand
- Pricing Analysis
- Market Share Analysis, 2025
- By Product Type
- By Form
- By Application
- By Claim
- By Sales Channel
- China
- Pricing Analysis
- Market Share Analysis, 2025
- By Product Type
- By Form
- By Application
- By Claim
- By Sales Channel
- Japan
- Pricing Analysis
- Market Share Analysis, 2025
- By Product Type
- By Form
- By Application
- By Claim
- By Sales Channel
- South Korea
- Pricing Analysis
- Market Share Analysis, 2025
- By Product Type
- By Form
- By Application
- By Claim
- By Sales Channel
- Poland
- Pricing Analysis
- Market Share Analysis, 2025
- By Product Type
- By Form
- By Application
- By Claim
- By Sales Channel
- Hungary
- Pricing Analysis
- Market Share Analysis, 2025
- By Product Type
- By Form
- By Application
- By Claim
- By Sales Channel
- Türkiye
- Pricing Analysis
- Market Share Analysis, 2025
- By Product Type
- By Form
- By Application
- By Claim
- By Sales Channel
- South Africa
- Pricing Analysis
- Market Share Analysis, 2025
- By Product Type
- By Form
- By Application
- By Claim
- By Sales Channel
- UAE
- Pricing Analysis
- Market Share Analysis, 2025
- By Product Type
- By Form
- By Application
- By Claim
- By Sales Channel
- Saudi Arabia
- Pricing Analysis
- Market Share Analysis, 2025
- By Product Type
- By Form
- By Application
- By Claim
- By Sales Channel
- United States
- Market Structure Analysis
- Competition Dashboard
- Competition Benchmarking
- Market Share Analysis of Top Players
- By Regional
- By Product Type
- By Form
- By Application
- By Claim
- By Sales Channel
- Emerging Startups
- Innovation Benchmarking
- Competition Analysis
- Competition Deep Dive
- Nestlé / Libby’s
- Overview
- Product Portfolio
- Profitability by Market Segments
- Sales Footprint
- Strategy Overview
- Marketing Strategy
- Product Strategy
- Channel Strategy
- Seneca Foods
- SVZ
- Ariza
- Farmer’s Market Foods
- Nestlé / Libby’s
- Case Studies
- Success Stories
- Recent Developments
- Competition Deep Dive
- Assumptions & Acronyms Used


